Health Care Utilization Among U.S. Adults With Diagnosed Diabetes, 2013
- Key findings
- The percentage of U.S. adults with diagnosed diabetes increased with age.
- The percentage of adults with diagnosed diabetes who had contact with a doctor or health care professional in the past 6 months increased with age.
- The percentage of adults with diagnosed diabetes who were taking any medication to control their glucose levels increased with age.
- The percentage of adults with diagnosed diabetes who had contact with an eye or foot care specialist during the past 12 months increased with age.
- Among adults with diagnosed diabetes, those aged 18–39 were the least likely to have had their blood pressure or blood cholesterol checked by a doctor, nurse, or other health professional during the past 12 months.
- Summary
- Definitions
- Data source and methods
- About the authors
- References
- Suggested citation
NCHS Data Brief No. 183, February 2015
PDF Version (668 KB)
Maria A. Villarroel, Ph.D.; Anjel Vahratian, Ph.D.; and Brian W. Ward, Ph.D.
Key findings
Data from the National Health Interview Survey, 2013
- Nine percent of adults aged 18 and over have diagnosed diabetes, and more than 8 in 10 of these adults had contact with a doctor or health care professional in the past 6 months.
- The percentage of adults with diagnosed diabetes who were taking any medication to control their glucose levels increased with age.
- The percentage of adults with diagnosed diabetes who had contact with an eye or foot care specialist in the past 12 months increased with age.
- Among adults with diagnosed diabetes, those aged 18–39 were the least likely to have had their blood pressure or blood cholesterol checked by a doctor, nurse, or other health professional during the past 12 months.
Diabetes is a chronic medical condition that affects 1 in 10 adults in the United States (1). Diabetes can affect multiple organs and lead to serious health complications (2). Ongoing medical care is recommended for persons of any age who have diabetes in order to manage levels of glucose, obtain preventive care services, and treat diabetes-related complications (2,3). This report describes differences by age in the utilization of selected medical care services among adults aged 18 and over with diagnosed diabetes, based on data from the 2013 National Health Interview Survey (NHIS).
Keywords: chronic disease, age differences, medical care, National Health Interview Survey
The percentage of U.S. adults with diagnosed diabetes increased with age.
- Overall, 9.3% of adults aged 18 and over have diagnosed diabetes (Figure 1).
Figure 1. Percentage of adults aged 18 and over with diagnosed diabetes, by age group: United States, 2013
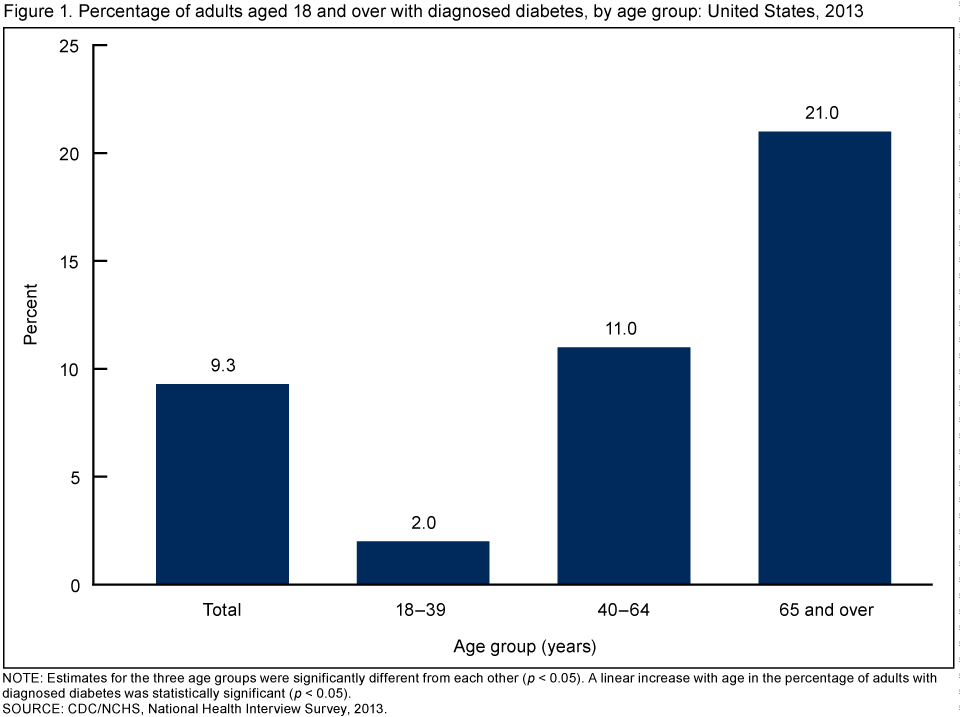
NOTE: Estimates for the three age groups were significantly different from each other (p < 0.05). A linear increase with age in the percentage of adults with diagnosed diabetes was statistically significant (p < 0.05).
SOURCE: CDC/NCHS, National Health Interview Survey, 2013.
- Two percent of adults aged 18–39 have diagnosed diabetes compared with 11.0% of adults aged 40–64 and 21.0% of adults aged 65 and over.
The percentage of adults with diagnosed diabetes who had contact with a doctor or health care professional in the past 6 months increased with age.
- About 90% of adults with diagnosed diabetes had contact with a doctor or health care professional in the past 6 months (Figure 2).
- Among adults with diagnosed diabetes, 81.1% of those aged 18–39 had contact with a doctor or health care professional about their own health in the past 6 months, with the percentage increasing to 88.9% among those aged 40–64 and 93.3% among those aged 65 and over.
Figure 2. Percentage of persons who had contact with a doctor or health care professional about their own health in the past 6 months, among adults with diagnosed diabetes, by age group: United States, 2013
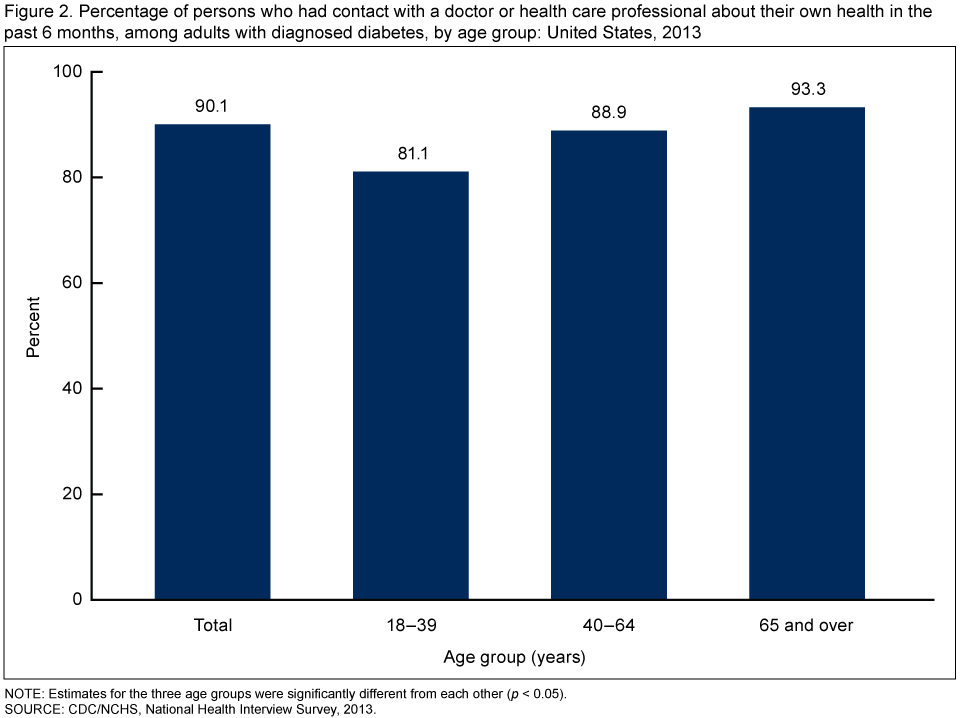
NOTE: Estimates for the three age groups were significantly different from each other (p < 0.05).
SOURCE: CDC/NCHS, National Health Interview Survey, 2013.
The percentage of adults with diagnosed diabetes who were taking any medication to control their glucose levels increased with age.
- An estimated 28.8% of adults aged 18–39 with diagnosed diabetes were not taking any medication to control their glucose levels, compared with 14.3% of adults aged 40–64 and 13.5% of adults aged 65 and over (Figure 3).
- Adults aged 18–39 with diagnosed diabetes were more than twice as likely (31.3%) as those aged 40–64 (13.9%) and those aged 65 and over (12.3%) to take insulin only to control their glucose levels.
- Among adults with diagnosed diabetes, the percentage of adults taking only diabetes pills increased with age—30.6% for those aged 18–39, 54.5% for those aged 40–64, and 59.9% those aged 65 and over.
Figure 3. Percent distribution of diabetes medication use among adults with diagnosed diabetes, by age group: United States, 2013
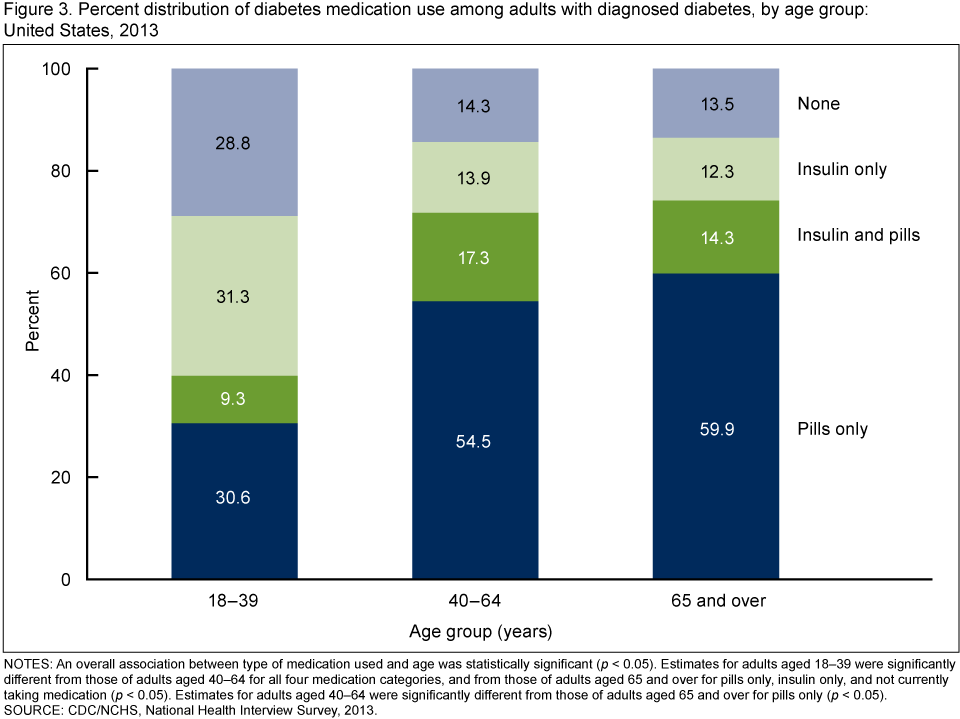
NOTES: An overall association between type of medication used and age was statistically significant (p < 0.05). Estimates for adults aged 18–39 were significantly different from those of adults aged 40–64 for all four medication categories, and from those of adults aged 65 and over for pills only, insulin only, and not currently taking medication (p < 0.05). Estimates for adults aged 40–64 were significantly different from those of adults aged 65 and over for pills only (p < 0.05).
SOURCE: CDC/NCHS, National Health Interview Survey, 2013.
The percentage of adults with diagnosed diabetes who had contact with an eye or foot care specialist during the past 12 months increased with age.
- More than one-third of adults aged 18–39 with diagnosed diabetes (35.9%) had contact with an optometrist, ophthalmologist, or eye doctor during the past 12 months (Figure 4).
- In contrast, more than one-half of adults aged 40–64 (54.3%) and about two-thirds of those aged 65 and over (64.9%) with diagnosed diabetes had contact with an optometrist, ophthalmologist, or eye doctor during the past 12 months.
- Adults with diagnosed diabetes aged 65 and over were 1.5 times as likely (28.0%) as those aged 40–64 (18.7%), and 2.5 times as likely as those aged 18–39 (11.1 %), to have had contact with a foot doctor during the past 12 months.
Figure 4. Percentage of persons who had contact with a specialist in eye or foot care during the past 12 months, among adults with diagnosed diabetes, by age group: United States, 2013
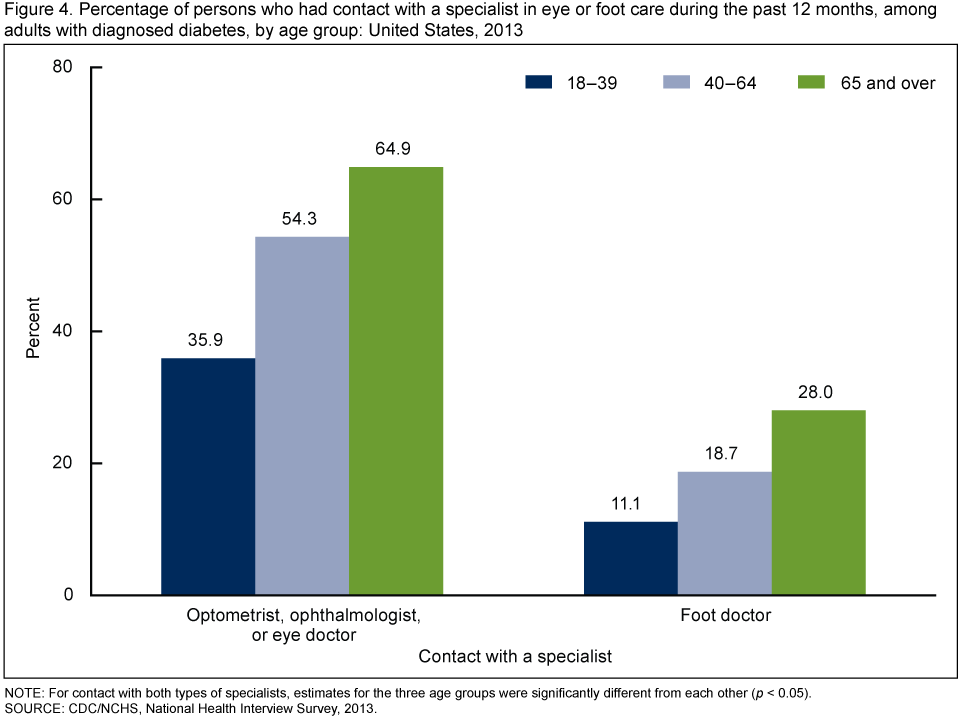
NOTE: For contact with both types of specialists, estimates for the three age groups were significantly different from each other (p < 0.05).
SOURCE: CDC/NCHS, National Health Interview Survey, 2013.
Among adults with diagnosed diabetes, those aged 18–39 were the least likely to have had their blood pressure or blood cholesterol checked by a doctor, nurse, or other health professional during the past 12 months.
- An estimated 89.9% of adults aged 18–39 with diagnosed diabetes had their blood pressure checked by a doctor, nurse, or other health professional during the past 12 months, compared with 95.0% of adults aged 40–64 and 97.4% of adults aged 65 and over (Figure 5).
- More than 90% of adults aged 40 and over with diagnosed diabetes had their blood cholesterol checked by a doctor, nurse, or other health professional during the past 12 months, compared with 71.9% of adults aged 18–39.
Figure 5. Percentage of persons who had their blood pressure or blood cholesterol checked by a doctor, nurse, or other health professional during the past 12 months, among adults with diagnosed diabetes, by age group: United States, 2013

NOTE: For both types of checkup, estimates for the three age groups were significantly different from each other (p < 0.05).
SOURCE: CDC/NCHS, National Health Interview Survey, 2013.
Summary
Use of selected standard medical care services recommended by the American Diabetes Association (ADA) varies by age among adults with diagnosed diabetes. ADA recommends that adults with diabetes have a health care provider assess the effectiveness of their glycemic control biannually for those meeting stable glycemic levels, and quarterly or more frequently for those with therapeutic changes and receiving intensive disease management (2). In the present report, 19% of adults with diagnosed diabetes aged 18–39 had not had contact with a doctor or health care professional in the past 6 months, compared with 11% of adults with diagnosed diabetes aged 40–64 and 7% of those aged 65 and over.
ADA recommends that a comprehensive diabetes disease clinical management be comprised of at least annual assessment of cardiovascular and nephropathy risk factors (2). Biometric blood cholesterol and blood pressure checks are two of several measures for monitoring these diabetes-related comorbidities. Although the majority of adults with diagnosed diabetes had their blood cholesterol and blood pressure checked during the past 12 months, adults with diagnosed diabetes aged 18–39 were less likely to have received these measures than adults with diagnosed diabetes aged 40 and over. Correspondingly, contact with an eye or foot specialist in the past year among adults with diagnosed diabetes gradually increased with age. Retinal damage and nerve damage to the feet are diabetes-related complications that contribute to major morbidity and disability among adults with diabetes, and they are conditions for which annual or biannual examinations may help identify signs of risk and guide early treatment (2,4).
The type of treatment received to control blood glucose levels also varied by age. Adults aged 18–39 with diagnosed diabetes were more likely than those aged 40 and over to take insulin alone to control their glucose levels. Adults aged 40 and over were more likely to use both insulin and diabetic pills than those aged 18–39. The use of diabetic pills alone to control blood glucose levels increased with age.
Ongoing risk-reduction medical care services for persons with diabetes may favorably impact health outcomes and quality of life in later years (2).
Definitions
Diagnosed diabetes: Based on a positive response to the survey question, “Have you ever been told by a doctor or health professional that you have diabetes or sugar diabetes?” Women were asked to exclude diagnoses received only during pregnancy.
Contact with a doctor or health care professional: Based on the response “6 months or less” compared with a response of a longer interval or “never” to the survey question, “About how long has it been since you last saw or talked to a doctor or other health care professional about your own health? Include doctors seen while a patient in a hospital.”
Diabetes medication use: Based on combined responses to the survey questions, “Are you now taking diabetic pills to lower your blood sugar? These are sometimes called oral agents or oral hypoglycemic agents” and “Are you now taking insulin?”
Contact with a specialist: Based on a separate positive survey response to having seen or talked to “an optometrist, ophthalmologist, or eye doctor (someone who prescribes eyeglasses)” or “a foot doctor” when questioned about specialty doctors and prefaced with, “During the past 12 months, have you seen or talked to any of the following health care providers about your own health?”
Blood pressure and blood cholesterol checkups: Based on a positive response to separate survey questions, “During the past 12 months, have you had your [blood pressure] [blood cholesterol] checked by a doctor, nurse, or other health professional?”
Data source and methods
Data from the 2013 NHIS were used for this analysis. NHIS is a multipurpose health survey conducted continuously throughout the year by the Centers for Disease Control and Prevention’s (CDC) National Center for Health Statistics (NCHS). Interviews are conducted in person in respondents’ homes, but follow-ups to complete interviews may be conducted over the telephone. A “sample adult” is randomly selected from each family in each selected household to answer detailed health information about himself or herself. In 2013, 34,525 persons aged 18 and over participated in the Sample Adult component of the survey, of which 3,589 had ever been diagnosed with diabetes and were included in the analysis. For further information about NHIS, including the questionnaire, visit the NHIS website.
All analyses used weights to produce national estimates. Data weighting procedures are described elsewhere (5). Point estimates and their estimated variances were calculated using SUDAAN software (6) and the Taylor series linearization method to account for the complex design of NHIS. Two-sided significance tests at the 0.05 level were used to compare estimates. Logistic regressions were performed to test for significant linear trend between diabetes and age (Figure 1), where age was modeled using linear and quadratic terms.
About the authors
Maria A. Villarroel, Anjel Vahratian, and Brian W. Ward are with CDC’s National Center for Health Statistics, Division of Health Interview Statistics.
References
- Schiller JS, Ward BW, Freeman G, Clarke TC. Early release of selected estimates based on data from the January–June 2014 National Health Interview Survey [PDF- 956 KB]. National Center for Health Statistics. December 2014.
- American Diabetes Association. Standards of medical care in diabetes—2014. Diabetes Care 37 Suppl 1:S14–80. 2014.
- Centers for Disease Control and Prevention. National diabetes statistics report: Estimates of diabetes and its burden in the United States, 2014. Atlanta, GA: U.S. Department of Health and Human Services. 2014.
- Bressler NM, Varma R, Doan QV, Gleeson M, Danese M, Bower JK, et al. Underuse of the health care system by persons with diabetes mellitus and diabetic macular edema in the United States. JAMA Ophthalmol 132(2):168–73. 2014.
- Parsons VL, Moriarity C, Jonas K, et al. Design and estimation for the National Health Interview Survey, 2006–2015. National Center for Health Statistics. Vital Health Stat 2(165). 2014.
- RTI International. SUDAAN (Release 11.0.0) [computer software]. 2012.
Suggested citation
Villarroel MA, Vahratian A, Ward BW. Health care utilization among U.S. adults with diagnosed diabetes, 2013. NCHS data brief, no 183. Hyattsville, MD: National Center for Health Statistics. 2015.
Copyright information
All material appearing in this report is in the public domain and may be reproduced or copied without permission; citation as to source, however, is appreciated.
National Center for Health Statistics
Charles J. Rothwell, M.S., M.B.A., Director
Nathaniel Schenker, Ph.D., Deputy Director
Jennifer H. Madans, Ph.D., Associate Director for Science
Division of Health Interview Statistics
Marcie L. Cynamon, Acting Director