Drug-poisoning Deaths Involving Opioid Analgesics: United States, 1999–2011
- Key findings
- Although the age-adjusted opioid-analgesic poisoning death rate nearly quadrupled from 1999 through 2011, the rate of increase has slowed since 2006.
- Natural and semisynthetic opioid analgesics were involved in about 11,700 drug-poisoning deaths in 2011, up from about 2,700 deaths in 1999.
- Benzodiazepines were involved in 31% of the opioid-analgesic poisoning deaths in 2011, up from 13% of such deaths in 1999.
- From 1999 through 2011, adults aged 55-64 experienced the greatest increase in the opioid-analgesic poisoning death rate.
- From 1999 through 2011, the age-adjusted opioid-analgesic poisoning death rate among non-Hispanic white persons more than quadrupled, while the rate for non-Hispanic black persons more than doubled.
- Summary
- Definitions
- Data sources and methods
- About the authors
- References
- Suggested citation
NCHS Data Brief 166, September 2014
PDF Version (725 KB)
Li Hui Chen, M.S., Ph.D.; Holly Hedegaard, M.D., M.S.P.H.; and Margaret Warner, Ph.D.
Key findings
Data from the National Vital Statistics System, Mortality File
- The age-adjusted rate for opioid-analgesic poisoning deaths nearly quadrupled from 1.4 per 100,000 in 1999 to 5.4 per 100,000 in 2011.
- Although the opioid-analgesic poisoning death rates increased each year from 1999 through 2011, the rate of increase has slowed since 2006.
- Natural and semisynthetic opioid analgesics, such as hydrocodone, morphine, and oxycodone, were involved in 11,693 drug-poisoning deaths in 2011, up from 2,749 deaths in 1999.
- Benzodiazepines were involved in 31% of the opioid-analgesic poisoning deaths in 2011, up from 13% of the opioid-analgesic poisoning deaths in 1999.
- During the past decade, adults aged 55–64 and non-Hispanic white persons experienced the greatest increase in the rates of opioid-analgesic poisoning deaths.
Poisoning is the leading cause of injury death in the United States (1). Drugs—both illicit and pharmaceutical—are the major cause of poisoning deaths, accounting for 90% of poisoning deaths in 2011. Misuse or abuse of prescription drugs, including opioid-analgesic pain relievers, is responsible for much of the recent increase in drug-poisoning deaths (2). This report highlights trends in drug-poisoning deaths involving opioid analgesics (referred to as opioid-analgesic poisoning deaths) and updates previous Data Briefs on this topic (1,3).
Keywords: overdose, prescription pain relievers, National Vital Statistics System Mortality File
Although the age-adjusted opioid-analgesic poisoning death rate nearly quadrupled from 1999 through 2011, the rate of increase has slowed since 2006.
Figure 1. Age-adjusted drug-poisoning and opioid-analgesic poisoning death rates: United States, 1999–2011
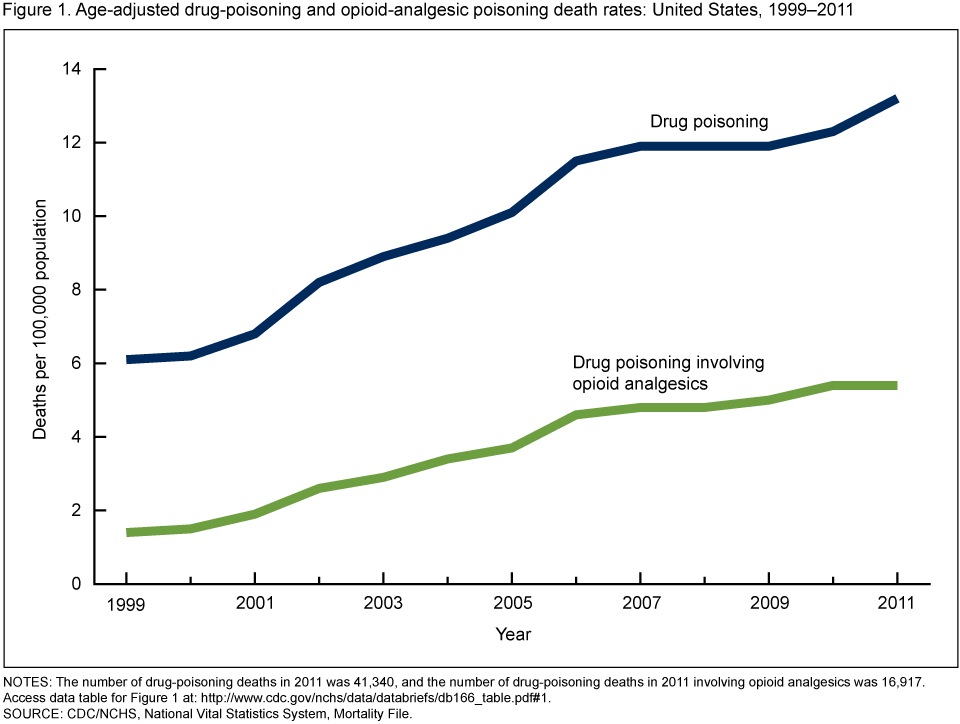
NOTES: The number of drug-poisoning deaths in 2011 was 41,340, and the number of drug-poisoning deaths in 2011 involving opioid analgesics was 16,917. Access data table for Figure 1 [PDF – 136KB].
SOURCE: CDC/NCHS, National Vital Statistics System, Mortality File.
In 2011, there were 41,340 deaths due to drug poisoning; 41% (16,917 deaths) of them involved opioid analgesics. From 1999 through 2011, the rate for opioid-analgesic poisoning deaths almost quadrupled from 1.4 per 100,000 in 1999 to 5.4 per 100,000 in 2011 (Figure 1). The death rate increased at a faster pace from 1999 through 2006 (18% increase each year) than from 2006 through 2011 (3% increase each year). From 1999 through 2011, the age-adjusted death rates for drug poisoning from all types of drugs more than doubled from 6.1 per 100,000 in 1999 to 13.2 per 100,000 in 2011.
Natural and semisynthetic opioid analgesics were involved in about 11,700 drug-poisoning deaths in 2011, up from about 2,700 deaths in 1999.
About 70% of the opioid-analgesic poisoning deaths in 2011 involved natural and semisynthetic opioid analgesics such as hydrocodone, morphine, and oxycodone. The number of drug-poisoning deaths involving natural and semisynthetic opioid analgesics increased each year from 2,749 deaths in 1999 to 11,693 deaths in 2011 (Figure 2). The number of drug-poisoning deaths involving synthetic opioid analgesics other than methadone, such as fentanyl, meperidine, and propoxyphene, increased from 730 deaths in 1999 to 2,666 deaths in 2011.
Figure 2. Number of opioid-analgesic poisoning deaths, by opioid analgesic category: United States, 1999–2011
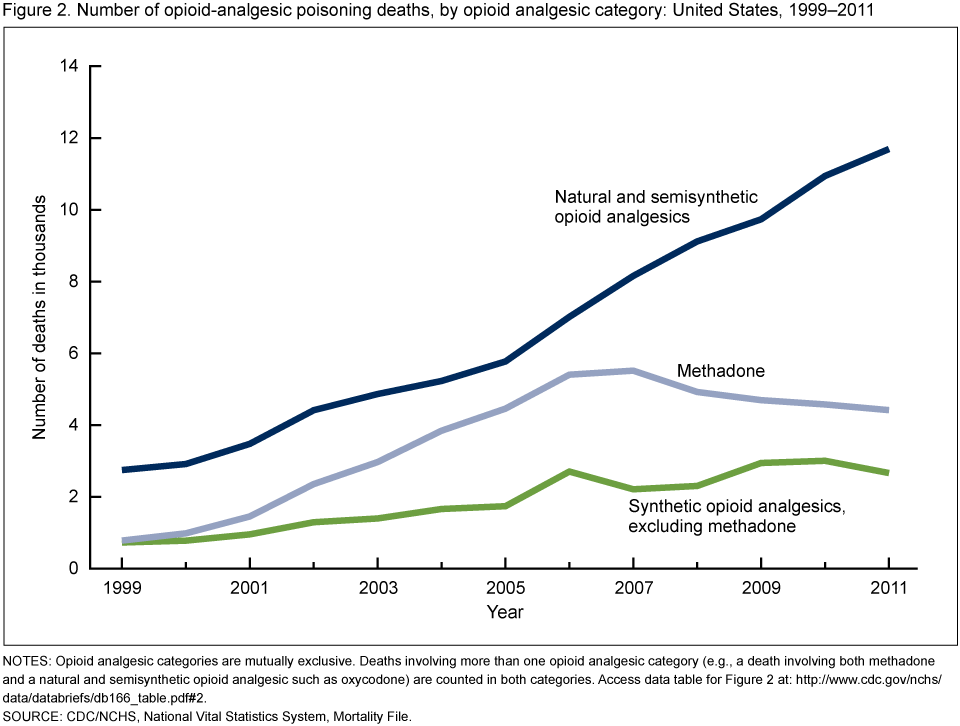
NOTES: Opioid analgesic categories are mutually exclusive. Deaths involving more than one opioid analgesic category (e.g., a death involving both methadone and a natural and semisynthetic opioid analgesic such as oxycodone) are counted in both categories.
Access data table for Figure 2 [PDF – 136KB].
SOURCE: CDC/NCHS, National Vital Statistics System, Mortality File.
The number of drug-poisoning deaths involving methadone, a synthetic opioid analgesic used to treat opioid dependency and pain, increased from 784 deaths in 1999 to 5,518 deaths in 2007; then it declined to 4,418 deaths in 2011. Methadone was involved in 26% of all opioid-analgesic poisoning deaths in 2011, compared with 38% of all opioid-analgesic poisoning deaths in 2007.
Benzodiazepines were involved in 31% of the opioid-analgesic poisoning deaths in 2011, up from 13% of such deaths in 1999.
In 2011, 5,188 opioid-analgesic poisoning deaths also involved benzodiazepines (sedatives used to treat anxiety, insomnia, and seizures), up from 527 such deaths in 1999 (Figure 3). From 2006 through 2011, the number of opioid-analgesic poisoning deaths involving benzodiazepines increased 14% on average each year, while the number of opioid-analgesic poisoning deaths not involving benzodiazepines did not change significantly.
Figure 3. Number of opioid-analgesic poisoning deaths, by involvement of benzodiazepines: United States, 1999–2011

NOTE: Access data table for Figure 3 [PDF – 136KB].
SOURCE: CDC/NCHS, National Vital Statistics System, Mortality File.
From 1999 through 2011, adults aged 55-64 experienced the greatest increase in the opioid-analgesic poisoning death rate.
While the age groups 25–34, 35–44, and 45–54 have higher opioid-analgesic poisoning death rates than other age groups, the greatest increase in rates over the past decade was seen for persons aged 55–64 (Figure 4). The opioid-analgesic poisoning death rate for adults aged 55–64 increased more than six-fold, from 1.0 per 100,000 in 1999 to 6.3 per 100,000 in 2011. Since 2006, the opioid-analgesic poisoning death rate did not change significantly among those aged 15–24. For all other age groups, the rate of increase slowed from 2006 through 2011.
Figure 4. Opioid-analgesic poisoning death rates, by age group: United States, 1999–2011
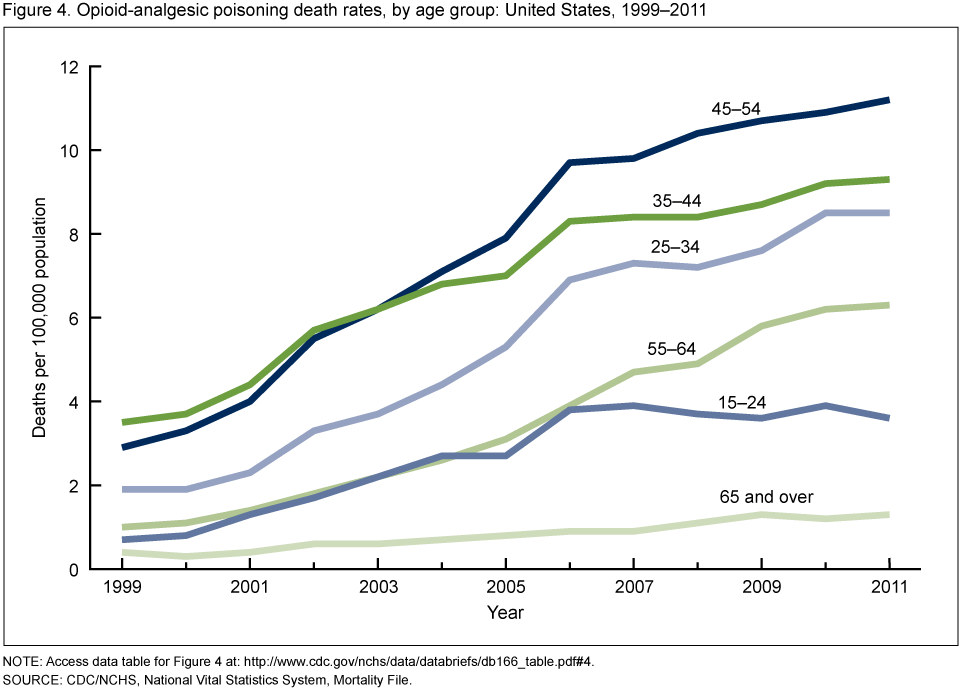
NOTE: Access data table for Figure 4 [PDF – 136KB].
SOURCE: CDC/NCHS, National Vital Statistics System, Mortality File.
From 1999 through 2011, the age-adjusted opioid-analgesic poisoning death rate among non-Hispanic white persons more than quadrupled, while the rate for non-Hispanic black persons more than doubled.
In 2011, 14,637 non-Hispanic white persons, 904 non-Hispanic black persons, and 979 Hispanic persons died from drug poisoning involving opioid analgesics (Figure 5). The age-adjusted rate of opioid-analgesic poisoning deaths for non-Hispanic white persons increased 4.5 times, from 1.6 per 100,000 in 1999 to 7.3 per 100,000 in 2011. The rates more than doubled for non-Hispanic black persons, from 0.9 per 100,000 in 1999 to 2.3 per 100,000 in 2011; they increased slightly for Hispanic persons, from 1.7 per 100,000 in 1999 to 2.0 per 100,000 in 2011. Since 2000, non-Hispanic white persons have had the highest rates among the three race and ethnicity groups. The disparity in rates between non-Hispanic white persons and the other two groups has widened in recent years.
Figure 5. Age-adjusted opioid-analgesic poisoning death rates, by race and ethnicity: United States, 1999–2011
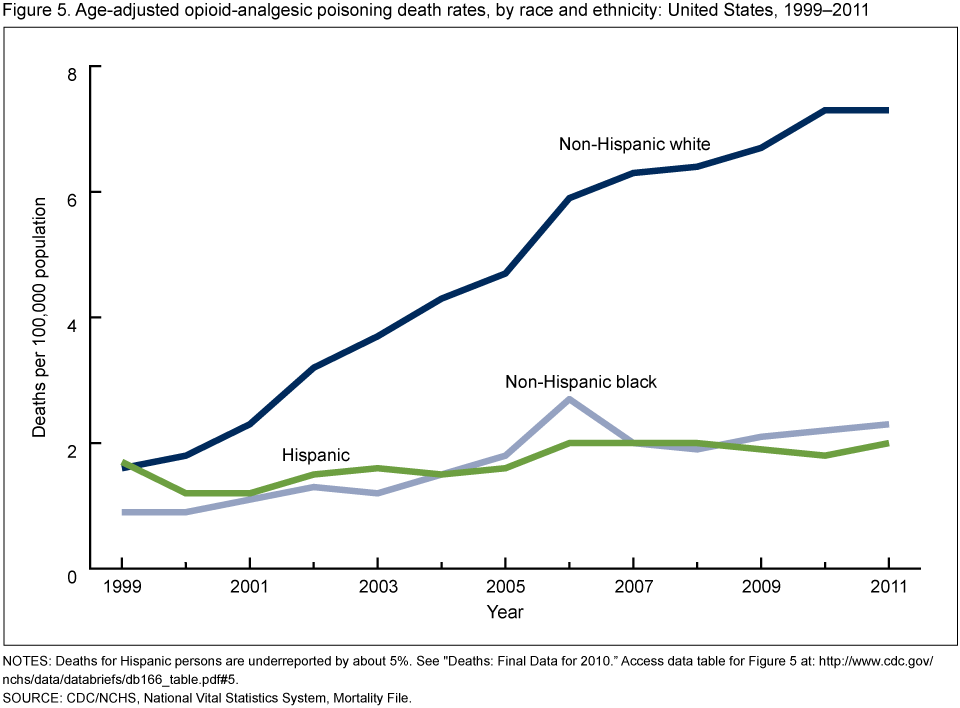
NOTES: Deaths for Hispanic persons are underreported by about 5%. See “Deaths: Final Data for 2010.” Access data table for Figure 5 [PDF – 136KB].
SOURCE: CDC/NCHS, National Vital Statistics System, Mortality File.
Summary
From 1999 through 2011, the age-adjusted rate of drug-poisoning deaths more than doubled, and the rate of opioid-analgesic poisoning deaths almost quadrupled. However, the increase in rates seems to be slowing. For opioid-analgesic poisoning deaths, there was an 18% increase each year from 1999 through 2006 but only a 3% increase each year from 2006 through 2011.
Deaths from opioid analgesics often involve other drugs. Benzodiazepines have been reported frequently in deaths involving opioid analgesics (4). Over the past decade, there has been an upward trend in the presence of benzodiazepines in opioid-analgesic poisoning deaths. In 1999, benzodiazepines were involved in 13% of the opioid-analgesic poisoning deaths; by 2011, 31% of the opioid-analgesic-related drug-poisoning deaths also involved benzodiazepines.
Identifying populations at high risk for opioid-analgesic poisoning death can help inform targeted prevention strategies. Similar to findings in a previous Data Brief (1), the demographic groups with the highest opioid-analgesic poisoning death rates in 2011 were adults aged 45–54 and non-Hispanic white persons. Adults aged 55–64 and non-Hispanic white persons experienced a greater increase in rates compared with other groups.
Many prevention efforts have been initiated since the increasing trend in drug-poisoning deaths was reported in the late 1990s (5,6). This report provides updated statistics on deaths from all drug poisonings and opioid analgesics, and it identifies the populations at highest risk. These results provide useful information to evaluate current prevention efforts and assist the development of future prevention strategies.
Definitions
Drug-poisoning deaths: Includes deaths resulting from unintentional or intentional overdose of a drug, being given the wrong drug, taking a drug in error, or taking a drug inadvertently.
Opioid analgesics: Drugs that are usually prescribed to relieve pain and include: natural and semisynthetic opioid analgesics such as morphine, codeine, hydrocodone, and oxycodone; methadone, which is a synthetic opioid analgesic used to treat opioid dependence and pain; and other synthetic opioid analgesics (excluding methadone) such as fentanyl and meperidine. Opium and heroin are not included in this class of drugs.
Benzodiazepines: A class of drugs that depresses the central nervous system and are prescribed for their sedative-hypnotic, anti-anxiety, muscle relaxant, and anticonvulsant effects.
Data sources and methods
Estimates are based on the National Vital Statistics System multiple cause-of-death mortality files (7). Deaths were classified using the International Classification of Diseases, 10th Revision (ICD–10). Drug-poisoning deaths were defined as having ICD–10 underlying cause-of-death codes X40–X44 (unintentional), X60–X64 (suicide), X85 (homicide), or Y10–Y14 (undetermined intent) (8). Of the drug-poisoning deaths in 2011, 80% were unintentional, 13% were suicides, 7% were of undetermined intent, and less than 1% were homicides. Among deaths with drug poisoning as the underlying cause, the type of drug(s) involved are indicated by the following ICD–10 codes: any opioid analgesic (T40.2, T40.3, or T40.4); natural and semisynthetic opioid analgesic (T40.2); methadone (T40.3); synthetic opioid analgesic, excluding methadone (T40.4); and benzodiazepines (T42.4).
Age-adjusted death rates were calculated using the direct method and the 2000 standard population (9). Data for Hispanic origin should be interpreted with caution; studies comparing Hispanic origin on death certificates and on census surveys have shown inconsistent reporting on Hispanic ethnicity (9). Trends in death rates and number of deaths were evaluated using the Joinpoint Regression Program (10).
Several factors related to death investigation and reporting may affect measurement of death rates involving specific drugs. At autopsy, toxicological lab tests may be performed to determine the type of drugs present. The substances tested for and circumstances under which the tests are performed vary by jurisdiction. Measurement errors related to these factors are more likely to affect substance-specific death rates than the overall drug-poisoning death rate. In 2011, 25% of drug-poisoning deaths did not include information on the specific type of drug involved (i.e., drug-poisoning deaths with only an unspecified drug-related multiple cause-of-death code—T50.9). These deaths could potentially involve opioid analgesics.
About the authors
Li Hui Chen and Holly Hedegaard are with CDC’s National Center for Health Statistics (NCHS), Office of Analysis and Epidemiology, and Margaret Warner is with NCHS Division of Vital Statistics.
References
- Warner M, Chen LH, Makuc DM, Anderson RN, Miniño AM. Drug poisoning deaths in the United States, 1980–2008. NCHS data brief, no 81. Hyattsville, MD: National Center for Health Statistics. 2011.
- Paulozzi LJ. Prescription drug overdoses: A review. J. Safety Res 43(4):283–9. 2012.
- Warner M, Chen LH, Makuc DM. Increase in fatal poisonings involving opioid analgesics in the United States, 1999–2006. NCHS data brief, no 22. Hyattsville, MD: National Center for Health Statistics. 2009.
- Jones CM, Mack KA, Paulozzi LJ. Pharmaceutical overdose deaths, United States, 2010. JAMA 309(7):657–9. 2013.
- Hernandez SH, Nelson LS. Prescription drug abuse: Insight into the epidemic. Clin Pharmacol Ther 88(3):307–17. 2010.
- CDC. Policy impact: Prescription painkiller overdoses. Atlanta, GA.
- NCHS. Mortality multiple cause files. 2011.
- Bergen G, Chen LH, Warner M, Fingerhut LA. Injury in the United States: 2007 chartbook [PDF – 6.56MB]. Hyattsville, MD: National Center for Health Statistics. 2008.
- Murphy SL, Xu JQ, Kochanek KD. Deaths: Final data for 2010 [PDF – 3.03MB]. National vital statistics reports; vol 61 no 4. Hyattsville, MD: National Center for Health Statistics. 2013.
- National Cancer Institute. Joinpoint Regression Program (Version 3.4.3.) [computer software]. 2010.
Suggested citation
Chen LH, Hedegaard H, Warner M. Drug-poisoning deaths involving opioid analgesics: United States, 1999–2011. NCHS data brief, no 166. Hyattsville, MD: National Center for Health Statistics. 2014.
Copyright information
All material appearing in this report is in the public domain and may be reproduced or copied without permission; citation as to source, however, is appreciated.
National Center for Health Statistics
Charles J. Rothwell, M.S., M.B.A., Director
Jennifer H. Madans, Ph.D., Associate Director for Science
Office of Analysis and Epidemiology
Irma E. Arispe, Ph.D., Director
Division of Vital Statistics
Delton Atkinson, M.P.H., M.P.H., P.M.P., Director