Differences in Adult Day Services Center Characteristics by Center Ownership: United States, 2012
- Key findings
- Compared with for-profit adult day services centers, a greater percentage of nonprofit centers had been in operation 10 or more years and were chain-affiliated.
- A greater percentage of for-profit than nonprofit adult day services centers screened participants for cognitive impairment and depression and offered disease-specific programs.
- A greater percentage of for-profit adult day services centers than nonprofit centers provided skilled nursing, therapeutic, mental health, and pharmacy services.
- A greater percentage of for-profit adult day services centers than nonprofit centers provided transportation services to and from the center, for medical or dental appointments, and for social and recreational activities or shopping.
- Summary
- Definitions
- Data source and methods
- About the authors
- References
- Suggested citation
NCHS Data Brief No. 165, September 2014
PDF Version (490 KB)
Lisa L. Dwyer, M.P.H.; Lauren D. Harris-Kojetin, Ph.D.; and Roberto H. Valverde, M.P.H.
Key findings
Data from the National Study of Long-Term Care Providers
- In 2012, 40% of the 4,800 adult day services centers were for-profit entities, serving nearly one-half of the 272,300 center participants.
- About 60% of adult day services centers used a standardized tool to screen for cognitive impairment, and about 20% used a standardized tool for depression screening. A greater percentage of for-profit than nonprofit centers used these tools.
- More than one-half of adult day services centers provided skilled nursing, therapeutic, and social work services, while less than one-half of centers provided mental health, pharmacy, and dental services. With the exception of social work services, a greater percentage of for-profit than nonprofit centers provided these services.
- Almost all adult day services centers provided daily transportation to and from the center.
The most recent data estimate that 4,800 adult day services centers nationwide serve nearly a quarter million participants daily (1). Unlike other long-term care providers, such as nursing homes, home health agencies, hospices, and residential care communities, the majority of adult day services centers are nonprofit (1). However, for-profit ownership of adult day services centers appears to be increasing, from 27% in 2010 to 40% in 2012 (2). Using data from the National Study of Long-Term Care Providers, this report presents national estimates for characteristics of adult day services centers in 2012 and compares them by type of center ownership. State-level estimates for characteristics presented in this data brief are available from: https://www.cdc.gov/nchs/nsltcp/nsltcp_products.htm.
Keywords: National Study of Long-Term Care Providers, health-related services, transportation services
Compared with for-profit adult day services centers, a greater percentage of nonprofit centers had been in operation 10 or more years and were chain-affiliated.
Figure 1. Selected characteristics of adult day services centers, by center ownership: United States, 2012
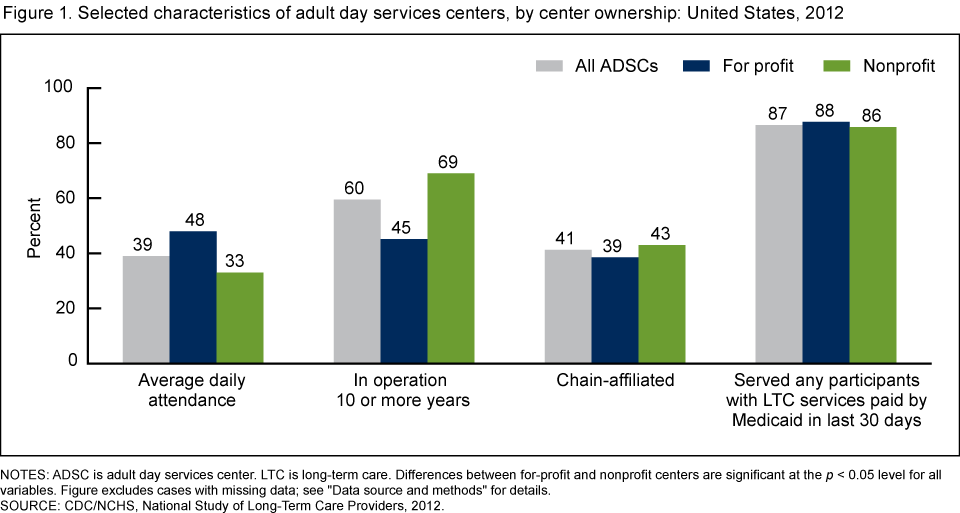
NOTES: ADSC is adult day services center. LTC is long-term care. Differences between for-profit and nonprofit centers are significant at the p < 0.05 level for all variables. Figure excludes cases with missing data; see “Data source and methods” for details.
SOURCE: CDC/NCHS, National Study of Long-Term Care Providers, 2012.
- The average daily attendance at nonprofit adult day services centers was 33 participants, fewer than that at for-profit centers, with 48 participants (Figure 1).
- A higher percentage of nonprofit (69%) than for-profit (45%) adult day services centers had been in operation 10 or more years.
- A higher percentage of nonprofit (43%) than for-profit (39%) adult day services centers were affiliated with a chain organization.
- A slightly higher percentage of for-profit (88%) than nonprofit (86%) adult day services centers had at least one participant who had some or all of their long-term care services in the past 30 days paid by Medicaid.
A greater percentage of for-profit than nonprofit adult day services centers screened participants for cognitive impairment and depression and offered disease-specific programs.
- Sixty-three percent of for-profit adult day services centers used a standardized tool to conduct a formal assessment of participants before or upon admission to identify those with cognitive impairments. Fifty-seven percent of nonprofit centers conducted this formal assessment for cognitive impairment (Figure 2).
- A slightly higher percentage of for-profit (74%) than nonprofit (72%) adult day services centers offered disease-specific programs for participants with Alzheimer’s disease and other dementias.
- A slightly higher percentage of for-profit (22%) than nonprofit (19%) adult day services centers screened participants for depression with a standardized tool as part of the admission process.
Figure 2. Screening and disease-specific programs for Alzheimer’s disease and other dementias and for depression among adult day services centers, by center ownership: United States, 2012
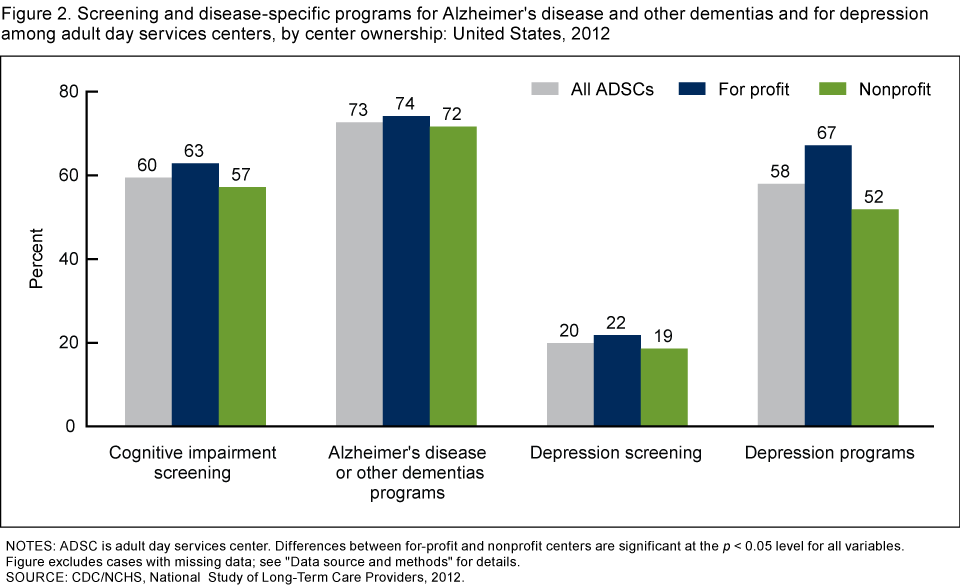
NOTES: ADSC is adult day services center. Differences between for-profit and nonprofit centers are significant at the p < 0.05 level for all variables. Figure excludes cases with missing data; see “Data source and methods” for details.
SOURCE: CDC/NCHS, National Study of Long-Term Care Providers, 2012.
- Two-thirds (67%) of for-profit adult day services centers offered disease-specific programs for participants with depression, compared with 52% of nonprofit adult day services centers.
A greater percentage of for-profit adult day services centers than nonprofit centers provided skilled nursing, therapeutic, mental health, and pharmacy services.
- Eighty percent of for-profit adult day services centers offered skilled nursing services, compared with 64% of nonprofit centers (Figure 3).
- Sixty-eight percent of for-profit adult day services centers offered therapeutic services, compared with 61% of nonprofit centers.
- More than one-half (51%) of for-profit adult day services centers provided mental health services, compared with 45% of nonprofit centers.
- Forty-four percent of for-profit adult day services centers provided pharmacy services, compared with 29% of nonprofit centers.
- Less than one-fifth of for-profit (18%) and nonprofit (16%) adult day services centers provided dental services.
- Similar percentages of nonprofit (64%) and for-profit (63%) adult day services centers provided social work services.
Figure 3. Provision of selected health-related services among adult day services centers, by center ownership: United States, 2012
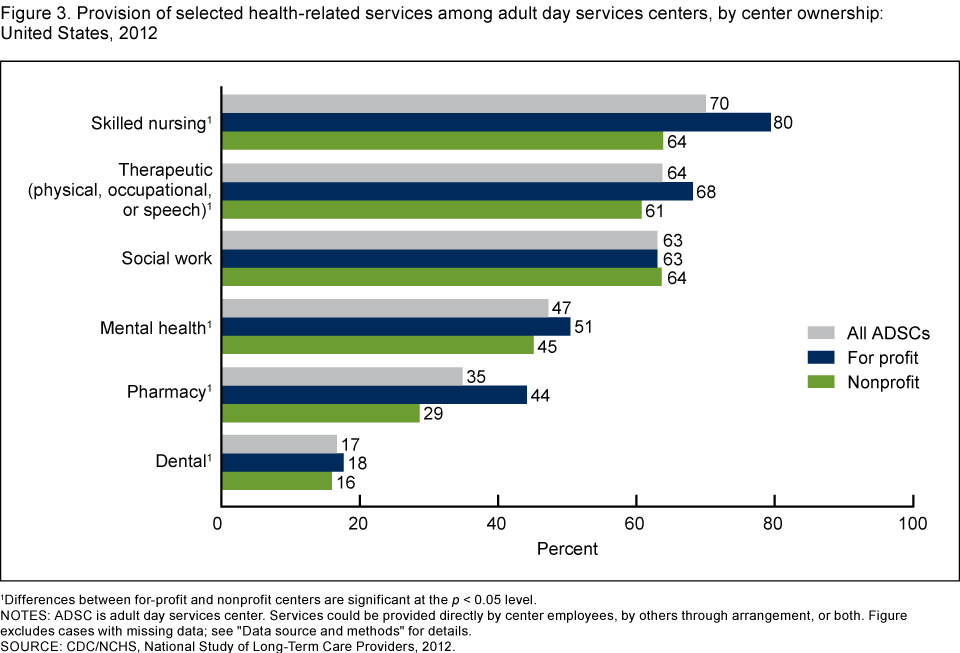
1Differences between for-profit and nonprofit centers are significant at the p < 0.05 level.
NOTES: ADSC is adult day services center. Services could be provided directly by center employees, by others through arrangement, or both. Figure excludes cases with missing data; see “Data source and methods” for details.
SOURCE: CDC/NCHS, National Study of Long-Term Care Providers, 2012.
A greater percentage of for-profit adult day services centers than nonprofit centers provided transportation services to and from the center, for medical or dental appointments, and for social and recreational activities or shopping.
- Ninety-two percent of for-profit adult day services centers provided daily roundtrip transportation service to and from the center, compared with 84% of nonprofit centers (Figure 4).
- Sixty-five percent of for-profit centers provided transportation services for medical or dental appointments, while 48% of nonprofit centers provided this service.
- Eighty-one percent of for-profit adult day services centers provided transportation for social and recreational activities or shopping, compared with 75% of nonprofit centers.
Figure 4. Provision of transportation services by adult day services centers, by center ownership: United States, 2012
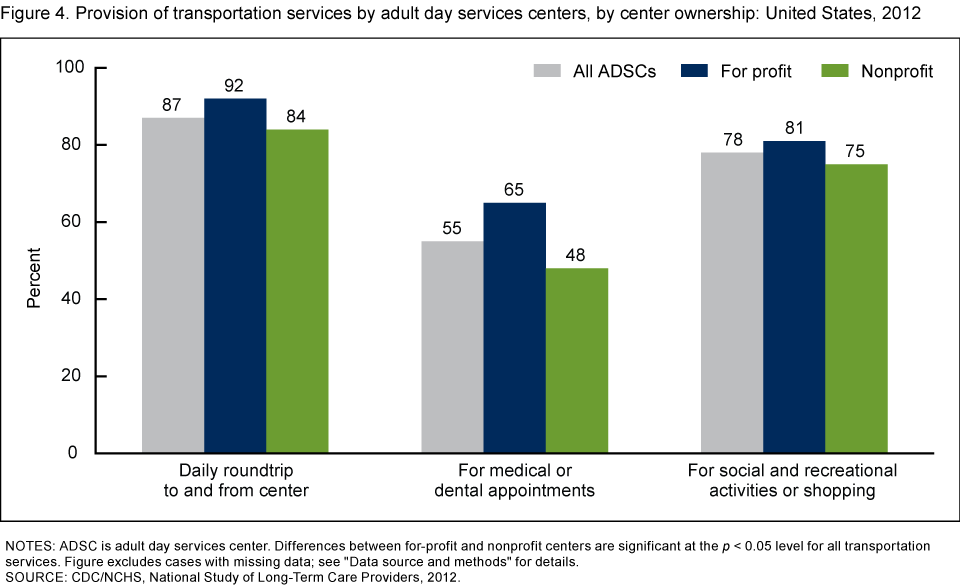
NOTES: ADSC is adult day services center. Differences between for-profit and nonprofit centers are significant at the p < 0.05 level for all transportation services. Figure excludes cases with missing data; see “Data source and methods” for details.
SOURCE: CDC/NCHS, National Study of Long-Term Care Providers, 2012.
Summary
Adult day services centers enable participants with physical and cognitive limitations to live in the community by providing daytime services and supports in a congregate setting, while also providing respite for their caregivers (3). These centers often act as an alternative or supplement to home care and an alternative to living in an assisted living community or a nursing home. In 2012, an estimated 4,800 adult day services centers were operating in the United States, with an average daily attendance of 39 participants. In 2010, there were an estimated 4,600 adult day services centers with an average daily attendance of 34 (2). The increase in the number of centers and in the size of a typical center is likely to continue in the coming years.
On average, for-profit centers were larger than nonprofit centers, with an average daily census of 48 compared with 33 participants. In addition, for-profit and nonprofit adult day services centers in 2012 differed on other selected organizational characteristics. More for-profit centers (65%) than nonprofit centers (48%) offered transportation to medical or dental appointments. A higher percentage of for-profit centers (67%) than nonprofit centers (52%) offered disease-specific programs for participants with depression, a difference that may be driven by participant need: In 2012, more participants in for-profit centers (29%) had depression compared with participants in nonprofit centers (19%) (4). A higher percentage of for-profit centers than nonprofit centers offered skilled nursing, therapeutic, mental health, and pharmacy services, indicating that participants enrolled in for-profit centers tended to have greater access to these services than those enrolled in nonprofit centers. Whether these differences are related to differences in service needs between participants in for-profit compared with nonprofit centers or to other factors remains to be determined.
These findings provide a current national picture of adult day services centers in the United States. Findings on differences by center ownership provide useful information to policy makers, providers, researchers, and consumer advocates as they plan to meet the needs of seniors and persons with disabilities. Corresponding state estimates and their standard errors for the national figures in this data brief are available from: https://www.cdc.gov/nchs/nsltcp/nsltcp_products.htm. These national and state estimates establish a baseline for monitoring trends in the adult day services industry.
Definitions
Adult day services center: A community-based center that provides an array of long-term care services, including structured activities, health monitoring, socialization, and assistance with activities of daily living, to seniors or younger adults with disabilities. These centers are generally open 5 days a week for a minimum of 6 hours a day.
Chain affiliation: Having more than one adult day services center under common ownership or management. This may include centers in the same state or across multiple states. If centers were owned by a chain, group, or multicenter system, they were considered chain-affiliated.
Cognitive impairment screening: Refers to center practice based on self-report by the respondent to the following question, “Before or upon admission, does this center use a standardized tool to conduct a formal assessment of its participants to identify anyone with a cognitive impairment?”
Dental services: Includes routine and emergency dental services provided by a licensed dentist.
Depression screening: Refers to center practice based on self-report by the respondent to the following question, “As a part of the admission process, does this center screen participants for depression with a standardized tool such as the Geriatric Depression Scale, Beck Depression Inventory, or the Center for Epidemiological Studies Depression Scale?”
Disease-specific programs: Programs that target participants with a specific diagnosis and may include one or more of the following services: educational programs, physical activity programs, diet or nutrition programs, medication management programs, or weight management programs.
Mental health services: Services that target participants’ mental, emotional, psychological, or psychiatric wellbeing and include diagnosing, describing, evaluating, and treating mental conditions.
Ownership type: Categorization of adult day services centers into two ownership types: for profit and nonprofit. For profit includes publicly traded centers and limited liability centers. Nonprofit includes private nonprofit centers and federal, state, county, or local government-owned centers.
Participants with some or all long-term care services paid by Medicaid: Refers to adult day services center participants who had some or all of their long-term care services paid by Medicaid during the 30 days prior to the survey.
Pharmacy services: Includes filling and delivery of prescriptions.
Skilled nursing services: Services that must be performed by a registered nurse or a licensed practical nurse and are medical in nature.
Social work services: Services provided by a licensed social worker or person with a bachelor’s or master’s degree in social work, and that include an array of services such as psychological assessment, individual or group counseling, and referral services.
Therapeutic services: Physical, occupational, or speech services.
Data source and methods
Data from the adult day services component of the 2012 National Study of Long-Term Care Providers (NSLTCP) conducted by the Centers for Disease Control and Prevention’s (CDC) National Center for Health Statistics (NCHS) were used for these analyses. All adult day services centers that participated in NSLTCP (a) self-identified as adult day care, adult day services, or adult day health services centers; (b) were included in the National Adult Day Services Association’s database; and (c) were in operation on or before May 31, 2012.
NSLTCP used a multimode survey protocol with mail, Web, and telephone follow-up for nonresponse. The final frame consisted of 5,254 adult day services centers, which were all included in the data collection efforts. A total of 476 (9.1%) adult day services centers were identified as invalid or out of business. All remaining centers (n = 4,778) were assumed eligible. The survey questionnaire was completed for 3,212 centers, for a weighted response rate of 67.2%.
Of the 3,212 adult day services centers that responded to the survey, there were 12 for which ownership was unknown; however, the weighted frequency for these 12 centers does not affect the rounded total of 4,800 adult day services centers nationally.
Differences among subgroups were evaluated using chi-square tests. All significance tests were two-sided, using p less than 0.05 as the level of significance. Lack of comment regarding the difference between any two statistics does not necessarily suggest that the difference was tested and found to be not statistically significant. Data analyses were performed using SAS-callable SUDAAN. Cases with missing data were excluded from the analyses on a variable-by-variable basis. Because estimates were rounded, individual estimates may not sum to totals.
About the authors
Lisa L. Dwyer, Lauren D. Harris-Kojetin, and Roberto H. Valverde are with CDC’s National Center for Health Statistics, Division of Health Care Statistics.
References
- Harris-Kojetin L, Sengupta M, Park-Lee E, Valverde R. Long-term care services in the United States: 2013 overview. Hyattsville, MD: National Center for Health Statistics. 2013.
- Anderson KA, Dabelko-Schoeny H, Johnson TD. The state of adult day services: Findings and implications from the MetLife National Study of Adult Day Services. J Appl Gerontol 32(6):729–48. 2013.
- National Adult Day Services Association (NADSA). Comparing long term care services. Fuquay Varina, NC: NADSA.
- Dwyer LL, Harris-Kojetin LD, Valverde RH. Differences in adult day services center participant characteristics by center ownership: United States, 2012. NCHS data brief, no 164. Hyattsville, MD: National Center for Health Statistics. 2014.
Suggested citation
Dwyer LL, Harris-Kojetin LD, Valverde RH. Differences in adult day services center characteristics by center ownership: United States, 2012. NCHS data brief, no 165. Hyattsville, MD: National Center for Health Statistics. 2014.
Copyright information
All material appearing in this report is in the public domain and may be reproduced or copied without permission; citation as to source, however, is appreciated.
National Center for Health Statistics
Charles J. Rothwell, M.S., M.B.A., Director
Jennifer H. Madans, Ph.D., Associate Director for Science
Division of Health Care Statistics
Clarice Brown, M.S., Director