Age Differences in Visits to Office-based Physicians by Patients With Diabetes: United States, 2010
- Key findings
- Did the number of office-based physician visits by patients with diabetes increase between 2005 and 2010?
- Did the visit rate for patients with diabetes vary by age and across time?
- Did a majority of patients with diabetes who visited office-based physicians in 2010 have other chronic conditions, and did the number of chronic conditions vary by age?
- Did patients with diabetes who went to the doctor visit frequently, and did visit frequency vary by age?
- Were medications prescribed or continued at office-based physician visits by patients with diabetes, and did this vary by age?
- Summary
- Definitions
- Data sources and methods
- About the authors
- References
- Suggested citation
NCHS Data Brief No. 161, July 2014
PDF Version (611 KB)
Jill J. Ashman, Ph.D.; Anjali Talwalkar, M.D., M.P.H.; and Shelby A. Taylor, M.P.H.
Key findings
Data from the National Ambulatory Medical Care Survey
- Office-based physician visits by patients with diabetes increased 20%, from 94.4 million in 2005 to 113.3 million in 2010, but the rate did not change between 2005 and 2010.
- The visit rate for diabetes increased with age and averaged 1,380 visits per 1,000 persons aged 65 and over in 2010.
- A majority of visits made by patients with diabetes (87%) were by those with multiple chronic conditions, and the number of chronic conditions increased with advancing age.
- Medications were prescribed or continued at a majority of visits (85%) made by patients with diabetes, with the number of medications prescribed or continued increasing as age increased.
Diabetes is a chronic condition which affects nearly 29 million Americans and is a major cause of other chronic conditions, including heart disease, eye disease, and stroke (1). Diabetes was the seventh leading U.S. cause of death in 2009 and 2010 (2,3). Management of diabetes costs nearly $245 billion annually, and patients with diabetes have medical expenditures approximately 2.3 times higher than those for patients without diabetes (4). This data brief shows the trend from 2005 through 2010 for visits to office-based physicians by patients with diabetes, and describes age differences in the utilization of health care by patients with diabetes in 2010.
Keywords: health care utilization, office-based physician care, NAMCS
Did the number of office-based physician visits by patients with diabetes increase between 2005 and 2010?
- Overall office-based physician visits by patients with diabetes increased 20% from 94.4 million in 2005 to 113.3 million in 2010 (Figure 1).
- Visits by patients with diabetes represented about 11% of all office-based physician visits in 2010.
- From 2005 to 2010, the number of visits by patients with diabetes increased across all age categories except for those younger than 25, with the largest percentage increase (34%) occurring in the 25–44 age range.
- The volume of visits was much higher for older age groups, with those aged 65 and over having 53.7 million visits in 2010 compared with those under age 25, who had 2.6 million visits.
Figure 1. Number of office-based physician visits by patients with diabetes, by age: United States, 2005–2010
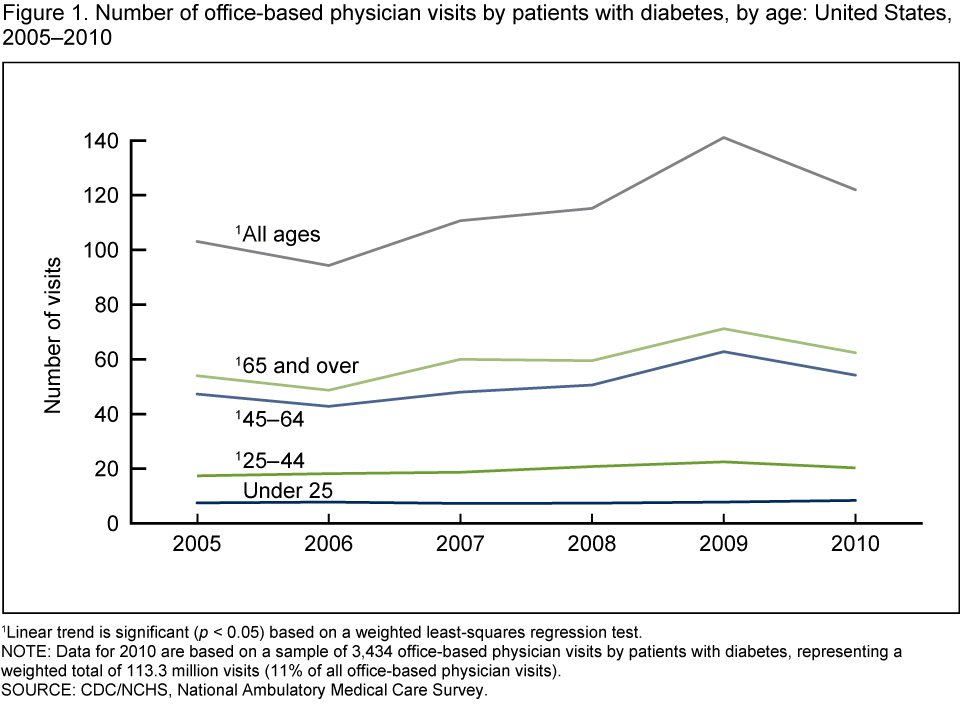
1Linear trend is significant (p < 0.05) based on a weighted least-squares regression test.
NOTE: Data for 2010 are based on a sample of 3,434 office-based physician visits by patients with diabetes, representing a weighted total of 113.3 million visits (11% of all office-based physician visits).
SOURCE: CDC/NCHS, National Ambulatory Medical Care Survey.
Did the visit rate for patients with diabetes vary by age and across time?
- The rate of physician office visits by patients with diabetes was not statistically different from 2005 to 2010 for all age groups (Figure 2).
- In both 2005 and 2010, the rate of office-based physician visits by patients with diabetes increased with advancing age.
- The highest visit rate in 2010 among patients with diabetes was for those aged 65 and over (1,380 visits per 1,000 persons), and the lowest visit rate was for those under age 25 (20 visits per 1,000 persons).
Figure 2. Rate of visits to office-based physicians for patients with diabetes, by age: United States, 2005 and 2010
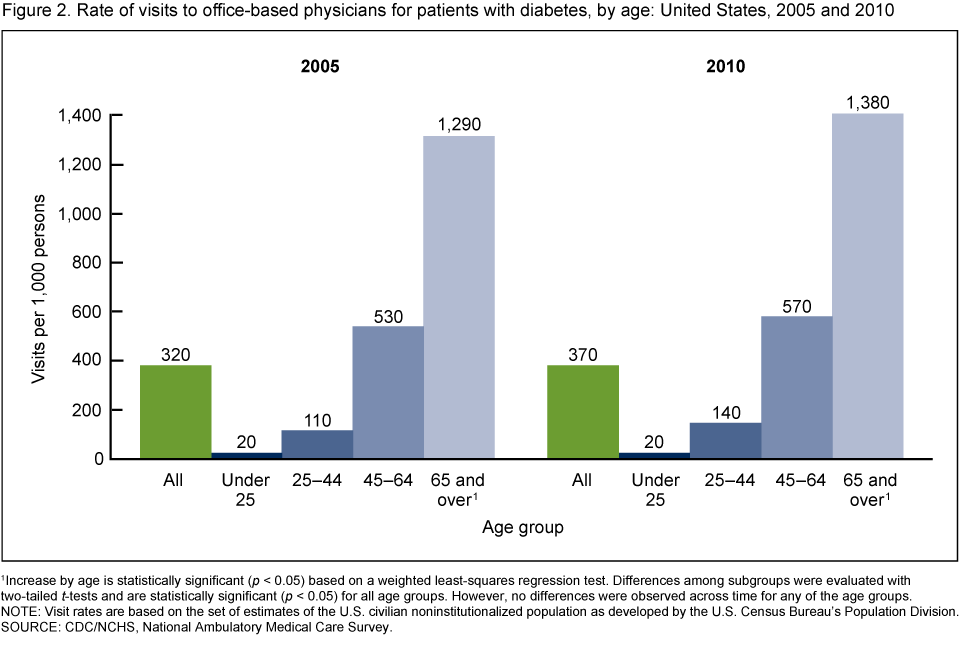
1Increase by age is statistically significant (p < 0.05) based on a weighted least-squares regression test. Differences among subgroups were evaluated with two-tailed t-tests and are statistically significant (p < 0.05) for all age groups. However, no differences were observed across time for any of the age groups.
NOTE: Visit rates are based on the set of estimates of the U.S. civilian noninstitutionalized population as developed by the U.S. Census Bureau’s Population Division.
SOURCE: CDC/NCHS, National Ambulatory Medical Care Survey.
Did a majority of patients with diabetes who visited office-based physicians in 2010 have other chronic conditions, and did the number of chronic conditions vary by age?
- Overall, a majority of office-based physician visits made by patients with diabetes (87%) were made by those with multiple chronic conditions (Figure 3), with the number of chronic conditions increasing as age increased. Eighteen percent of the visits made by patients aged 25–44 with diabetes were by those with four or more chronic conditions, and percentages were higher for the two older age groups, 45–64 (36% of visits) and 65 and over (35%).
- Diabetes was the only chronic condition for 49% of the visits made by patients under age 25, but the only chronic condition for 10% of the visits made by patients aged 65 and over.
Figure 3. Percent distribution of number of diagnosed chronic conditions at office-based physician visits for patients with diabetes, by age: United States, 2010
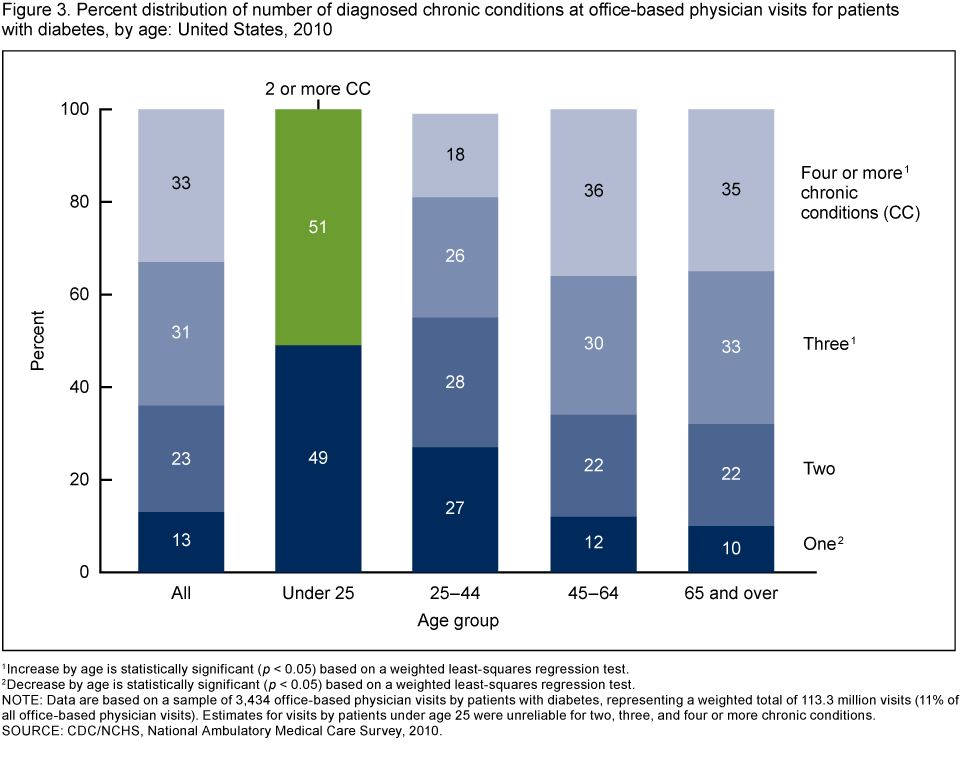
1Increase by age is statistically significant (p < 0.05) based on a weighted least-squares regression test.
2Decrease by age is statistically significant (p < 0.05) based on a weighted least-squares regression test.
NOTE: Data are based on a sample of 3,434 office-based physician visits by patients with diabetes, representing a weighted total of 113.3 million visits (11% of all office-based physician visits). Estimates for visits by patients under age 25 were unreliable for two, three, and four or more chronic conditions.
SOURCE: CDC/NCHS, National Ambulatory Medical Care Survey, 2010.
Did patients with diabetes who went to the doctor visit frequently, and did visit frequency vary by age?
- More than 80% of visits by patients with diabetes (83%) were by those making multiple trips to the sampled doctor in the past 12 months (Figure 4).
- Regardless of age, more than one-half of the visits by patients with diabetes (55%) were by those who made an office visit to the sampled doctor four or more times in the past 12 months.
Figure 4. Percent distribution of number of office-based physician visits in past 12 months for patients with diabetes, by age: United States, 2010
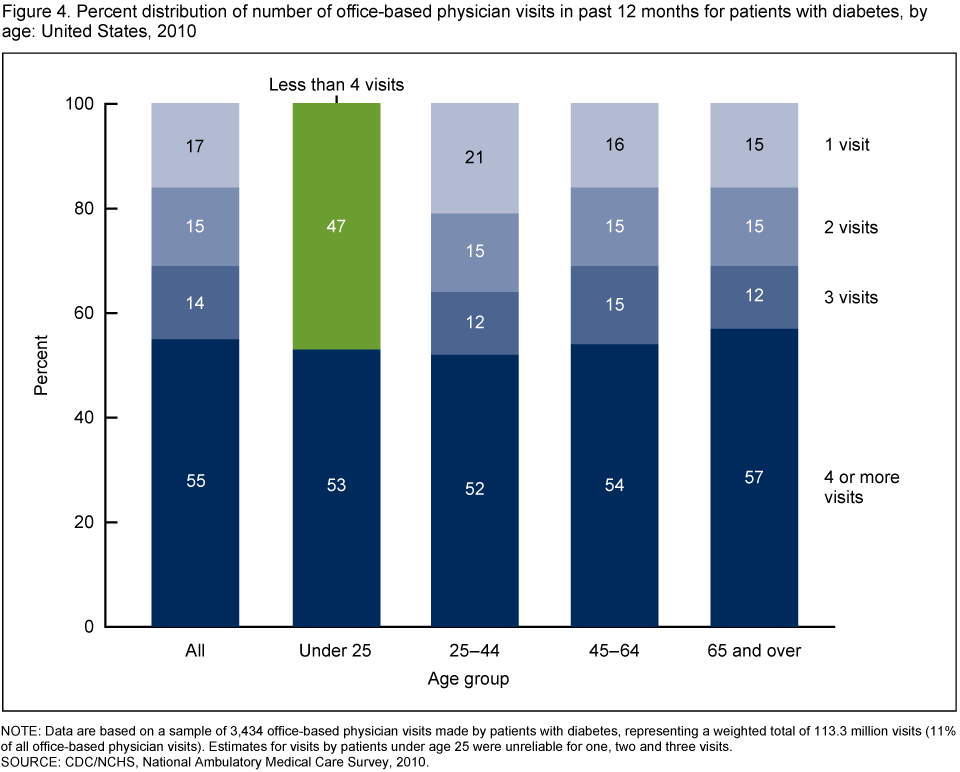
NOTE: Data are based on a sample of 3,434 office-based physician visits made by patients with diabetes, representing a weighted total of 113.3 million visits (11% of all office-based physician visits). Estimates for visits by patients under age 25 were unreliable for one, two and three visits.
SOURCE: CDC/NCHS, National Ambulatory Medical Care Survey, 2010.
Were medications prescribed or continued at office-based physician visits by patients with diabetes, and did this vary by age?
- Medications were prescribed or continued at a majority of office-based physician visits (85%) by patients with diabetes (Figure 5). The number of medications prescribed or continued increased as age increased.
- Five or more drugs were prescribed or continued at 38% of the visits by patients with diabetes aged 25–44, and at 60% of the visits by those aged 65 and over.
Figure 5. Percent distribution of the number of medications prescribed or continued at office-based physician visits for patients with diabetes, by age: United States, 2010
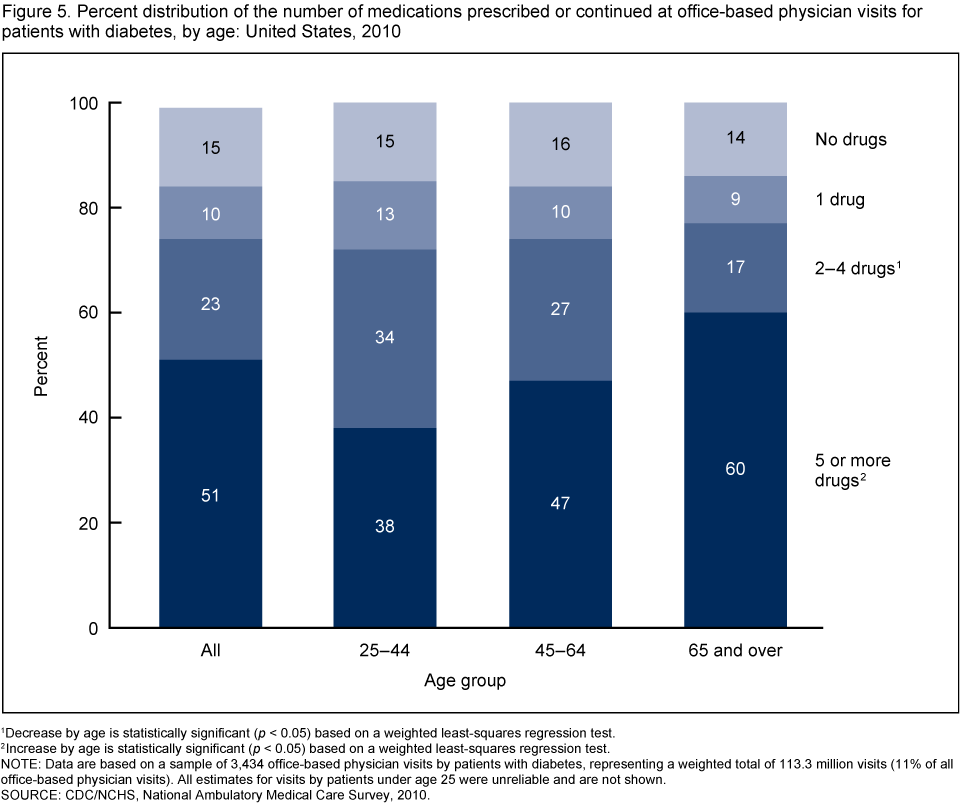
1Decrease by age is statistically significant (p < 0.05) based on a weighted least-squares regression test.
2Increase by age is statistically significant (p < 0.05) based on a weighted least-squares regression test.
NOTE: Data are based on a sample of 3,434 office-based physician visits by patients with diabetes, representing a weighted total of 113.3 million visits (11% of all office-based physician visits). All estimates for visits by patients under age 25 were unreliable and are not shown.
SOURCE: CDC/NCHS, National Ambulatory Medical Care Survey, 2010.
Summary
Diabetes affects nearly 29 million people in the United States (1). Overall, visits by patients with diabetes increased 20% from 2005 to 2010, but the visit rate did not increase. Diabetes is not the only health concern for the majority of patients who have it, with 87% of visits being made by patients who have additional chronic conditions. Moreover, visits by older patients were more likely to be made by those with multiple chronic conditions compared with visits by younger patients. Regardless of age, patients with diabetes use extensive health resources, as evidenced by frequent visits to the doctor (55% having visited the doctor four or more times in the past year) and extensive use of medications, with almost all visits by patients with diabetes (85%) including medications being prescribed or continued. Visits by older patients were more likely to include five or more drugs being prescribed or continued than visits by younger patients. One of the federal Healthy People 2020 goals is to reduce the disease and economic burden of diabetes (5). Continuing to examine office-based physician visits by patients with diabetes is especially important given changes in standards of care that may influence such visits.
Definitions
Diagnosed diabetes: Since 2005, a National Ambulatory Medical Care Survey (NAMCS) question has asked, “Regardless of the diagnosis for the current visit, does the patient now have diabetes?” Diabetes is considered diagnosed if it was documented as a current condition in the patient’s medical record, regardless of the diagnoses at or specific reasons for the visit. This report includes all visits made by patients diagnosed with diabetes. Managing diabetes is the reason for some of these visits, but many other reasons such as a respiratory infection or an injury are also included.
Other diagnosed chronic conditions: Since 2005, a NAMCS question has asked, “Regardless of the diagnosis for the current visit, does the patient now have [insert chronic condition]?” Information is collected on 13 other chronic conditions besides diabetes, including arthritis, asthma, cancer, chronic kidney disease, chronic obstructive pulmonary disease, congestive heart failure, coronary artery disease, depression, hyperlipidemia, hypertension, obesity, osteoporosis, and stroke. Each of the chronic conditions listed (including diabetes) is considered diagnosed if it was documented as a current condition in the patient’s medical record, regardless of the specific reason for the visit.
Data sources and methods
All estimates are from the 2005–2010 NAMCS, a nationally representative survey of visits to nonfederal office-based physicians (excluding anesthesiologists, radiologists, and pathologists), conducted annually by the Centers for Disease Control and Prevention’s (CDC) National Center for Health Statistics (NCHS), Division of Health Care Statistics.
NAMCS uses a multistage probability design that involves probability samples of primary sampling units (PSUs), physicians within PSUs, and patient visits within practices. Because of the complex multistage design of NAMCS, the survey data must be inflated or weighted to produce national estimates. More details about the design of NAMCS have been published elsewhere (6).
Differences among subgroups were evaluated with two-tailed t tests, using p < 0.05 as the level of significance. A weighted least-squares regression method was used to test the significance of trends for all figures. All reported comparisons were statistically significant unless otherwise indicated. Data analyses were performed using the statistical packages SAS version 9.2 (SAS Institute, Cary, N.C.) and SUDAAN version 9.0 (RTI International, Research Triangle Park, N.C.).
About the authors
Jill J. Ashman, Anjali Talwalkar, and Shelby A. Taylor are with CDC/NCHS, Division of Health Care Statistics.
References
- CDC. National diabetes statistics report: Estimates of diabetes and its burden in the United States, 2014. Atlanta, GA: U.S. Department of Health and Human Services. 2014.
- Xu J. QuickStats: Number of deaths from 10 leading causes—National Vital Statistics System, United States, 2010. MMWR 62(8):155. 2013.
- Kochanek KD, Xu J, Murphy SL, et al. Deaths: Final data for 2009. National vital statistics reports; vol 60 no 3. Hyattsville, MD: National Center for Health Statistics. 2011.
- American Diabetes Association. Economic costs of diabetes in the U.S. in 2012. Diabetes Care 36(4):1033–46. 2013.
- Office of Disease Prevention and Health Promotion, U.S. Department of Health and Human Services. Healthy People 2020: Diabetes [Accessed May 13, 2014].
- National Center for Health Statistics. 2010 NAMCS micro-data file documentation [PDF – 1.62MB]. Hyattsville, MD. 2010.
Suggested citation
Ashman JJ, Talwalkar A, Taylor SA. Age differences in visits to office-based physicians by patients with diabetes: United States, 2010. NCHS data brief, no 161. Hyattsville, MD: National Center for Health Statistics. 2014.
Copyright information
All material appearing in this report is in the public domain and may be reproduced or copied without permission; citation as to source, however, is appreciated.
National Center for Health Statistics
Charles J. Rothwell, M.S., M.B.A., Director
Jennifer H. Madans, Ph.D., Associate Director for Science
Division of Health Care Statistics
Clarice Brown, M.S., Director