State Variability in Supply of Office-based Primary Care Providers: United States, 2012
- Key findings
- During the last decade, the supply of primary care physicians was lower than the supply of specialty physicians.
- The supply of primary care physicians varied by state in 2012.
- The percentage of primary care physicians with physician assistants or nurse practitioners in their practices varied by state.
- The availability of primary care physicians and the percentage of primary care physicians working with physician assistants or nurse practitioners varied by the urbanicity of the physician's office location.
- Primary care physicians in multispecialty group practices were more likely than those in solo or partner practices to work with physician assistants or nurse practitioners.
- Summary
- Definitions
- Data sources and methods
- About the authors
- References
- Suggested citation
NCHS Data Brief No. 151, May 2014
PDF Version (733 KB)
Esther Hing, M.P.H., and Chun-Ju Hsiao, Ph.D.
Key findings
Data from the National Ambulatory Medical Care Survey (NAMCS) and the NAMCS Electronic Health Records Survey
- In 2012, 46.1 primary care physicians and 65.5 specialists were available per 100,000 population.
- From 2002 through 2012, the supply of specialists consistently exceeded the supply of primary care physicians.
- Compared with the national average, the supply of primary care physicians was higher in Massachusetts, Rhode Island, Vermont, and Washington; it was lower in Arkansas, Georgia, Mississippi, Nevada, New Mexico, and Texas.
- In 2012, 53.0% of office-based primary care physicians worked with physician assistants or nurse practitioners.
- Compared with the national average, the percentage of physicians working with physician assistants or nurse practitioners was higher in 19 states and lower in Georgia.
Primary care providers include primary care physicians, physician assistants, and nurse practitioners. Primary care physicians are those in family and general practice, internal medicine, geriatrics, and pediatrics (1). Physician assistants are state-licensed health professionals practicing medicine under a physician’s supervision. Nurse practitioners are registered nurses (RNs) with advanced clinical training (2–6). The ability to obtain primary care depends on the availability of primary care providers (3). This report presents state estimates of the supply of primary care physicians per capita, as well as the availability of physician assistants or nurse practitioners in primary care physicians’ practices. Estimates are based on data from the National Ambulatory Medical Care Survey (NAMCS), Electronic Health Records (EHR) Survey, a nationally representative survey of office-based physicians.
Keywords: primary care physicians, physician assistants, nurse practitioners
During the last decade, the supply of primary care physicians was lower than the supply of specialty physicians.
Figure 1. Number of primary care and specialty physicians per 100,000 population: United States, 2002–2012
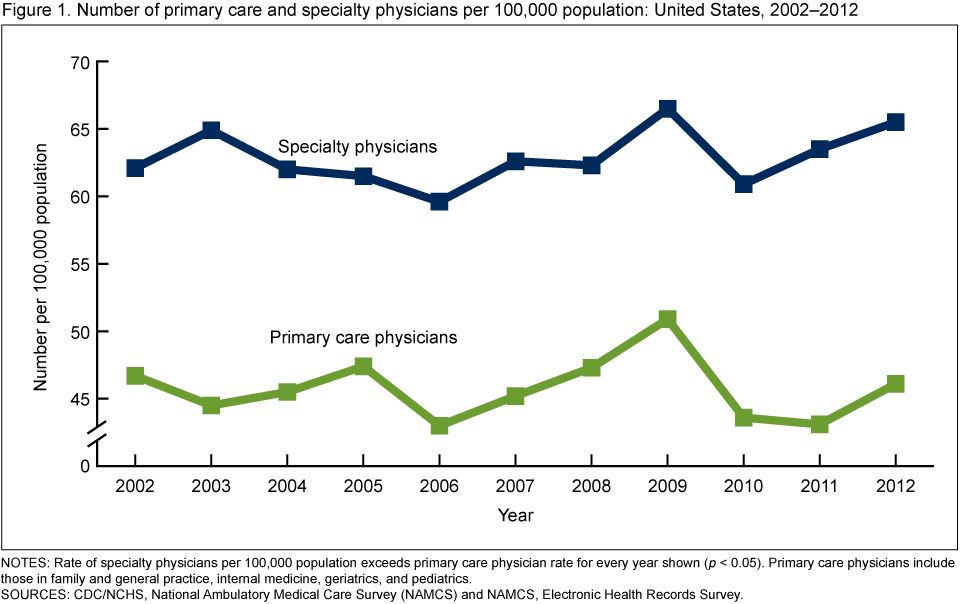
NOTES: Rate of specialty physicians per 100,000 population exceeds primary care physician rate for every year shown (p < 0.05). Primary care physicians include those in family and general practice, internal medicine, geriatrics, and pediatrics.
SOURCES: CDC/NCHS, National Ambulatory Medical Care Survey (NAMCS) and NAMCS, Electronic Health Records Survey.
- The overall supply of primary care physicians did not change significantly between 2002 and 2012 (46.7 and 46.1 per 100,000 population, respectively) (Figure 1).
- From 2002 to 2012, the supply of specialists consistently exceeded the supply of primary care physicians. The ratio of primary care physicians to specialists in 2012 was 0.70 and had remained stable from 2002 to 2012.
The supply of primary care physicians varied by state in 2012.
- The supply of primary care physicians per 100,000 population varied by state, ranging from 26.5 in Mississippi to 93.7 in Hawaii (Figure 2).
- The supply of primary care physicians exceeded the national average in four states (Massachusetts, Rhode Island, Vermont, and Washington) and was lower than the national average in six states (Arkansas, Georgia, Mississippi, Nevada, New Mexico, and Texas).
Figure 2. Number of primary care physicians per 100,000 population: United States, 2012
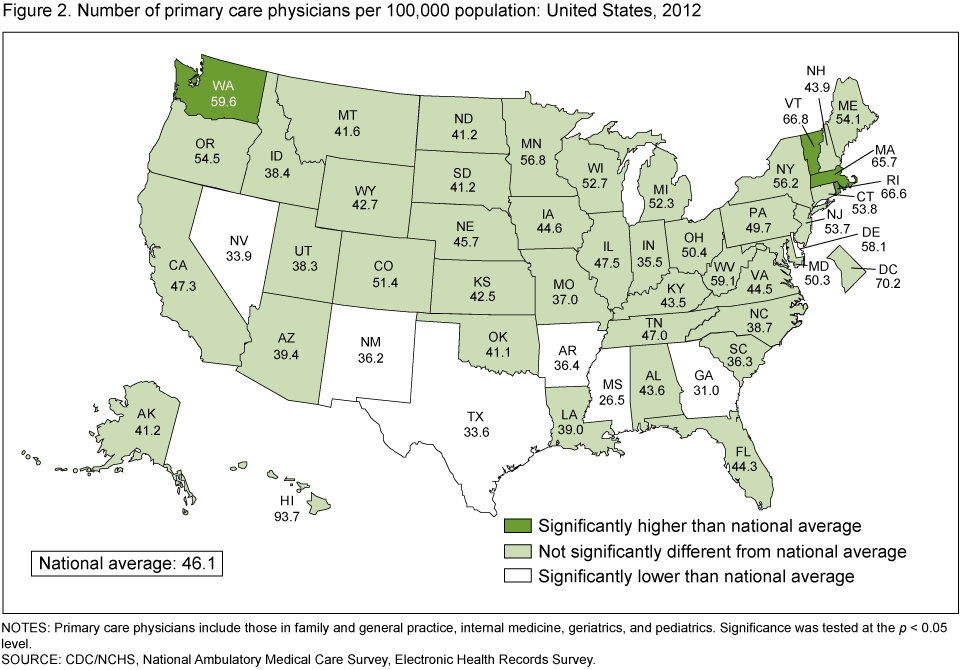
NOTES: Primary care physicians include those in family and general practice, internal medicine, geriatrics, and pediatrics. Significance was tested at the p < 0.05 level.
SOURCE: CDC/NCHS, National Ambulatory Medical Care Survey, Electronic Health Records Survey.
The percentage of primary care physicians with physician assistants or nurse practitioners in their practices varied by state.
- Overall, 53.0% of primary care physicians worked with physician assistants or nurse practitioners in their practices in 2012.
- The percentage of primary care physicians working with physician assistants or nurse practitioners varied by state, ranging from 33.4% in the District of Columbia to 89.6% in South Dakota (Figure 3).
- In 19 states (Alaska, Arizona, Idaho, Iowa, Kansas, Maine, Massachusetts, Minnesota, Montana, Nebraska, New Hampshire, New Mexico, North Carolina, North Dakota, South Dakota, Tennessee, Vermont, Wisconsin, and Wyoming), the percentage of physicians having physician assistants or nurse practitioners in their practices exceeded the national average; in Georgia, this percentage was lower than the national average.
- The percentage of primary care physicians with physician assistants or nurse practitioners in their practices in 2012 (53.0%) was similar to that in 2006 (51.2%), the first year in which NAMCS collected this information (data not shown).
Figure 3. Percentage of office-based primary care physicians with physician assistants or nurse practitioners in their practices: United States, 2012

NOTES: Primary care physicians include those in family and general practice, internal medicine, geriatrics, and pediatrics. Data omit 2.8% of physicians for whom information on physician assistants or nurse practitioners was missing. Significance was tested at the p < 0.05 level.
SOURCE: CDC/NCHS, National Ambulatory Medical Care Survey, Electronic Health Records Survey.
The availability of primary care physicians and the percentage of primary care physicians working with physician assistants or nurse practitioners varied by the urbanicity of the physician’s office location.
- The supply of primary care physicians was significantly greater with increasingly urban physician’s office locations, from 39.8 per 100,000 population in nonmetropolitan areas to 53.3 in large central metropolitan areas (Figure 4).
- The percentage of primary care physicians with physician assistants or nurse practitioners in their practices decreased with increasingly urban office locations, from 65.5% in nonmetropolitan areas to 41.9% in large central metropolitan areas.
Figure 4. Availability of primary care physicians and percentage of primary care physicians working with physician assistants or nurse practitioners, by urbanicity of physician’s office location: United States, 2012
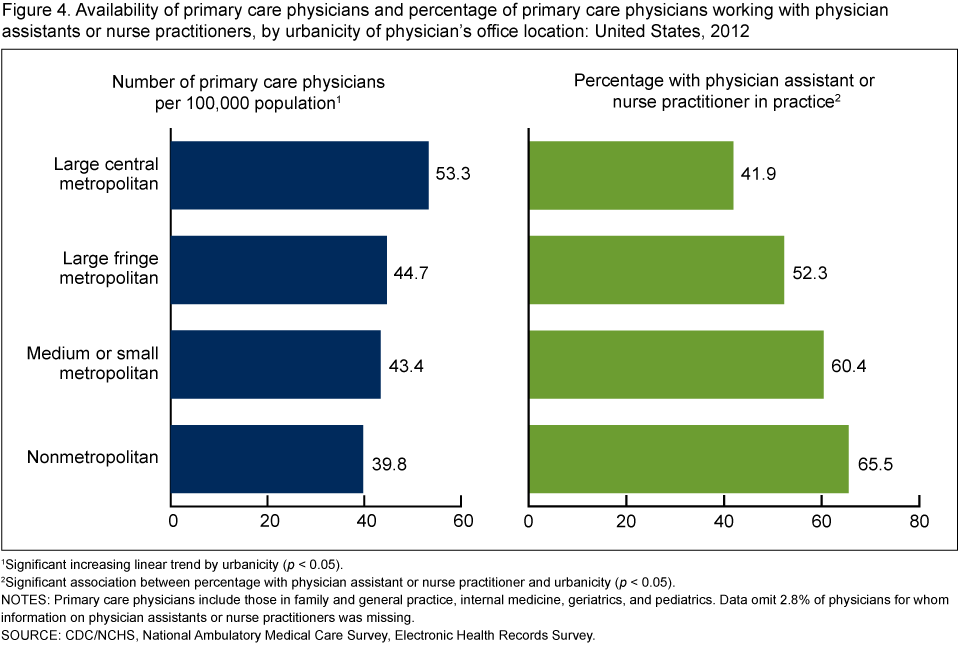
1Significant increasing linear trend by urbanicity (p < 0.05).
2Significant association between percentage with physician assistant or nurse practitioner and urbanicity (p < 0.05).
NOTES: Primary care physicians include those in family and general practice, internal medicine, geriatrics, and pediatrics. Data omit 2.8% of physicians for whom information on physician assistants or nurse practitioners was missing.
SOURCE: CDC/NCHS, National Ambulatory Medical Care Survey, Electronic Health Records Survey.
Primary care physicians in multispecialty group practices were more likely than those in solo or partner practices to work with physician assistants or nurse practitioners.
- A higher percentage of primary care physicians in multispecialty group practices (three or more physicians with different specialties) worked with physician assistants or nurse practitioners (77.5%) compared with those in small (solo or partner) practices (36.3%) (Figure 5).
- Among group practices, a higher percentage of primary care physicians in multispecialty practices worked with physician assistants or nurse practitioners (77.5%) compared with those in single-specialty practices (56.6%).
Summary
From 2002 to 2012, the supply of primary care physicians, measured as the number per 100,000 population, was stable, as was the ratio between primary care physicians and specialists, continuing a trend observed since the 1990s (7–9). In 2012, the supply of primary care physicians varied by state. In four states (Massachusetts, Rhode Island, Vermont, and Washington), the supply of primary care physicians was higher than the national average of 46.1 per 100,000 population; in six states (Arkansas, Georgia, Mississippi, Nevada, New Mexico, and Texas), the supply was lower than the national average.
Figure 5. Percentage of primary care physicians working with physician assistants or nurse practitioners, by practice type: United States, 2012
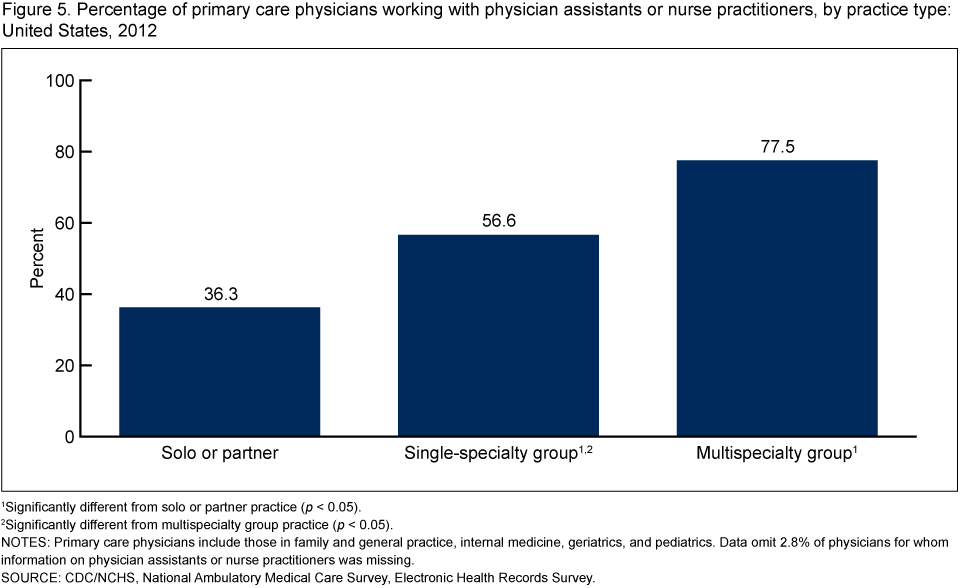
1Significantly different from solo or partner practice (p < 0.05).
2Significantly different from multispecialty group practice (p < 0.05).
NOTES: Primary care physicians include those in family and general practice, internal medicine, geriatrics, and pediatrics. Data omit 2.8% of physicians for whom information on physician assistants or nurse practitioners was missing.
SOURCE: CDC/NCHS, National Ambulatory Medical Care Survey, Electronic Health Records Survey.
Physician assistants and nurse practitioners provide a substantial amount of primary care (2,3). A previous study found twice as many nurse practitioners (18.9%) as physician assistants (10.3%) among primary care providers (5). In 2012, 53% of primary care physicians had physician assistant or nurse practitioners in their practices. States varied in the availability of physician assistants and nurse practitioners in physician offices. The percentage of physicians with physician assistants or nurse practitioners in their practices exceeded the national average in 19 states (Alaska, Arizona, Idaho, Iowa, Kansas, Maine, Massachusetts, Minnesota, Montana, Nebraska, New Hampshire, New Mexico, North Carolina, North Dakota, South Dakota, Tennessee, Vermont, Wisconsin, and Wyoming) and was lower than the national average in Georgia.
Physician assistants and nurse practitioners are more prevalent in rural and underserved areas, which have fewer primary care physicians (2,3,10). The findings—that the supply of primary care physicians increased as office locations became more urban, whereas the inclusion of physician assistants or nurse practitioners in primary care physician practices increased as office locations became less urban—are consistent with previous studies (2–4,10,11). State variation in the availability of physician assistants or nurse practitioners in primary care physician practices may also depend on the presence of integrated health care delivery systems, such as group health maintenance organizations, which include physician assistants and nurse practitioners more often than other physician practices (11). Our study found that physicians in multispecialty group practices had physician assistants or nurse practitioners in their practices more often than did single-specialty group practices or small (solo or partner) practices. Other factors, such as state variation in scope-of-practice laws for physician assistants and nurse practitioners and insurance payment policies, also affect the availability of physician assistants and nurse practitioners in physician practices (2–4,10,11).
Definitions
Nurse practitioner: Defined as an RN with advanced training in areas not usual for RNs, such as diagnosing and managing common diseases, ordering tests, and prescribing medications. Although several types of RNs have advanced training, most advanced practice nurses working in the offices of primary care physicians are nurse practitioners (5,6). Nurse midwives, another type of advanced practice nurse, typically work with obstetricians or gynecologists (6).
Supply of primary care physicians per 100,000 population: Defined as the number of primary care physicians divided by the civilian noninstitutionalized population in the United States as of July 1, 2012. Primary care physicians include office-based physicians in the specialties of family and general medicine, internal medicine, geriatrics, and pediatrics. The population estimates by state were prepared by the Population Division, U.S. Census Bureau. Population estimates by urban or rural classification are based on estimates of the civilian noninstitutionalized population in the United States as of July 1, 2012, from the 2012 National Health Interview Survey, National Center for Health Statistics (NCHS), compiled according to December 2009, Office of Management and Budget definitions of core-based statistical areas. For more information, see the U.S. Census Bureau’s metropolitan and micropolitan website.
Urban or rural classifications of the physician office’s ZIP code: Developed by the Centers for Disease Control and Prevention’s (CDC) NCHS to study the association between urbanicity and health and to monitor the health of urban and rural residents. The six-level classification scheme is based on county or county equivalents and Office of Management and Budget definitions.
Large central metropolitan area—An urban area; specifically, a county in a metropolitan statistical area (MSA) with a population of 1 million or more that contains the entire population of the largest principal city of the MSA, or whose entire population resides in the largest principal city of the MSA, or that contains at least 250,000 of the population of any principal city in the MSA.
Large fringe metropolitan area—A large suburban area; specifically, a county in an MSA with a population of 1 million or more that does not qualify as a large central metropolitan area.
Medium metropolitan area—A county in an MSA with a population of 250,000–999,999.
Small metropolitan area—A small town or suburb; specifically, a county in an MSA with a population of 50,000–249,999.
Rural or nonmetropolitan area—A county that is outside of any MSA (12).
Data sources and methods
Data for this report are from the NAMCS and the NAMCS EHR Survey, which are conducted by NCHS as annual, nationally representative surveys of office-based physicians. The target universe of the NAMCS and NAMCS EHR Survey is physicians classified as providing direct patient care in office-based practices, including clinicians in community health centers. Radiologists, anesthesiologists, and pathologists are excluded.
The NAMCS EHR Survey was first conducted in 2008 as a mail survey supplemental to the core NAMCS, which is an in-person survey. The NAMCS EHR Survey collects information on the adoption and use of EHR systems. In 2010, the NAMCS EHR survey sample size was increased fivefold to allow for state-level estimates.
The 2012 estimates are from the NAMCS EHR survey, with a sample of 10,302 physicians. Nonrespondents to the mail survey received followup telephone calls. Updated physician specialties were obtained from the survey. Use of midlevel providers in the physician offices was obtained from the question “How many midlevel providers (i.e., nurse practitioners, physician assistants, and nurse midwives) are associated with this office?” The 2012 mail survey was conducted from February through June 2012. The unweighted response rate for the 2012 mail survey was 68% (66% weighted). A copy of the 2012 survey is available from the NCHS website [PDF – 185.7 KB]
Statements of differences in estimates are based on statistical tests with significance at the p < 0.05 level. Differences by selected physician characteristics were examined using t tests for differences in percentages and Chi-square tests for differences in percent distributions. A weighted least-squares regression analysis was used to determine the significance of per capita supply of primary care physicians by urbanicity of physician office location (13).
About the authors
Esther Hing is with CDC’s National Center for Health Statistics, Division of Health Care Statistics, Ambulatory and Hospital Care Statistics Branch; Chun-Ju Hsiao is with the Agency for Healthcare Research and Quality.
References
- Centers for Medicare & Medicaid Services. Pub 100-04 Medicare claims processing [PDF – 229.83 KB]. CMS Manual System. Transmittal 2161. Baltimore, MD: Centers for Medicare & Medicaid Services. 2011.
- Cunningham R. Tapping the potential of the health care workforce: Scope-of-practice and payment policies for advanced practice nurses and physician assistants. Background paper no 76. Washington, DC: National Health Policy Forum, The George Washington University. 2010.
- Paradise J, Dark C, Bitler N. Improving access to adult primary care in Medicaid: Exploring the potential role of nurse practitioners and physician assistants. Issue paper. Washington, DC: Kaiser Commission on Medicaid and the Uninsured, The Henry J. Kaiser Family Foundation. 2011.
- Carrier ER, Yee T, Stark L. Matching supply to demand: Addressing the U.S. primary care workforce shortage. Policy analysis no 7. Washington, DC: National Institute for Health Care Reform. 2011.
- Agency for Healthcare Research and Quality. Primary care workforce facts and stats no 3. AHRQ pub no 12-P001-4-EF. Rockville, MD: Agency for Healthcare Research and Quality. 2012.
- U.S. Department of Health and Human Services. The registered nurse population: Findings from the 2008 National Sample Survey of Registered Nurses. Rockville, MD: Health Resources and Services Administration, U.S. Department of Health and Human Services. 2010.
- Colwill JM, Cultice JM, Kruse RL. Will generalist physician supply meet demands of an increasing aging population? Health Aff 27:w232–41. 2008.
- Staiger DO, Auerbach DI, Buerhaus PI. Comparison of physician workforce estimates and supply projections. JAMA 302(5):1674–80. 2009.
- Cunningham PJ. State variation in primary care physician supply: Implications for health reform Medicaid expansions. Research brief no 19. Washington, DC: Center for Studying Health System Change. March 2010.
- Larson EH, Palazzo L, Berkowitz B, Pirani MJ, Hart LG. The contribution of nurse practitioners and physician assistants to generalist care in Washington state. Health Serv Res 38(4):1033–50. 2003.
- Kaissi A, Kralewski J, Dowd B. Financial and organizational factors affecting employment of nurse practitioners and physician assistants in medical group practices. J Ambul Care Manage 26(3):209–16. 2003.
- National Center for Health Statistics. NCHS urban-rural classification scheme for counties. Hyattsville, MD: National Center for Health Statistics.
- Sirken MG, Shimizu I, French DK, Brock DB. Manual on standards and procedures for reviewing statistical reports. Hyattsville, MD: National Center for Health Statistics. 1990.
Suggested citation
Hing E, Hsiao CJ. State variability in supply of office-based primary care providers: United States, 2012. NCHS data brief, no 151. Hyattsville, MD: National Center for Health Statistics. 2014.
Copyright information
All material appearing in this report is in the public domain and may be reproduced or copied without permission; citation as to source, however, is appreciated.
National Center for Health Statistics
Charles J. Rothwell, M.S., M.B.A., Director
Jennifer H. Madans, Ph.D., Associate Director for Science
Division of Health Care Statistics
Clarice Brown, M.S., Director