Routine Prenatal Care Visits by Provider Specialty in the United States, 2009–2010
- Key findings
- The percentage of routine prenatal care visits at which women saw non-ob/gyn providers generally decreased with age.
- The percentage of prenatal visits to non-ob/gyn providers did not differ by race and ethnicity group in 2009–2010.
- In 2009–2010, the percentage of routine prenatal care visits at which women saw non-ob/gyn providers varied by the expected source of payment.
- The percentage of routine prenatal care visits at which women saw non-ob/gyn providers varied by the geographic location of patients’ residence in 2009–2010.
- Summary
- Definitions
- Data sources and methods
- About the authors
- References
- Suggested citation
NCHS Data Brief No. 145, March 2014
PDF Version (627 KB)
Sayeedha G. Uddin, M.D., M.P.H.; Alan E. Simon, M.D., M.P.H.; and Kelly Myrick, Ph.D., C.P.H.
Key findings
Data from the 2009 and 2010 National Ambulatory Medical Care Survey and National Hospital Ambulatory Medical Care Survey
- At 14.1% of routine prenatal care visits in the United States in 2009–2010, women saw providers whose specialty was not obstetrics and gynecology (ob/gyn).
- The percentage of routine prenatal care visits that were made to non-ob/gyn providers was highest (20.5%) among women aged 15–19.
- Visits to non-ob/gyn providers accounted for a higher percentage of routine prenatal care visits among women with Medicaid (24.3%) and women with no insurance (23.1%) compared with women with private insurance (7.3%).
- The percentage of routine prenatal care visits to non-ob/gyn providers was lower among women in large suburban areas (5.1%) compared with those in urban areas (14.4%) or in small towns or suburbs (22.4%).
Early and adequate prenatal care is a Healthy People 2020 objective (1). Previous studies have focused on practice patterns of obstetricians/gynecologists or overall ambulatory care utilization by women (2–5). However, the amount of routine prenatal care delivered by obstetrics and gynecology (ob/gyn) providers and non-ob/gyn providers has not been quantified. Understanding which providers deliver prenatal care may yield valuable information about training and workforce needs. This report quantifies the amount of routine prenatal care delivered by non-ob/gyn providers among women aged 15–54 who were seen in physicians’ offices, community health centers, and hospital outpatient departments (OPDs).
Keywords: maternal health, antenatal care, ambulatory obstetric care
The percentage of routine prenatal care visits at which women saw non-ob/gyn providers generally decreased with age.
Overall, women aged 15–54 saw non-ob/gyn providers at 14.1% of their routine prenatal care visits in 2009–2010 (Figure 1). The percentage of visits to non-ob/gyn providers generally decreased with age: those aged 15–19 had the highest rates (20.5%), and those aged 30–34 and 35–54 had the lowest rates (8.9% and 10.3%, respectively).
Figure 1. Routine prenatal care visits among women aged 15–54, by age and provider specialty: United States, 2009–2010
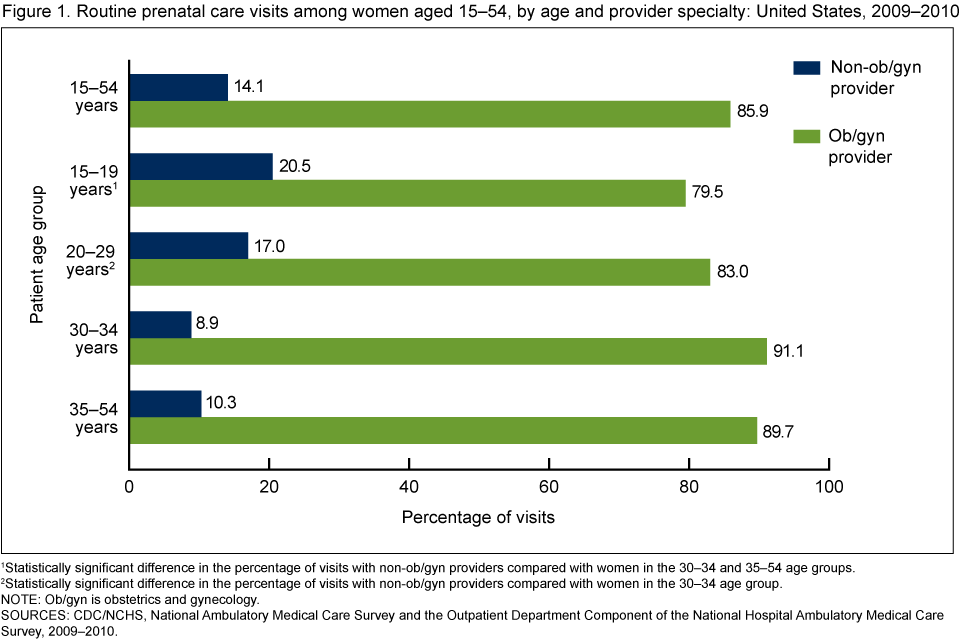
1Statistically significant difference in the percentage of visits with non-ob/gyn providers compared with women in the 30–34 and 35–54 age groups.
2Statistically significant difference in the percentage of visits with non-ob/gyn providers compared with women in the 30–34 age group.
NOTE: Ob/gyn is obstetrics and gynecology.
SOURCES: CDC/NCHS, National Ambulatory Medical Care Survey and the Outpatient Department Component of the National Hospital Ambulatory Medical Care Survey, 2009–2010.
The percentage of prenatal visits to non-ob/gyn providers did not differ by race and ethnicity group in 2009–2010.
Generally, women of different race and ethnicity groups did not differ in the percentage of prenatal care visits at which they saw non-ob/gyn providers (Figure 2).
Figure 2. Routine prenatal care visits among women aged 15–54, by race and Hispanic origin and by provider specialty: United States, 2009–2010
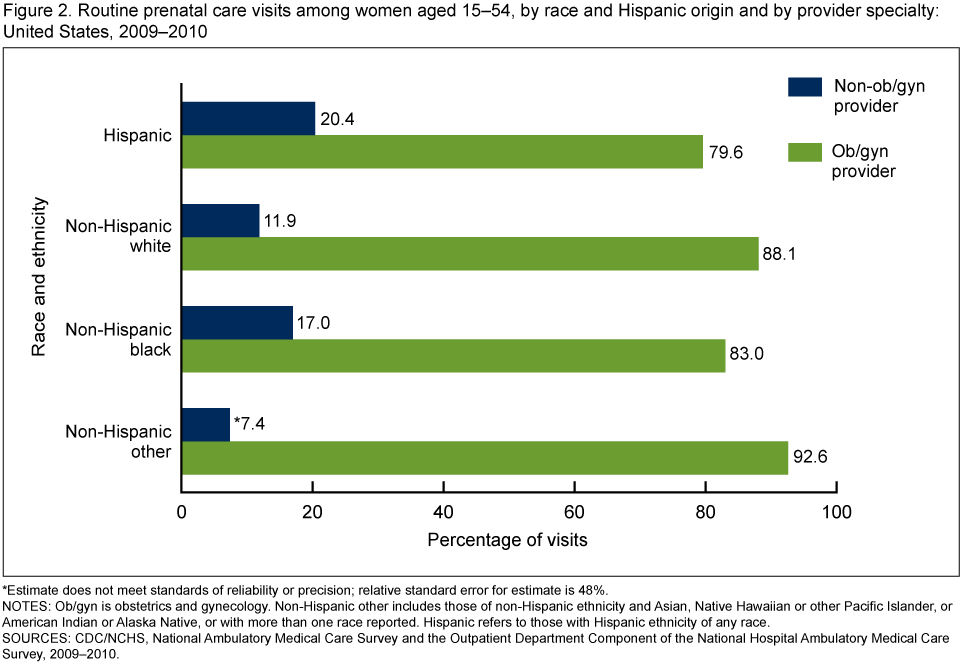
*Estimate does not meet standards of reliability or precision; relative standard error for estimate is 48%.
NOTES: Ob/gyn is obstetrics and gynecology. Non-Hispanic other includes those of non-Hispanic ethnicity and Asian, Native Hawaiian or other Pacific Islander, or American Indian or Alaska Native, or with more than one race reported. Hispanic refers to those with Hispanic ethnicity of any race.
SOURCES: CDC/NCHS, National Ambulatory Medical Care Survey and the Outpatient Department Component of the National Hospital Ambulatory Medical Care Survey, 2009–2010.
In 2009–2010, the percentage of routine prenatal care visits at which women saw non-ob/gyn providers varied by the expected source of payment.
The percentage of prenatal care visits that were made to non-ob/gyn providers was higher among women with no insurance (23.1%) and women with Medicaid (24.3%) compared with women with private insurance (7.3%) (Figure 3).
Figure 3. Routine prenatal care visits among women aged 15–54, by expected source of payment and provider specialty: United States, 2009–2010
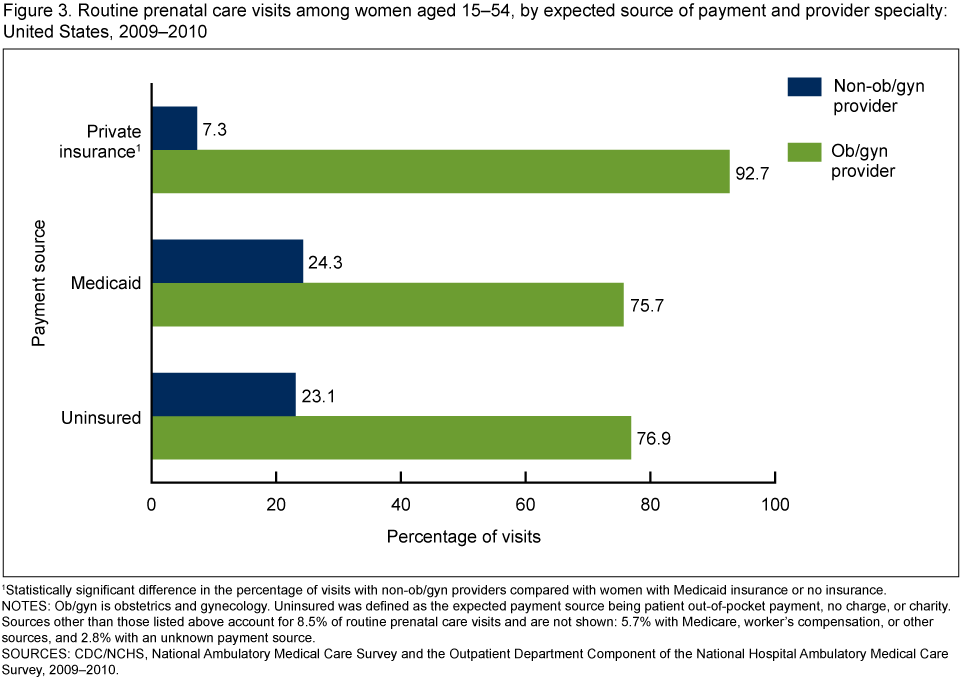
1Statistically significant difference in the percentage of visits with non-ob/gyn providers compared with women with Medicaid insurance or no insurance.
NOTES: Ob/gyn is obstetrics and gynecology. Uninsured was defined as the expected payment source being patient out-of-pocket payment, no charge, or charity. Sources other than those listed above account for 8.5% of routine prenatal care visits and are not shown: 5.7% with Medicare, worker’s compensation, or other sources, and 2.8% with an unknown payment source.
SOURCES: CDC/NCHS, National Ambulatory Medical Care Survey and the Outpatient Department Component of the National Hospital Ambulatory Medical Care Survey, 2009–2010.
The percentage of routine prenatal care visits at which women saw non-ob/gyn providers varied by the geographic location of patients’ residence in 2009–2010.
The percentage of routine prenatal care visits that were made to non-ob/gyn providers was lowest (5.1%) among patients living in large fringe metropolitan areas (large suburban counties) (Figure 4). This is in comparison to those living in large central metropolitan areas (urban areas) and those living in small metropolitan or micropolitan areas (small towns and small suburban and rural counties), who saw non-ob/gyn providers at, respectively, 14.4% and 22.4% of their prenatal care visits.
Figure 4. Routine prenatal care visits among women aged 15–54 years, by patient residence area and provider specialty: United States, 2009–2010
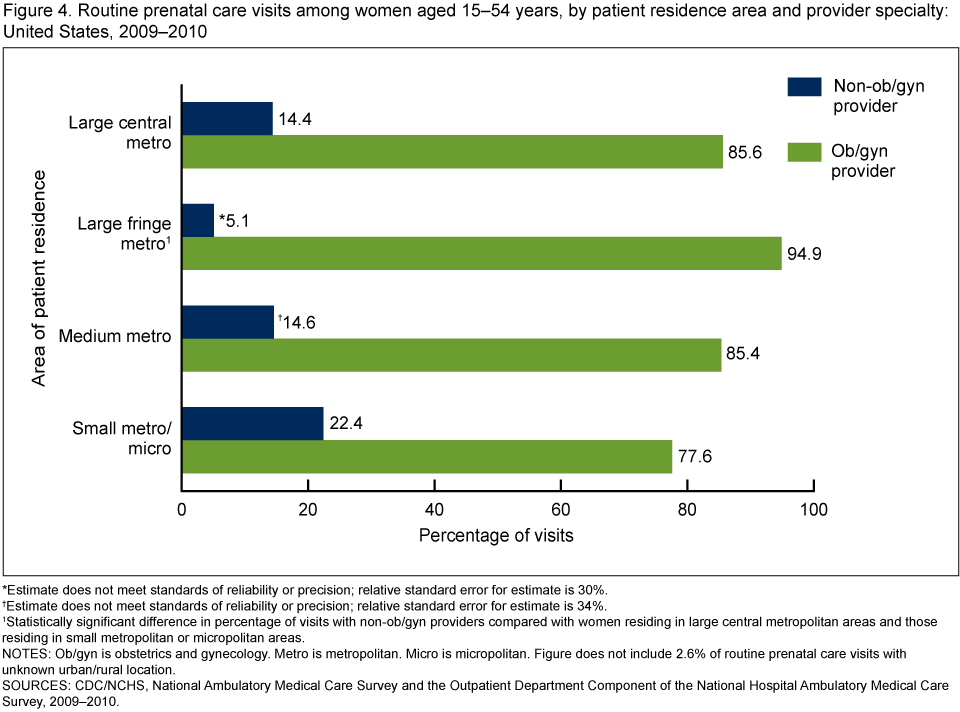
*Estimate does not meet standards of reliability or precision; relative standard error for estimate is 30%.
†Estimate does not meet standards of reliability or precision; relative standard error for estimate is 34%.
1Statistically significant difference in percentage of visits with non-ob/gyn providers compared with women residing in large central metropolitan areas and those residing in small metropolitan or micropolitan areas.
NOTES: Ob/gyn is obstetrics and gynecology. Metro is metropolitan. Micro is micropolitan. Figure does not include 2.6% of routine prenatal care visits with unknown urban/rural location.
SOURCES: CDC/NCHS, National Ambulatory Medical Care Survey and the Outpatient Department Component of the National Hospital Ambulatory Medical Care Survey, 2009–2010.
Summary
Non-ob/gyn providers delivered one out of every seven routine prenatal care visits in the United States in 2009–2010. Visits to non-ob/gyn providers occurred more frequently for women in younger age groups compared with women in older age groups. Although racial and ethnic disparities in the receipt of prenatal care have been previously noted (6,7), this analysis indicates that non-ob/gyn providers contributed similarly to the delivery of routine prenatal care among women of different racial and ethnic groups. Nearly one-quarter of routine prenatal care visits by women with Medicaid and by women with no insurance were to non-ob/gyn providers. The finding of a higher percentage of routine prenatal care visits to non-ob/gyn providers in large urban and small suburban and rural locations, compared with large suburban areas, is consistent with previous studies indicating that fewer ob/gyn providers practice in inner city areas and rural locations (8,9). This is the first report to quantify the amount of routine prenatal care performed by non-ob/gyn and ob/gyn providers and to document subgroups of pregnant patients for whom non-ob/gyn providers perform a substantial proportion of routine prenatal care.
Definitions
Routine prenatal care visit: Defined as a visit that had an International Classification of Diseases, Ninth Revision, Clinical Modification (ICD-9-CM) (10) diagnosis code of V22 (supervision of normal pregnancy) or V23 (supervision of high-risk pregnancy) or a reason for visit code of 3205.0 (prenatal examination, routine) (11–14).
Obstetrician/gynecologist provider: Defined in the National Ambulatory Medical Care Survey (NAMCS) as a physician whose specialty is included in the obstetrics and gynecology specialty category (11–12). Defined in the National Hospital Ambulatory Medical Care Survey (NHAMCS) OPD component as obstetrics and gynecology clinics (13–14).
Urban/rural classification of the provider’s ZIP code: Based on the Office of Management and Budget’s 2000 standards for defining metropolitan and micropolitan statistical areas, the December 2005 delineation of these areas, and vintage 2004 postcensal estimates of the resident U.S. population, the Centers for Disease Control and Prevention’s (CDC) National Center for Health Statistics (NCHS) developed this classification to study the association between urbanicity and health and to monitor the health of urban and rural residents. The six-level classification scheme is based on county or county equivalents.
Large central metropolitan area—An urban area; specifically, a county in a metropolitan statistical area (MSA) with a population of 1 million or more that includes the entire population of the largest principal city of the MSA, or whose entire population resides in the largest principal city of the MSA, or that contains at least 250,000 of the residents of any principal city in the MSA.
Large fringe metropolitan area—A large suburban area; specifically, a county in an MSA with a population of 1 million or more that does not qualify as a large central metropolitan area.
Medium metropolitan area—A county in an MSA with a population of 250,000–999,999.
Small metropolitan area—A small town or suburb; specifically, a county in an MSA with a population of 50,000–249,999.
Small micropolitan area—A rural or nonmetropolitan county that is outside of any MSA (15).
Expected source of payment for women with routine prenatal care visits: Classified as private if private insurance was documented, and Medicare was not documented. Classified as Medicaid if Medicaid was documented without Medicare or private insurance. Classified as uninsured if self-pay, no charge, or charity was documented, and no other insurance was documented.
Data sources and methods
All estimates are from the 2009 and 2010 NAMCS and NHAMCS, both of which are conducted by NCHS.
NAMCS is a national probability sample survey of office-based physicians. The sampling frame for the 2009 and 2010 NAMCS comprised all physicians from the master files of the American Medical Association and the American Osteopathic Association. Physicians are in scope if they are engaged in patient care activities; are nonfederally employed; and are not in the specialties of anesthesiology, pathology, or radiology. The NAMCS physician response rate was 62.4% in 2009 and 57.3% in 2010. More details about NAMCS methodology are available elsewhere (11–12).
NHAMCS is an annual nationally representative survey of visits to nonfederal, general and short-stay hospital emergency departments and OPDs. The sampling frame for the 2009 NHAMCS was constructed from products of Verispan L.L.C.; specifically, “Healthcare Market Index, Updated July 15, 2006” and “Hospital Market Profiling Solution, Second Quarter, 2006.” These products were formerly known as the SMG Hospital Database. SDI acquired Verispan in July 2008. The sampling frame for the 2010 NHAMCS was constructed from SDI’s “Hospital Market Profiling Solution.” The OPD visit response rate was 73% in 2009 and 74% in 2010. More details about NHAMCS methodology are available elsewhere (13–14).
Visit data in this study were limited to visits for routine prenatal care (those with ICD-9-CM diagnoses of V22 or V23 or a reason for visit code of 3205.0). Data analyses were performed using three statistical packages: Stata version 12.0 (College Station, Tex.), SAS version 9.3 (SAS Institute, Cary, N.C.), and SUDAAN version 11.0 (RTI International, Research Triangle Park, N.C.). Estimates with relative standard errors greater than or equal to 30% are considered to have lower precision. Differences by type of provider for selected subgroups of patients and visit characteristics were evaluated using t-tests for differences in percentages using p < 0.05 as the level of significance. Statistical comparisons using t-tests account for the precision of the estimates being compared. No adjustments for multiple comparisons were made. All comparisons mentioned in the text are statistically significant unless otherwise noted.
About the authors
Sayeedha G. Uddin and Kelly Myrick are with CDC’s National Center for Health Statistics (NCHS), Division of Health Care Statistics; Alan E. Simon is with NCHS Office of Analysis and Epidemiology.
References
- U.S. Department of Health and Human Services. Office of Disease Prevention and Health Promotion. Healthy People 2020. Washington, DC: U.S. Department of Health and Human Services.
- Brett KM, Burt CW. Utilization of medical care by women: United States, 1997–1998. National Center for Health Statistics. Vital Health Stat 13(149). 2001.
- Coleman VH, Power ML, Zinberg S, Schulkin J. Contemporary clinical issues in outpatient obstetrics and gynecology: Findings of the Collaborative Ambulatory Research Network, 2001–2004: Part I. Obstet Gynecol Surv 59(11):780–6. 2004.
- Coleman VH, Power ML, Zinberg S, Schulkin J. Contemporary clinical issues in outpatient obstetrics and gynecology: Findings of the Collaborative Ambulatory Research Network, 2001–2004: Part II. Obstet Gynecol Surv 59(11):787–94. 2004.
- Hill LD, Erickson K, Holzman GB, Power ML, Schulkin J. Practice trends in outpatient obstetrics and gynecology: Findings of the Collaborative Ambulatory Research Network, 1999–2000. Obstet Gynecol Surv 56(8):505–16. 2001.
- Agency for Healthcare Research and Quality. 2012 national healthcare disparities report. Rockville, MD: Agency for Healthcare Research and Quality. 2013.
- Bromley E, Nunes A, Phipps MG. Disparities in pregnancy healthcare utilization between Hispanic and non-Hispanic white women in Rhode Island. Matern Child Health J 16(8):1576–82. 2012.
- Fossett JW, Perloff JD, Kletke PR, Peterson JA. Medicaid patients’ access to office-based obstetricians. J Health Care Poor Underserved 1(4):405–21. 1991.
- National Research Council. Quality through collaboration: The future of rural health care. Washington, DC: The National Academies Press. 2005.
- U.S. Department of Health and Human Services, Centers for Disease Control and Prevention, Centers for Medicare & Medicaid Services. International classification of diseases, ninth revision, clinical modification. 6th ed. DHHS Pub No. (PHS) 06-1260. 2006.
- National Center for Health Statistics. National Ambulatory Medical Care Survey. Public use data file documentation. Hyattsville, MD. 2009.
- National Center for Health Statistics. National Ambulatory Medical Care Survey. Public use data file documentation. Hyattsville, MD. 2010.
- National Center for Health Statistics. National Hospital Ambulatory Medical Care Survey. Public use data file documentation. Hyattsville, MD. 2009.
- National Center for Health Statistics. National Hospital Ambulatory Medical Care Survey. Public use data file documentation. Hyattsville, MD. 2010.
- National Center for Health Statistics. 2006 NCHS urban-rural classification scheme for counties. Hyattsville, MD.
Suggested citation
Uddin SG, Simon AE, Myrick K. Routine prenatal care visits by provider specialty in the United States, 2009–2010. NCHS data brief, no 145. Hyattsville, MD: National Center for Health Statistics. 2014.
Copyright information
All material appearing in this report is in the public domain and may be reproduced or copied without permission; citation as to source, however, is appreciated.
National Center for Health Statistics
Charles J. Rothwell, M.S., M.B.A., Director
Jennifer H. Madans, Ph.D., Associate Director for Science
Division of Health Care Statistics
Clarice Brown, M.S., Director