Emergency Department Visits by Persons Aged 65 and Over: United States, 2009–2010
- Key findings
- How many ED visits were made by persons aged 65 and over, and did the visit rate increase with age?
- What percentage of ED visits by older adults were made by nursing home residents, and did this percentage vary by age?
- What percentage of ED visits by older adults arrived by ambulance, and did this percentage vary by age?
- What percentage of ED visits by older adults were caused by injury, and did this percentage vary by age?
- What percentage of ED visits by older adults led to hospitalization, and did this percentage vary by age?
- Summary
- Definitions
- Data source and methods
- About the authors
- References
- Suggested citation
NCHS Data Brief No. 130, October 2013
PDF Version (1.20 MB)
Michael Albert, M.D., M.P.H.; Linda F. McCaig, M.P.H.; and Jill J. Ashman, Ph.D.
Key findings
Data from the National Hospital Ambulatory Medical Care Survey, 2009–2010
- In 2009–2010, a total of 19.6 million emergency department (ED) visits in the United States were made by persons aged 65 and over. The visit rate for this age group was 511 per 1,000 persons and increased with age.
- The percentage of ED visits made by nursing home residents, patients arriving by ambulance, and patients admitted to the hospital increased with age.
- Twenty-nine percent of ED visits by persons aged 65 and over were related to injury, and the percentage was higher among those aged 85 and over than among those aged 65–74 or 75–84.
- The percentage of ED visits caused by falls increased with age.
From 2000–2010, the number of persons in the United States aged 65 and over rose 15%, from 35.0 million to 40.3 million, and in 2010 this age group represented 13% of the population (1). It is estimated that by 2030, nearly one in five persons will be aged 65 and over (2). Given their growing proportion of the population, older individuals will comprise an increasing share of emergency department (ED) patients in the coming years. This is important because of the ED’s role in treating acute illness and injury in older adults and providing a pathway to these patients for hospital admission (3,4). This report describes ED visits made by individuals aged 65 and over and compares age groups 65–74, 75–84, and 85 and over.
Keywords: health care utilization, older adults, National Hospital Ambulatory Medical Care Survey
How many ED visits were made by persons aged 65 and over, and did the visit rate increase with age?
- In 2009–2010, 19.6 million ED visits (15% of all ED visits) in the United States were made by patients aged 65 and over. (Figure 1).
Figure 1. Number and rate of emergency department visits for persons aged 65 and over: United States, 2009–2010
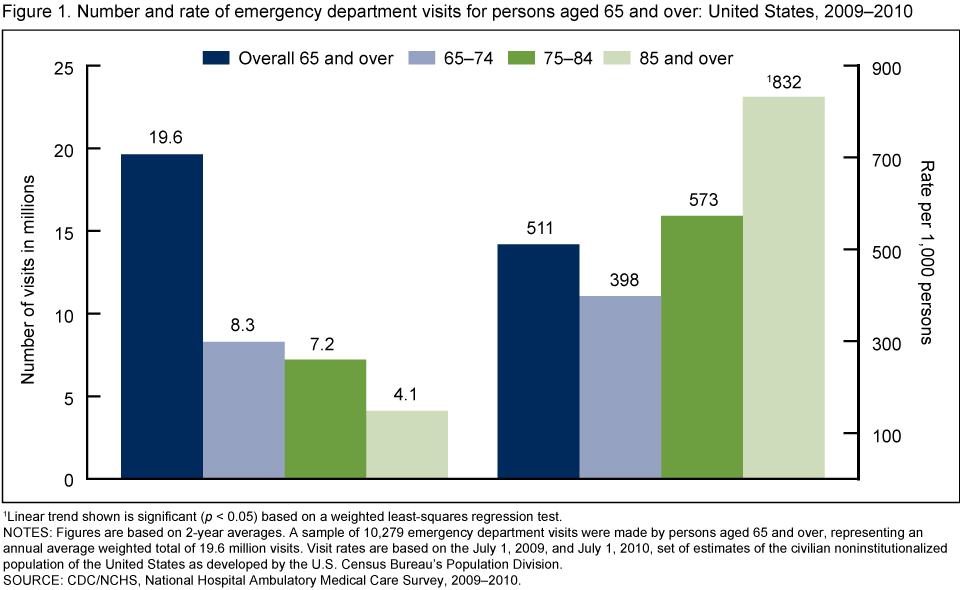
1Linear trend shown is significant (p < 0.05) based on a weighted least-squares regression test.
NOTES: Figures are based on 2-year averages. A sample of 10,279 emergency department visits were made by persons aged 65 and over, representing an annual average weighted total of 19.6 million visits. Visit rates are based on the July 1, 2009, and July 1, 2010, set of estimates of the civilian noninstitutionalized population of the United States as developed by the U.S. Census Bureau’s Population Division.
SOURCE: CDC/NCHS, National Hospital Ambulatory Medical Care Survey, 2009–2010.
- The annual average ED visit rate among persons aged 65 and over was 511 per 1,000 persons and increased as age increased: 398 per 1,000 persons aged 65–74, 573 per 1,000 persons aged 75–84, and 832 per 1,000 persons aged 85 and over.
What percentage of ED visits by older adults were made by nursing home residents, and did this percentage vary by age?
- In 2009–2010, nursing home residents accounted for 11.1% of ED visits made by patients aged 65 and over (Figure 2).
- As age increased, the percentage of ED visits made by nursing home residents also increased. Nursing home residents accounted for 4.6% of ED visits made by patients aged 65–74, 12.3% of visits made by those aged 75–84, and 21.9% of visits made by those aged 85 and over.
Figure 2. Percentage of emergency department visits by nursing home residents for persons aged 65 and over: United States, 2009–2010
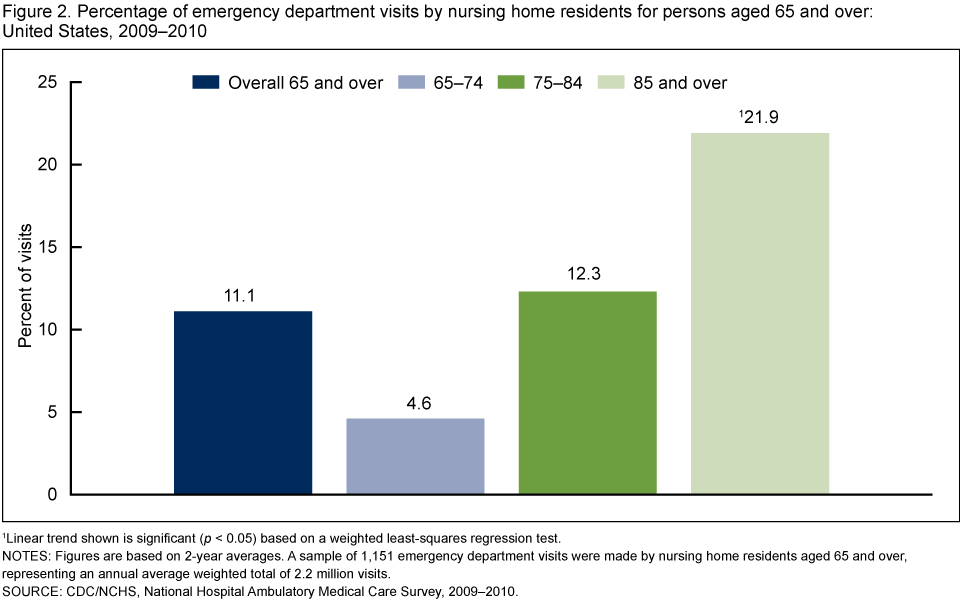
1Linear trend shown is significant (p < 0.05) based on a weighted least-squares regression test.
NOTES: Figures are based on 2-year averages. A sample of 1,151 emergency department visits were made by nursing home residents aged 65 and over, representing an annual average weighted total of 2.2 million visits.
SOURCE: CDC/NCHS, National Hospital Ambulatory Medical Care Survey, 2009–2010.
What percentage of ED visits by older adults arrived by ambulance, and did this percentage vary by age?
- In 2009–2010, ambulance was the mode of arrival for 38.3% of all ED visits made by patients aged 65 and over (Figure 3).
- The percentage of ED visits where the patient arrived by ambulance increased with age: 29.2% of visits by those aged 65–74, 39.5% by those aged 75–84, and 54.3% by those aged 85 and over.
Figure 3. Percentage of emergency department visits arriving by ambulance for persons aged 65 and over: United States, 2009–2010
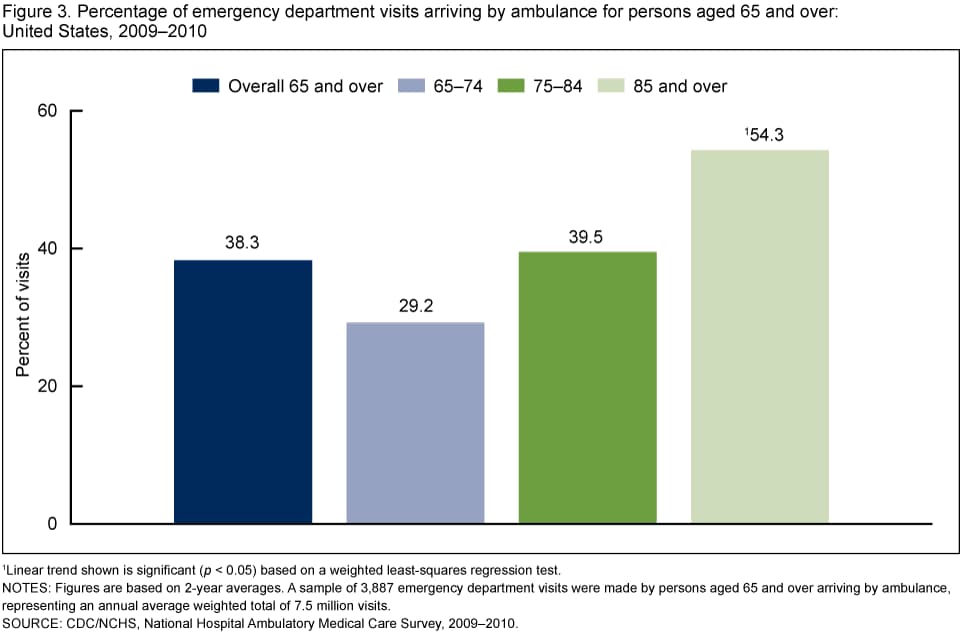
1Linear trend shown is significant (p < 0.05) based on a weighted least-squares regression test.
NOTES: Figures are based on 2-year averages. A sample of 3,887 emergency department visits were made by persons aged 65 and over arriving by ambulance, representing an annual average weighted total of 7.5 million visits.
SOURCE: CDC/NCHS, National Hospital Ambulatory Medical Care Survey, 2009–2010.
What percentage of ED visits by older adults were caused by injury, and did this percentage vary by age?
- In 2009–2010, 29.1% of ED visits by persons aged 65 and over were related to injury (Figure 4).
- The percentage of injury-related ED visits was higher among those aged 85 and over (33.4%) than among those aged 65–74 (28.2%) and 75–84 (27.8%).
- Unintentional falls accounted for 13.5% of ED visits by persons aged 65 and over.
- The percentage of ED visits caused by falls increased with age: 10.4% of ED visits by those aged 65–74, 13.2% by those aged 75–84, and 20.0% by those aged 85 and over.
Figure 4. Percentage of emergency department visits caused by any injury and by unintentional falls for persons aged 65 and over: United States, 2009–2010
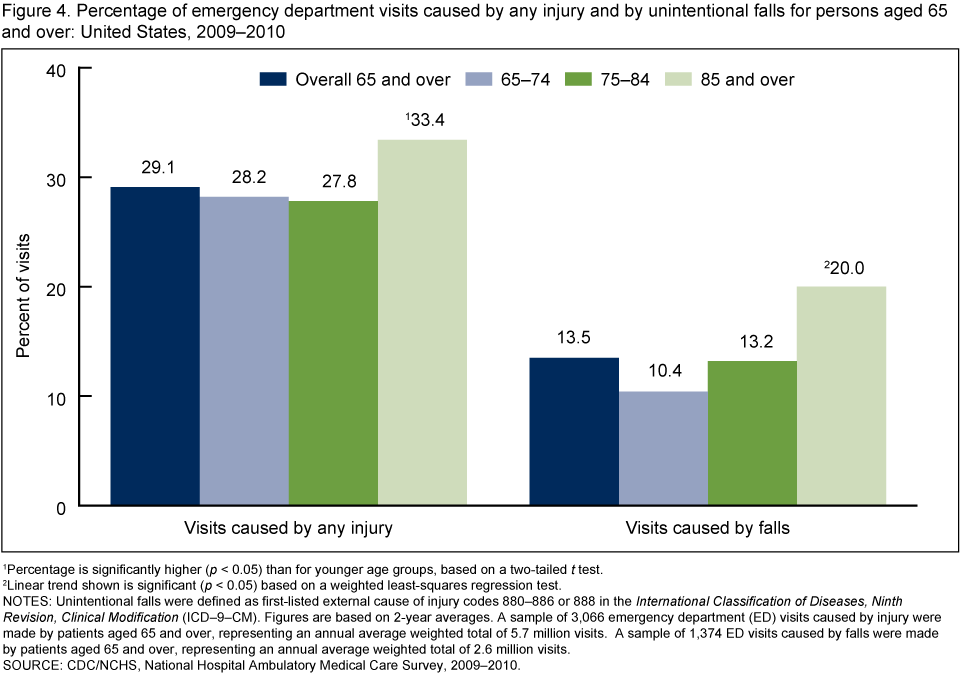
1Percentage is significantly higher (p < 0.05) than for younger age groups, based on a two-tailed t test.
2Linear trend shown is significant (p < 0.05) based on a weighted least-squares regression test.
NOTES: Unintentional falls were defined as first-listed external cause of injury codes 880–886 or 888 in the International Classification of Diseases, Ninth Revision, Clinical Modification (ICD–9–CM). Figures are based on 2-year averages. A sample of 3,066 emergency department (ED) visits caused by injury were made by patients aged 65 and over, representing an annual average weighted total of 5.7 million visits. A sample of 1,374 ED visits caused by falls were made by patients aged 65 and over, representing an annual average weighted total of 2.6 million visits.
SOURCE: CDC/NCHS, National Hospital Ambulatory Medical Care Survey, 2009–2010.
What percentage of ED visits by older adults led to hospitalization, and did this percentage vary by age?
- In 2009–2010, 36.5% of ED visits made by persons aged 65 and over resulted in hospital admission (Figure 5).
- The percentage of ED visits that resulted in hospital admission increased as age increased: 32.4% of visits by those aged 65–74, 37.2% by those aged 75–84, and 43.4% by those aged 85 and over.
Figure 5. Percentage of emergency department visits resulting in hospital admission for persons aged 65 and over: United States, 2009–2010

1Linear trend shown is significant (p < 0.05) based on a weighted least-squares regression test.
NOTES: Figures are based on 2-year averages. A sample of 3,679 emergency department visits resulting in hospital admission were made by patients aged 65 and over, representing an annual average weighted total of 7.2 million visits.
SOURCE: CDC/NCHS, National Hospital Ambulatory Medical Care Survey, 2009–2010.
Summary
This analysis examined ED visits made by persons aged 65 and over in 2009–2010 and identified a number of differences by age. The ED visit rate and the percentage of ED visits made by nursing home residents, patients arriving by ambulance, and patients admitted to the hospital increased with age. The percentage of injury-related ED visits was highest among persons aged 85 and over, and the percentage of visits caused by a fall increased with age. As the proportion of older individuals in the United States continues to rise, the recognition of age differences in the utilization and provision of ED services among this population will be important.
Definitions
Emergency department (ED): A hospital facility that provides unscheduled outpatient services to patients whose conditions require immediate care, and is staffed 24 hours a day. Onsite and offsite EDs that are open fewer than 24 hours are included, if staffed by the hospital.
Emergency department visit: Direct, in-person exchange between a patient seeking ED care and a health care provider.
Injury-related visit: A visit that met one of the following three conditions: a “yes” was marked in response to the question, “Is this visit related to an injury, poisoning, or adverse effect of medical treatment?”; a cause of injury or a nature of injury diagnosis was provided; or an injury-related reason for visit was reported.
Data source and methods
Data for this analysis are from the National Hospital Ambulatory Medical Care Survey (NHAMCS), an annual, nationally representative survey of nonfederal, general, and short-stay hospitals. NHAMCS is conducted by the Centers for Disease Control and Prevention’s (CDC) National Center for Health Statistics and provides data on the utilization and provision of ambulatory care services in hospital emergency and outpatient departments (5,6). NHAMCS uses a multistage probability design with samples of geographic primary sampling units (PSUs), hospitals within PSUs, and patient visits within EDs. Each year, approximately 480 hospitals are selected for inclusion in NHAMCS, and data are collected on approximately 35,000 ED visits. Additional information on the methodology of NHAMCS has been described previously (5,6). Data were imputed for patient age. Proportions for nonimputed variables are based on totals that include unknown and blank responses.
Visits were considered to have been caused by an unintentional fall if they had a first-listed external cause of injury code of 880–886 or 888 from the International Classification of Diseases, Ninth Revision (ICD–9–CM) (7). Data analyses were performed using the statistical packages SAS, version 9.3 (SAS Institute, Cary, N.C.) and SAS-callable SUDAAN, version 10.0 (RTI International, Research Triangle Park, N.C.). A weighted least-squares regression analysis was used to test the significance of linear trends by age group (8). Differences in the percentage of injury-related visits between age groups in Figure 4 were evaluated using a two-tailed t test. Comparisons reported in the text are statistically significant (p < 0.05), unless otherwise indicated.
About the authors
Michael Albert, Linda F. McCaig, and Jill J. Ashman are with CDC’s National Center for Health Statistics, Division of Health Care Statistics, Ambulatory and Hospital Care Statistics Branch.
References
- Werner CA. The older population: 2010. Census brief C2010BR–09. U.S. Census Bureau: Washington, DC. 2011.
- Vincent GK, Velkoff VA. The next four decades: The older population in the United States: 2010 to 2050. Current population reports P25–1138. U.S. Census Bureau: Washington, DC. 2010.
- Hwang U, Morrison RS. The geriatric emergency department. J Am Geriatr Soc 55(11):1873–6. 2007.
- Wang HE, Shah MN, Allman RM, Kilgore M. Emergency department visits by nursing home residents in the United States. J Am Geriatr Soc 59(10):1864–72. 2011.
- National Center for Health Statistics. 2009 NHAMCS micro-data file documentation [PDF – 1.5 MB]. 2009.
- National Center for Health Statistics. 2010 NHAMCS micro-data file documentation [PDF- 1.5 MB]. 2010.
- U.S. Department of Health and Human Services. Centers for Disease Control and Prevention, Centers for Medicare & Medicaid Services. International classification of diseases, ninth revision, clinical modification, 6th ed. DHHS Pub No. (PHS) 06–1260. 2006.
- Gillum BS, Graves EJ, Kozak LJ. Trends in hospital utilization: United States, 1988–92. National Center for Health Statistics. Vital Health Stat 13(124). 1996.
Suggested citation
Albert M, McCaig LF, Ashman JJ. Emergency department visits by persons aged 65 and over: United States, 2009–2010. NCHS data brief, no 130. Hyattsville, MD: National Center for Health Statistics. 2013.
Copyright information
All material appearing in this report is in the public domain and may be reproduced or copied without permission; citation as to source, however, is appreciated.
National Center for Health Statistics
Charles J. Rothwell, M.S., Acting Director
Jennifer H. Madans, Ph.D., Associate Director for Science
Division of Health Care Statistics
Clarice Brown, M.S., Director