Trends in Inpatient Hospital Deaths: National Hospital Discharge Survey, 2000–2010
- Key findings
- How have hospital deaths changed from 2000 to 2010?
- What was the age distribution for patients who died in the hospital from 2000 to 2010?
- Has the inpatient hospital death rate decreased for all patients and for those with selected first-listed diagnoses?
- Did the length of stay for hospitalizations ending in death in 2010 differ from the length of stay for all hospitalizations?
- Summary
- Definitions
- Data source and methods
- About the authors
- Suggested citation
NCHS Data Brief No. 118, March 2013
PDF Version (657 KB)
Margaret Jean Hall, Ph.D.; Shaleah Levant, M.P.H.; and Carol J. DeFrances, Ph.D.
Key findings
Data from the National Hospital Discharge Survey, 2000–2010
- The number of inpatient hospital deaths decreased 8%, from 776,000 in 2000 to 715,000 in 2010, while the number of total hospitalizations increased 11%.
- In 2000, 2005, and 2010, about one-quarter of inpatient hospital deaths were for patients aged 85 and over.
- Hospital death rates declined overall from 2000 to 2010 but increased 17% for septicemia.
- Patients who died in the hospital had longer hospital stays than all patients. In 2010, those who died stayed an average of 7.9 days compared with 4.8 days for all patients.
In 2000, there were 2.4 million deaths in the United States, and in 2010 there were 2.5 million (1,2). In both years, about one-third of these deaths occurred in short-stay, general hospitals (3), despite research that found that most Americans prefer to die in their own homes (4–6). This report presents National Hospital Discharge Survey (NHDS) data from 2000 through 2010 on patients who died during hospitalization.
Keywords: inpatient hospital utilization, hospital mortality rate
How have hospital deaths changed from 2000 to 2010?
- The number of inpatient hospital deaths decreased 8% from 776,000 in 2000 to 715,000 in 2010 (Figure 1). At the same time, total hospitalizations increased 11%, from 31.7 million in 2000 to 35.1 million in 2010 (data not shown).
- Female inpatient hospital deaths decreased from 411,000 in 2000 to 364,000 in 2010. Male inpatient deaths did not change significantly during this time.
Figure 1. Inpatient hospital deaths: United States, 2000–2010
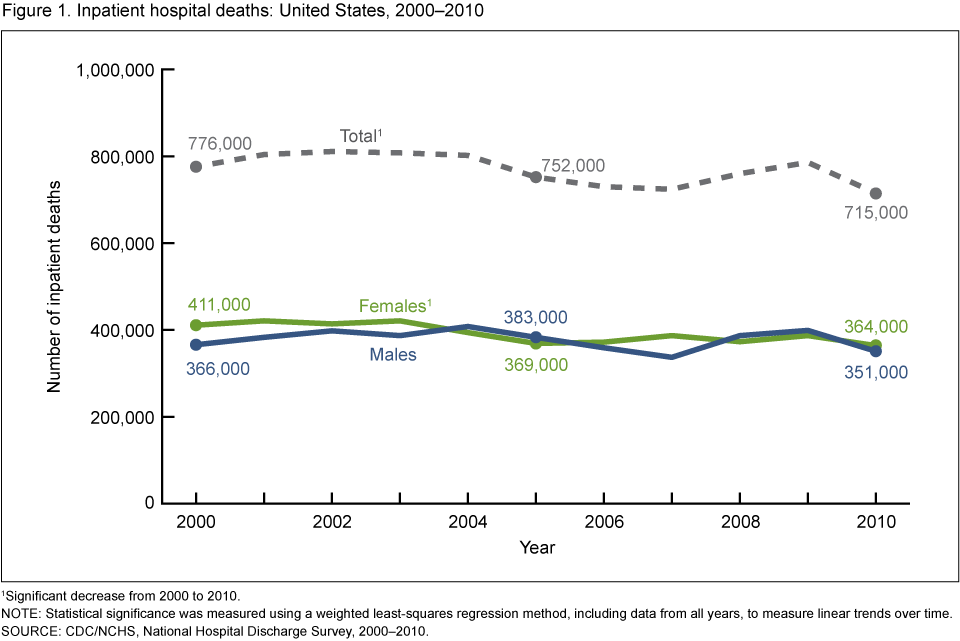
1Significant decrease from 2000 to 2010.
NOTE: Statistical significance was measured using a weighted least-squares regression method, including data from all years, to measure linear trends over time.
SOURCE: CDC/NCHS, National Hospital Discharge Survey, 2000–2010.
What was the age distribution for patients who died in the hospital from 2000 to 2010?
- In 2000, 2005, and 2010, about 75% of the inpatients who died in the hospital were aged 65 and over (Figure 2).
- In both 2000 and 2005, about 25% of the hospital deaths were among patients aged 85 and over, and in 2010 this number rose to 27%.
- The percentage of hospital deaths for those under age 65 increased 9%, from 24% in 2000 to 27% in 2010, while the proportion of inpatient hospital deaths for those aged 65 and over decreased 3%, from 76% in 2000 to 73% in 2010.
- The average age of patients who died during their hospital stay was 72–73 years throughout the period from 2000 to 2010.
Figure 2. Inpatient hospital deaths, by age: United States, 2000, 2005, and 2010
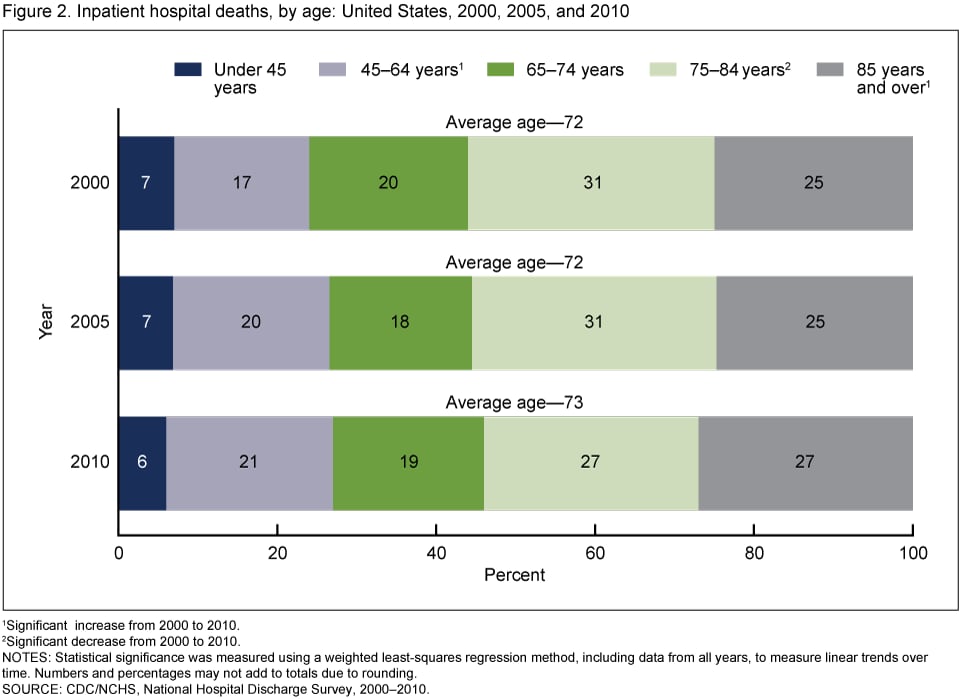
1Significant increase from 2000 to 2010.
2Significant decrease from 2000 to 2010.
NOTES: Statistical significance was measured using a weighted least-squares regression method, including data from all years, to measure linear trends over time. Numbers and percentages may not add to totals due to rounding.
SOURCE: CDC/NCHS, National Hospital Discharge Survey, 2000–2010.
Has the inpatient hospital death rate decreased for all patients and for those with selected first-listed diagnoses?
- In 2000, 2.5 of every 100 inpatients died in the hospital, and this proportion decreased to 2.0 of every 100 in 2010 (see Table).
Table. Inpatient hospital death rates, by first-listed diagnosis: United States, 2000, 2005, and 2010
| First-listed diagnosis | 2000 | 2005 | 2010 | Percent change1 |
|---|---|---|---|---|
| Rate per 100 persons hospitalized for diagnosis | ||||
| Total | 2.5 | 2.2 | 2.0 | -20 |
| Respiratory failure | 25.3 | 19.3 | 16.5 | -35 |
| Pneumonitis due to solids and liquids | 17.4 | 15.2 | 13.6 | -22 |
| Septicemia | 13.9 | 19.3 | 16.3 | +17 |
| Kidney disease | 9.9 | 6.5 | 3.5 | -65 |
| Cancer | 8.1 | 6.8 | 4.4 | -46 |
| Stroke | 6.4 | 6.5 | 4.7 | -27 |
| Pneumonia | 4.9 | 3.3 | 3.3 | -33 |
| Heart disease | 3.7 | 2.8 | 3.1 | -16 |
1Percent change for total and each diagnosis is significant change from 2000 to 2010.
NOTES: Statistical significance was measured using a weighted least-squares regression method, including data from all years, to measure linear trends over time. The percentage of total deaths for the diagnoses shown in this table was 66% in 2000 and 2005, and 70% in 2010.
SOURCE: CDC/NCHS, National Hospital Discharge Survey, 2000-2010.
- Patients with certain first-listed diagnoses had relatively high hospital death rates, but these rates decreased over the period from 2000 to 2010. Hospital death rates decreased for patients hospitalized for respiratory failure by 35%, for pneumonitis due to solids and liquids by 22%, for kidney disease by 65%, for cancer by 46%, for stroke by 27%, for pneumonia by 33%, and for heart disease by 16%.
- Unlike the above-listed hospital death rates, the septicemia hospital death rate increased 17% from 2000 to 2010. The number of inpatients who died in the hospital with a first-listed diagnosis of septicemia also increased—it tripled from 45,000 in 2000 to 132,000 in 2010 (data not shown).
- The first-listed diagnoses discussed above and shown in the Table account for 66% of total hospital deaths in 2000 and 2005, and for 70% in 2010.
Did the length of stay for hospitalizations ending in death in 2010 differ from the length of stay for all hospitalizations?
- Inpatients who died in the hospital stayed an average of 7.9 days in 2010, compared with an average of 4.8 days for all inpatients (Figure 3).
- Although 45% of those who died in the hospital stayed from 1–3 days, 57% of all inpatients had stays that were this short. Over one-quarter of the patients who died in the hospital stayed 10 days or more, compared with 10% of all inpatients.
Figure 3. Hospitalizations ending in death and all hospitalizations, by length of stay: United States, 2010
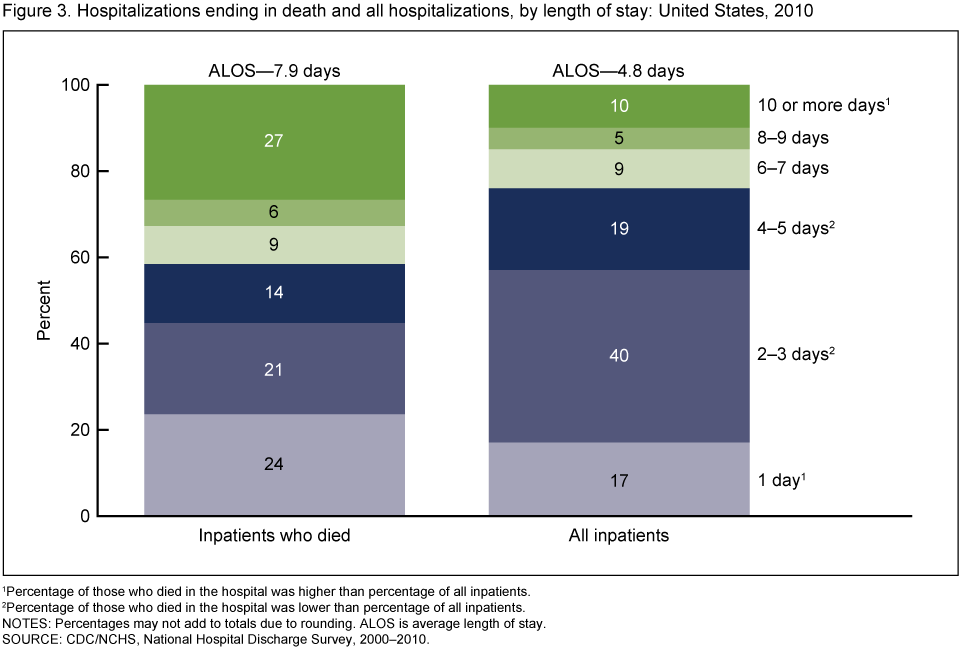
1Percentage of those who died in the hospital was higher than percentage of all inpatients.
2Percentage of those who died in the hospital was lower than percentage of all inpatients.
NOTES: Percentages may not add to totals due to rounding. ALOS is average length of stay.
SOURCE: CDC/NCHS, National Hospital Discharge Survey, 2000–2010.
Summary
The number of patients who died in the hospital in the years 2000–2010 decreased, as did the rate of hospitalizations ending in death, but there were still over 700,000 patients who died in the hospital in 2010. One-quarter of the patients who died in the hospital were aged 85 and over. Hospital death rates declined from 2000 to 2010 for selected first-listed diagnoses with the highest death rates in 2000, except for the septicemia death rate, which increased. Patients who died in the hospital had longer average hospital stays than all patients.
Definitions
First-listed diagnosis: The principal diagnosis, considered to be the main cause or reason for the hospitalization. Diagnoses are coded according to the International Classification of Diseases, Ninth Revision, Clinical Modification (ICD–9–CM) coding system (7). The ICD–9–CM codes for the first-listed diagnoses included in this report are the following:
Heart disease—codes 391–392.0, 393–398, 402, 404, 410–416, and 420–429
Respiratory failure—codes 518.81 and 518.83–518.84
Septicemia—code 038
Cancer (malignant neoplasm)—codes 140–209.36, 209.70–209.75, 209.79, and 230–234
Stroke (cerebrovascular disease)—codes 430–438
Pneumonia—codes 480–486
Pneumonitis due to solids and liquids—code 507
Kidney disease—codes 580–589
Inpatient hospital death rate: The number of inpatients who died in the hospital divided by the total number of hospitalizations. For example, the death rate for septicemia is calculated by dividing the number of inpatients hospitalized for septicemia who died during their hospitalization by the total number of hospitalizations for septicemia. The rate is reported per 100 hospitalizations in this report but could also be reported as a percentage.
Data source and methods
Data are from NHDS, a national probability sample survey of discharges from nonfederal, noninstitutional, short-stay hospitals, or general hospitals in the United States conducted annually from 1965 through 2010 by the Centers for Disease Control and Prevention’s National Center for Health Statistics. Survey data on hospital discharges were obtained from the hospitals’ administrative data. It should be noted that if an individual is admitted to the hospital multiple times during the survey year, that individual will be counted more than once in NHDS.
Because of the complex multistage design of NHDS, the survey data must be inflated, or weighted, in order to produce national estimates. Estimates of inpatient care presented in this report exclude newborns. More details about the design of NHDS have been published elsewhere (8).
A weighted least-squares regression method (9), based on all 11 years of unrounded NHDS data from 2000 through 2010, was used to test for linear trends in Figures 1 and 2, and in the Table . A p value of 0.05 was used to indicate statistical significance. Figure 3 contains data from 2010.
Differences among subgroups were evaluated using unrounded numbers with two-tailed t tests using a p value of 0.05 as the level of significance. Calculation of rates, percentages, and percent changes were computed using unrounded numbers, so the results may differ from what would be obtained using the rounded figures in the text, figures, and tables.
All comparisons reported in the text were statistically significant unless otherwise indicated. Data analyses were performed using the statistical packages SAS version 9.2 (SAS Institute, Cary, N.C.) and SUDAAN version 10.0 (RTI International, Research Triangle Park, N.C.).
This is a study of inpatient hospital utilization of those who died, including the number, type, and length of stay for inpatients that did not live to be discharged. This study also explores how these factors have changed over time. These data are not a measure of the quality of hospital care. Fewer deaths in the inpatient hospital setting may be due to numerous factors, including more transfers to other settings, before patients die.
About the authors
Margaret Jean Hall, Shaleah Levant, and Carol J. DeFrances are with the Centers for Disease Control and Prevention’s National Center for Health Statistics, Division of Health Care Statistics.
References
- Minino AM, Arias E, Kochanek KD, et al. Deaths: Final data for 2000 [PDF – 7.9 MB]. National vital statistics reports; vol 50 no 15. Hyattsville, MD: National Center for Health Statistics. 2002.
- Murphy SL, Xu JQ, Kochanek KD. Deaths: Preliminary data for 2010. National vital statistics reports; vol 60 no 4. Hyattsville, MD: National Center for Health Statistics. 2012.
- National Center for Health Statistics. Unpublished data from annual National Hospital Discharge Survey data files, 2000 and 2010.
- National Center for Health Statistics. Health, United States, 2010: Chartbook with special feature on death and dying. Hyattsville, MD. 2011.
- Grunier A, Mor V, Weitzen S, Truchil R, Teno J, Roy J. Where people die: A multilevel approach to understanding influences on site of death in America. Med Care Res Rev 64(4):351–78. 2007.
- Tang ST. When death is imminent: Where terminally ill patients with cancer prefer to die and why. Cancer Nurs 26(3):245–51. 2003.
- CDC. International Classification of Diseases, Ninth Revision, Clinical Modification. 6th ed. 2006.
- Hall MJ, DeFrances CJ, Williams SN, et al. National Hospital Discharge Survey: 2007 summary [PDF – 403 KB]. National health statistics reports; no 29. Hyattsville, MD: National Center for Health Statistics. 2010.
- Gillum BS, Graves EJ, Kozak LJ. Trends in hospital utilization: United States, 1988–92 [PDF – 578 KB]. National Center for Health Statistics. Vital Health Stat 13(124). 1996.
Suggested citation
Hall MJ, Levant S, DeFrances CJ. Trends in inpatient hospital deaths: National Hospital Discharge Survey, 2000–2010. NCHS data brief, no 118. Hyattsville, MD: National Center for Health Statistics. 2013.
Copyright information
All material appearing in this report is in the public domain and may be reproduced or copied without permission; citation as to source, however, is appreciated.
National Center for Health Statistics
Edward J. Sondik, Ph.D., Director
Jennifer H. Madans, Ph.D., Associate Director for Science
Division of Health Care Statistics
Clarice Brown, M.S., Director