Prevalence of Obesity Among Older Adults in the United States, 2007–2010
- Key findings
- What was the prevalence of obesity among older adults in 2007–2010?
- Were there differences in the prevalence of obesity among older adults by race and ethnicity?
- Were there differences in the prevalence of obesity among older adults by educational attainment?
- Was there an increase in the prevalence of obesity among older adults between 1999 and 2010?
- Summary
- Definitions
- Data source and methods
- About the authors
- References
- Suggested citation
NCHS Data Brief No. 106, September 2012
PDF Version (563 KB)
Tala H.I. Fakhouri, Ph.D., M.P.H.; Cynthia L. Ogden, Ph.D., M.R.P.; Margaret D. Carroll, M.S.P.H.; Brian K. Kit, M.D., M.P.H.; and Katherine M. Flegal, Ph.D.
Key findings
Data from the National Health and Nutrition Examination Survey, 2007–2010
- More than one-third of older adults aged 65 and over were obese in 2007–2010.
- Obesity prevalence was higher among those aged 65‒74 compared with those aged 75 and over in both men and women.
- The prevalence of obesity in women aged 65–74 was higher than in women aged 75 and over in all racial and ethnic groups except non-Hispanic black women, where approximately one in two were obese among both age groups.
- Between 1999‒2002 and 2007‒2010, the prevalence of obesity among older men increased.
By 2050, the number of U.S. older adults, defined as persons aged 65 and over, is expected to more than double, rising from 40.2 million to 88.5 million (1). Both aging and obesity contribute to increased health care service use (2,3). Consequently, an increase in the proportion of older adults who are obese may compound health care spending. Given the demographic changes forecasted and the potential health care costs of obesity, it is important to track the prevalence of obesity among older adults (2,3). This report presents the most recent national estimates of obesity in older adults, by sex, age, race and ethnicity, and educational attainment, and examines changes in the prevalence of obesity between 1999 and 2010.
Keywords: National Health and Nutrition Examination Survey, elderly
What was the prevalence of obesity among older adults in 2007–2010?
About 35% of adults aged 65 and over were obese in 2007–2010, representing over 8 million adults aged 65‒74, and almost 5 million adults aged 75 and over (data not shown). There was no difference in obesity prevalence between men and women (Figure 1). The prevalence of obesity among those aged 75 and over (27.8%) was lower than prevalence among those aged 65–74 (40.8%). The lower prevalence among those aged 75 and over compared with those aged 65–74 was observed in both men and women.
Figure 1. Prevalence of obesity among adults aged 65 and over, by sex: United States, 2007–2010
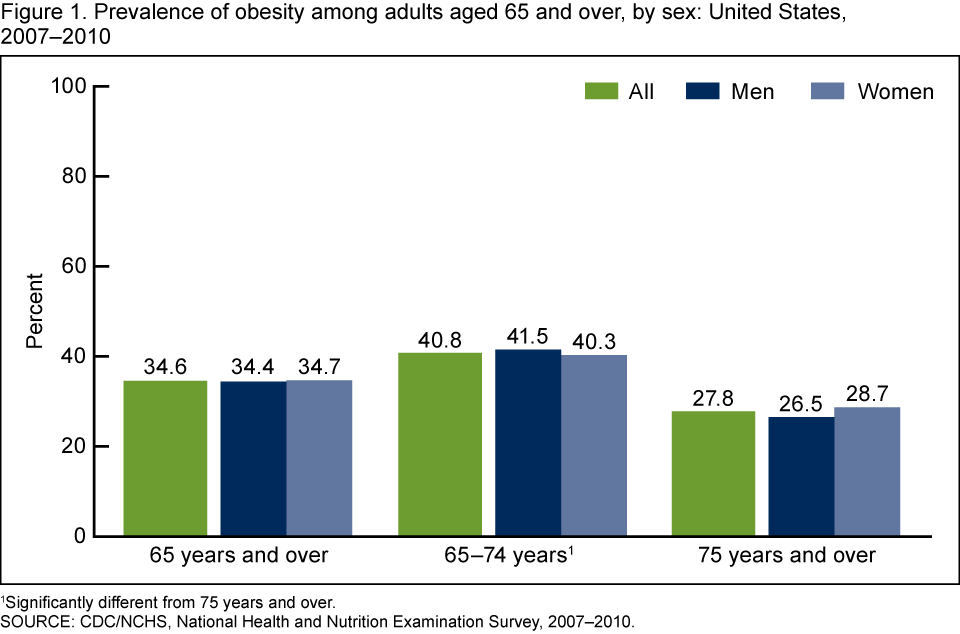
1Significantly different from 75 years and over.
SOURCE: CDC/NCHS, National Health and Nutrition Examination Survey, 2007‒2010.
Were there differences in the prevalence of obesity among older adults by race and ethnicity?
There were no significant differences in obesity prevalence by race and ethnicity among men (Figure 2). However, the prevalence of obesity differed by race and ethnicity among women. Among women aged 65‒74, 53.9% of non-Hispanic black women were obese, compared with 38.9% of non-Hispanic white women, but was not significantly different from Hispanic women (46.6%). Among women aged 75 and over, 49.4% of non-Hispanic black women were obese, 30.2% of Hispanic women were obese, and 27.5% of non-Hispanic white women were obese.
Figure 2. Prevalence of obesity among adults aged 65 and over, by sex and race and ethnicity: United States, 2007–2010
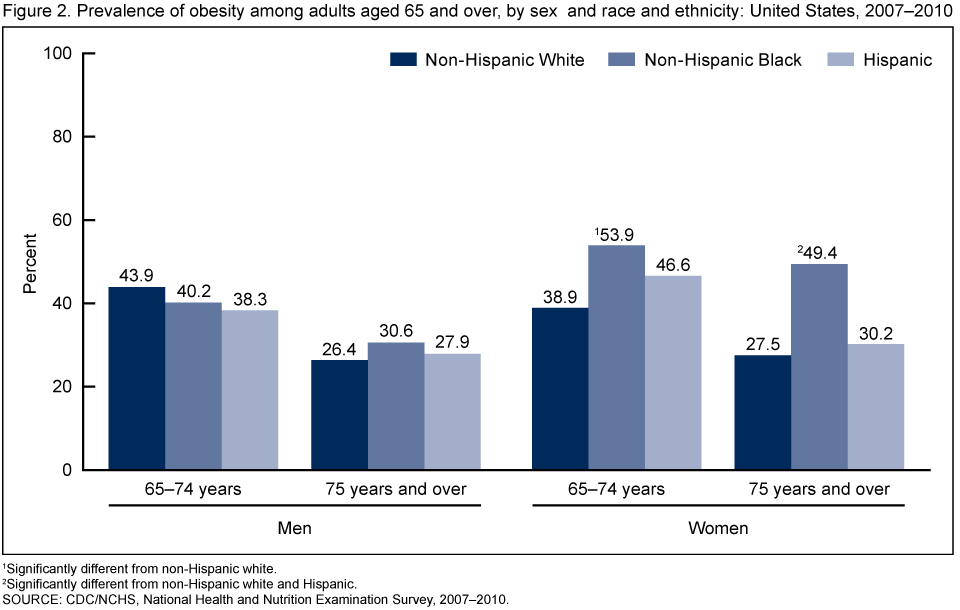
1Significantly different from non-Hispanic white.
2Significantly different from non-Hispanic white and Hispanic.
SOURCE: CDC/NCHS, National Health and Nutrition Examination Survey, 2007‒2010.
Were there differences in the prevalence of obesity among older adults by educational attainment?
Although there were no significant linear trends in the prevalence of obesity among men aged 65–74 by educational attainment, the prevalence of obesity was higher among those with some college compared with those with a college degree (Figure 3). There was a linear trend among women aged 65‒74: There was a decrease in obesity prevalence with increasing education. Almost one-half of those with less than a high school education were obese compared with about one-third of those with a college degree. No linear trends in obesity prevalence by educational attainment were observed in men or women aged 75 and over.
Figure 3. Prevalence of obesity among adults aged 65 and over, by sex and education: United States, 2007–2010
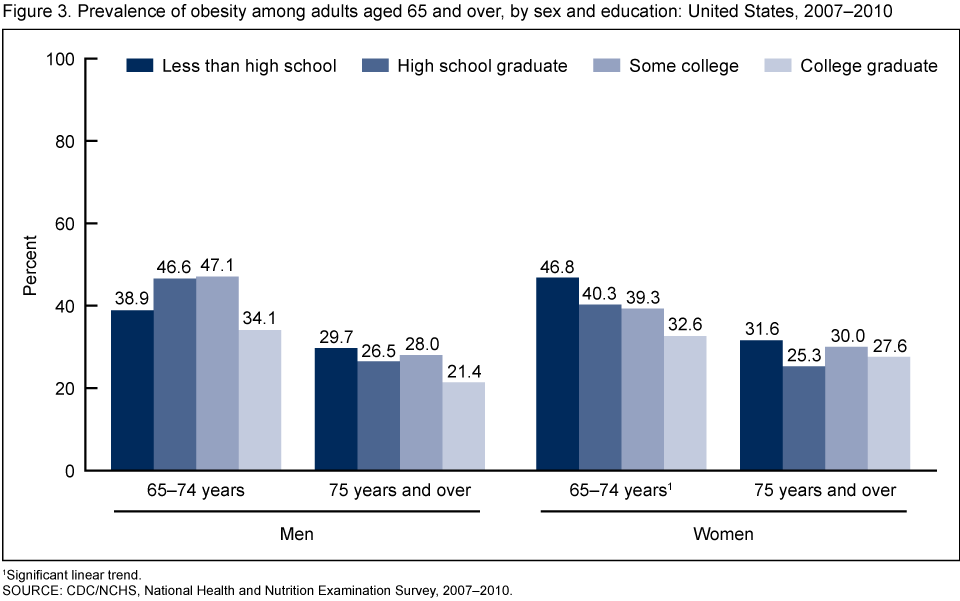
1Significant linear trend.
SOURCE: CDC/NCHS, National Health and Nutrition Examination Survey, 2007‒2010.
Was there an increase in the prevalence of obesity among older adults between 1999 and 2010?
Over the time periods 1999–2002, 2003–2006, and 2007–2010, there was a linear increase in the prevalence of obesity among older men in both age groups (Figure 4). The prevalence of obesity among men aged 65‒74 increased from about 31.6% in 1999–2002 to 41.5% in 2007–2010. Among men aged 75 and over, the prevalence of obesity increased from 17.7% in 1999‒2002 to 26.5% in 2007–2010. Among women, the change over the same time period was not statistically significant for either age group.
Figure 4. Trends in the prevalence of obesity among adults aged 65 and over, by sex: United States, 1999–2010

1Significant linear trend.
SOURCE: CDC/NCHS, National Health and Nutrition Examination Survey, 2007‒2010.
Summary
In 2007–2010, more than one-third of older adults were obese, which corresponds to approximately 13 million obese older adults. Obesity prevalence among women aged 65–74 was higher than in women aged 75 and over in all racial and ethnic groups except non-Hispanic black women.
The overall prevalence of obesity among older adults and the racial and ethnic patterns are similar to estimates previously reported for the entire adult population (4). Among older men, there were no differences between racial and ethnic groups in obesity prevalence. However, among older women, non-Hispanic black women had higher obesity prevalence than older, non-Hispanic white women. Although these same patterns have been shown among middle-aged women (4), the values are significantly lower among the oldest adults, those aged 75 and over.
Socioeconomic disparities in obesity prevalence, as measured by educational attainment, and which have been observed in women aged 20 and over, were also found among those aged 65–74, but the relationship diminished and even disappeared in those aged 75 and over. Among all women there was a significant trend in lower obesity prevalence among those with the highest education (5). This was also true for women aged 65–74, but among women aged 75 and over, no difference was observed in obesity prevalence by educational attainment.
As Americans live longer and the age distribution shifts so that there are more older adults, the number of obese older adults could grow, even without an increase in obesity prevalence (1).
Definitions
Older adults: Persons aged 65 and over. This definition is adopted based on eligibility for Medicare benefits (6).
Obesity: Body mass index (BMI) is calculated as weight in kilograms divided by height in meters squared, rounded to one decimal place. Obesity in adults is defined as having a BMI greater than or equal to 30 (7).
Education: Level of education attained is classified based on self-report as less than high school, completed high school or general equivalency diploma (GED), some college, and college graduate.
Data source and methods
National Health and Nutrition Examination Survey (NHANES) data were used for these analyses. NHANES is a survey conducted by the Centers for Disease Control and Prevention’s (CDC) National Center for Health Statistics (NCHS) to monitor the health and nutritional status of the civilian noninstitutionalized U.S. population. The survey combines both an in-home interview and a standardized physical examination at a mobile examination center. The weight and height data for this report were measured in the mobile examination center.
NHANES uses a complex, multistage, probability sampling design to select participants. The sample design includes oversampling to obtain reliable estimates of health and nutritional measures for population subgroups. NHANES public-use data files are released in 2-year cycles. To have sufficient sample sizes for estimates among adults aged 75 and over, two 2-year cycles (2007–2008 and 2009–2010) were combined for this report. In 2007–2008 and 2009–2010, non-Hispanic black and Hispanic persons, persons with low income, and those aged 60 and over were oversampled to obtain reliable estimates. Data were analyzed using sample weights to account for differential probabilities of selection, nonresponse, and noncoverage. The standard errors of the percentages were estimated using Taylor Series Linearization, a method that incorporates the sample design.
Estimates of the number of obese older adults were calculated using the average Current Population Survey totals for 2007–2008 and 2009–2010, which are available on the NHANES website.
Mean estimates for adults were age adjusted to the 2000 U.S. standard population using two age groups: 64–74 and 75 and over. Differences between groups were evaluated using a t statistic at the p < 0.05 significance level with the appropriate degrees of freedom. All differences reported are statistically significant. To test for linear trends between education groups and over time, the null hypothesis of nonlinear trend was examined using orthogonal polynomials. Statistical analyses were conducted using the SAS System for Windows (release 9.2; SAS Institute Inc, Cary, N.C.) and SUDAAN (release 10.0; RTI International, Research Triangle Park, N.C.).
About the authors
Tala H.I. Fakhouri is with the Epidemic Intelligence Service, Office of Surveillance, Epidemiology, and Laboratory Services, and the Analysis Branch, Division of Health and Nutrition Examination Surveys (DHANES), NCHS, CDC. Cynthia L. Ogden, Margaret D. Carroll, and Brian K. Kit are with NCHS’ DHANES. Katherine M. Flegal is with NCHS’ Office of the Director.
References
- Vincent GK, Velkoff VA. The next four decades, the older population in the United States: 2010 to 2050 [PDF – 618 KB]. Current Population Reports P25–1138. Washington, DC: U.S. Census Bureau. 2010.
- Decaria JE, Sharp C, Petrella RJ. Scoping review report: Obesity in older adults. Int J Obes (Lond) 36(9): 1141–50. 2012.
- Lakdawalla DN, Goldman DP, Shang B. The health and cost consequences of obesity among the future elderly. Health Aff (Millwood) 24 Suppl 2:W5R30–41. 2005.
- Flegal KM, Carroll MD, Kit BK, Ogden CL. Prevalence of obesity and trends in the distribution of body mass index among US adults, 1999–2010. JAMA 307(5):491–7. 2012.
- Ogden CL, Lamb MM, Carroll MD, Flegal KM. Obesity and socioeconomic status in adults: United States, 2005–2008. NCHS data brief, no 50. 2010.
- U.S. Department of Health and Human Services. Medicare Eligibility Tool. 2012.
- National Institutes of Health. Clinical guidelines on the identification, evaluation, and treatment of overweight and obesity in adults [PDF 1.25 MB]. The Evidence Report. Obes Res 6 Suppl 2:51S–209S. 1998.
Suggested citation
Fakhouri TH, Ogden CL, Carroll MD, et al. Prevalence of obesity among older adults in the United States, 2007-2010. NCHS data brief, no 106. Hyattsville, MD: National Center for Health Statistics. 2012.
Copyright information
All material appearing in this report is in the public domain and may be reproduced or copied without permission; citation as to source, however, is appreciated.
National Center for Health Statistics
Edward J. Sondik, Ph.D., Director
Jennifer H. Madans, Ph.D., Associate Director for Science
Division of Health and Nutrition Examination Surveys
Clifford L. Johnson, M.S.P.H., Director