Oral Health Disparities as Determined by Selected Healthy People 2020 Oral Health Objectives for the United States, 2009–2010
- Key findings
- Untreated dental caries varied by race and ethnicity and poverty level among children and adolescents.
- Prevalence of dental sealants varied by poverty status among children, and varied by race and ethnicity among adolescents.
- Tooth retention varied by race and ethnicity and poverty level among adults aged 25–64.
- Edentulism was more prevalent among adults aged 65–74 living at or below the federal poverty level, compared with those living above the poverty level.
- Summary
- Definitions
- Data source and methods
- About the authors
- References
- Suggested citation
NCHS Data Brief No. 104, August 2012
PDF Version (689 KB)
Bruce A. Dye, D.D.S., M.P.H.; Xianfen Li, M.S.; and Gina Thornton-Evans, D.D.S., M.P.H.
Key findings
Data from the National Health and Nutrition Examination Survey, 2009–2010
- Approximately one in four children aged 3–5 and 6–9 years living in poverty had untreated dental caries.
- Dental sealants were more prevalent among non-Hispanic white adolescents (56%) compared with non-Hispanic black adolescents (32%) aged 13–15.
- Among adults aged 45–64, 29% had a full set of permanent teeth (excluding third molars); this includes 19% of Hispanic adults and 11% of non-Hispanic black adults compared with nearly 35% of non-Hispanic white adults.
- More than one-third of older adults aged 65–74 living below the federal poverty level (34%) were edentulous, whereas approximately one-eighth of older adults living above the poverty level (13%) were edentulous.
The Healthy People 2020 initiative contains over 1,200 objectives that serve as a roadmap for tracking the nation’s health (1). Oral health is 1 of 42 Healthy People topic areas comprising 33 objectives ranging from dental caries and periodontal disease, to access to preventive dental services and program infrastructure. One important activity of Healthy People is to monitor health disparities. Influential sociodemographic indicators for oral health disparities in the United States include poverty status and race and ethnicity (2). This report focuses on key Healthy People objectives covering select age groups by race and ethnicity and poverty status from 2009 to 2010.
Keywords: dental caries, dental sealants, edentulism, National Health and Nutrition Examination Survey
Untreated dental caries varied by race and ethnicity and poverty level among children and adolescents.
Figure 1. Prevalence of untreated dental caries among children and adolescents, by age, race and ethnicity, and poverty level: United States, 2009-2010.

1 Reference group.
2 p < 0.05.
SOURCE: CDC/NCHS, National Health and Nutrition Examination Survey, 2009–2010.
In 2009–2010, 14% of children aged 3–5 years had untreated dental caries (Figure 1). Among children aged 6–9 years, 17% had untreated dental caries, and among adolescents aged 13–15, 11% had untreated dental caries. Among children aged 3–5 years, the prevalence of untreated caries was significantly higher for non-Hispanic black children (19%) compared with non-Hispanic white children (11%). Untreated caries was nearly twice as high for Hispanic children (26%) compared with non-Hispanic white children (14%) aged 6–9 years, and was more than twice as high for non-Hispanic black adolescents (25%) compared with non-Hispanic white adolescents (9%) aged 13–15. For children aged 3–5 and 6–9 years living at or below 100% of the federal poverty level, untreated dental caries was significantly higher compared with children living above the poverty level. For adolescents, the difference in the prevalence of untreated caries was not statistically significant between the two income groups.
Prevalence of dental sealants varied by poverty status among children, and varied by race and ethnicity among adolescents.
Thirty-two percent of children aged 6–9 years and 51% of adolescents aged 13–15 had at least one dental sealant on a permanent tooth in 2009–2010 (Figure 2). Dental sealant prevalence was lower among children living at or below 100% of the federal poverty level (26%) compared with children living above the poverty level (34%). A similar pattern was found among adolescents aged 13–15, but the difference was not statistically significant. Dental sealant prevalence was significantly lower for non-Hispanic black adolescents (32%) compared with non-Hispanic white adolescents (56%), among those aged 13–15.
Figure 2. Prevalence of dental sealants among children and adolescents, by age, race and ethnicity, and poverty level: United States, 2009–2010.
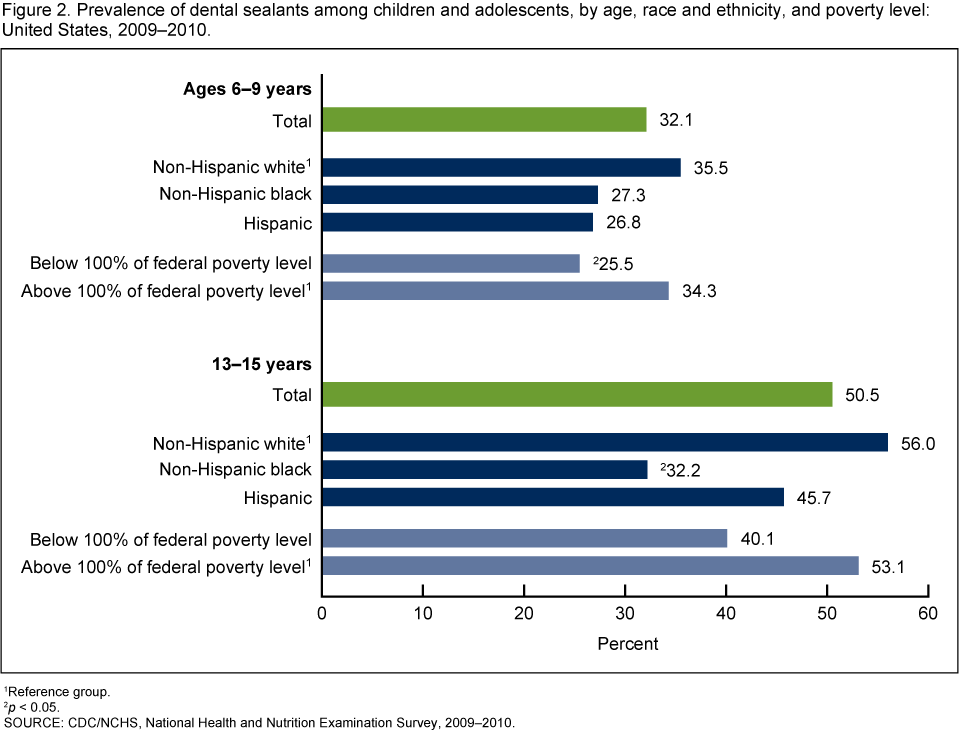
1 Reference group.
2 p < 0.05.
SOURCE: CDC/NCHS, National Health and Nutrition Examination Survey, 2009–2010.
Tooth retention varied by race and ethnicity and poverty level among adults aged 25–64.
Fifty-three percent of adults aged 25–44 and 29% of adults aged 45–64 had a full set of permanent teeth (excluding third molars) (Figure 3). Among adults aged 25–44, tooth retention was lower for Hispanic (46%) and non-Hispanic black (43%) adults, compared with non-Hispanic white adults (58%). For adults living at 100% of the federal poverty level or lower, 42% had not lost a permanent tooth, whereas for adults living above the poverty level, approximately 55% had retained all of their permanent teeth. Complete tooth retention was more prevalent among non-Hispanic white adults (35%) aged 45–64 compared with non-Hispanic black (11%) and Hispanic adults (19%). Complete tooth retention was also higher for adults aged 45–64 living above the poverty level (32%) compared with those living at or below the poverty level (15%).
Figure 3. Prevalence of complete tooth retention among adults, by age, race and ethnicity, and poverty level: United States, 2009–2010.
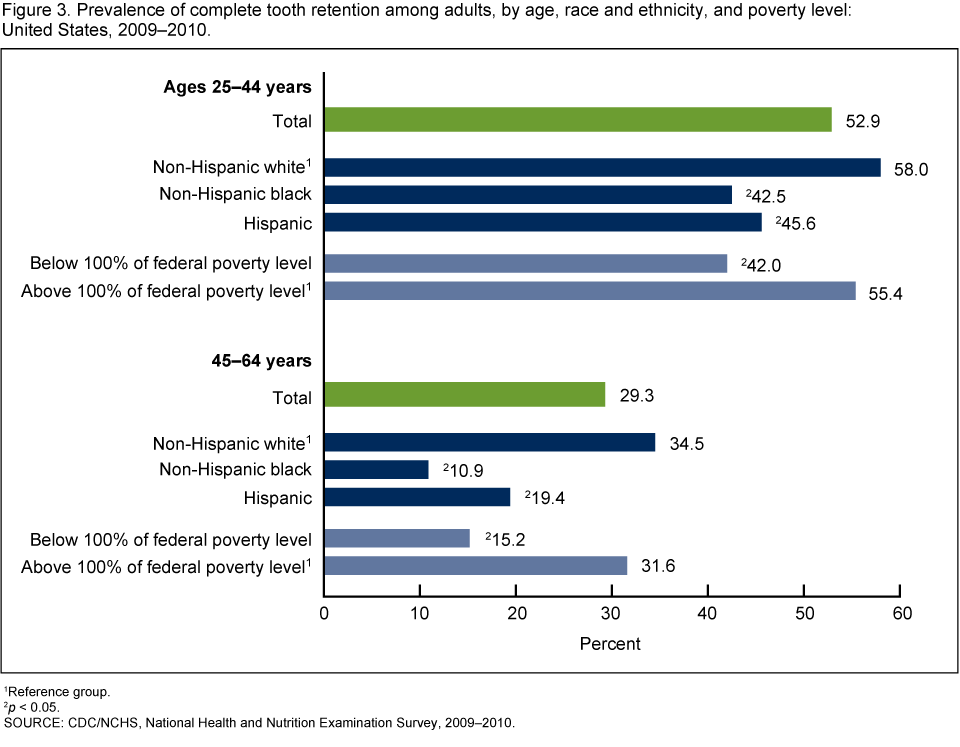
1 Reference group.
2 p < 0.05.
SOURCE: CDC/NCHS, National Health and Nutrition Examination Survey, 2009–2010.
Edentulism was more prevalent among adults aged 65–74 living at or below the federal poverty level, compared with those living above the poverty level.
Fifteen percent of adults aged 65–74 and 22% of adults aged 75 and over were edentulous in 2009–2010 (Figure 4). The prevalence of complete tooth loss was more than twice as high for adults aged 65–74 living at or below 100% of the federal poverty level (34%), compared with those living above the poverty level (13%). For adults aged 75 and over, there was no significant difference in the prevalence of edentulism by poverty status (24% for those living at or below 100% of the poverty level, and 21% for those living above the poverty level). Differences observed by race and ethnicity status among adults aged 65–74 and among those aged 75 and over also were not statistically significant.
Figure 4. Prevalence of edentulism among older adults, by age, race and ethnicity, and poverty level: United States, 2009–2010.
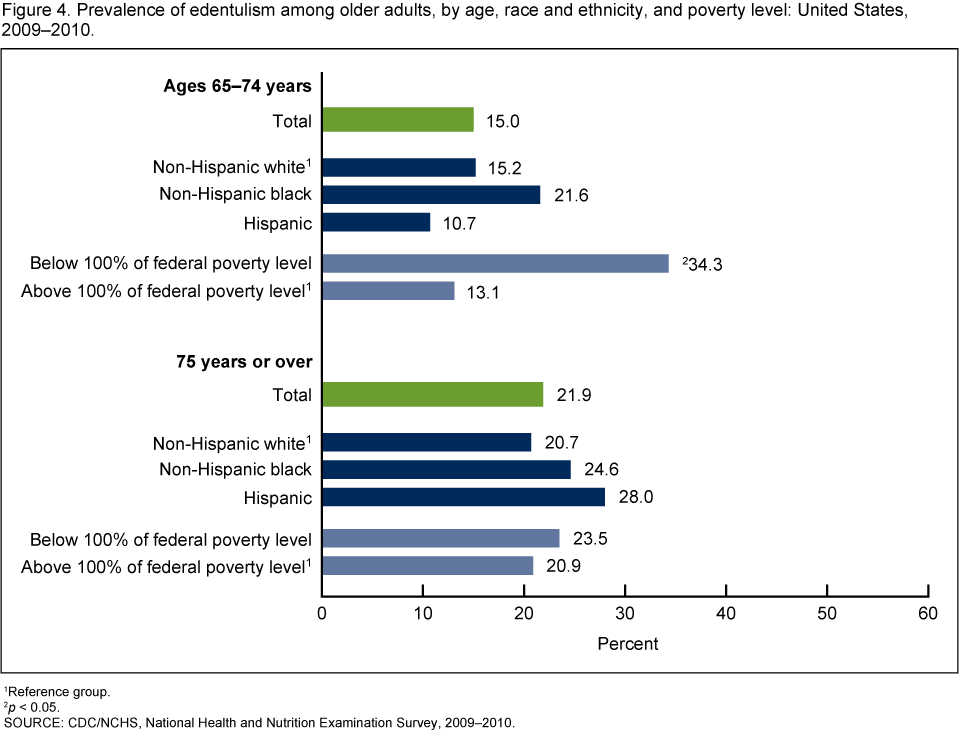
1 Reference group.
2 p < 0.05.
SOURCE: CDC/NCHS, National Health and Nutrition Examination Survey, 2009–2010.
Summary
More than a decade ago, the Surgeon General’s report on oral health spoke to the importance of engaging in activities aimed at identifying, monitoring, and reducing oral health disparities (2). Prior reports have shown that key social determinants affecting oral health are race and ethnicity and lower levels of income (1–4). Some of these reports use Healthy People objectives to describe the presence of oral health disparities within the U.S. population (3,4). Within the framework of Healthy People, oral health has evolved to include six objectives that monitor children and adolescents, seven objectives that monitor adults, eight objectives that focus on improving access to preventive dental services, seven objectives that monitor the use of interventions, and five objectives that relate to surveillance systems and program infrastructure (1). Finally, oral health’s overall importance to health is exemplified by the subject’s recognition as one of the top 12 leading health indicators for Healthy People 2020.
Findings from this report indicate that racial and ethnic disparities were prevalent for a variety of oral health indicators across various age groups. For children and adolescents, the prevalence of untreated dental caries varied significantly by race and ethnicity. The prevalence of dental sealants was significantly lower for non-Hispanic black adolescents compared with non-Hispanic white adolescents aged 13–15. Among adults aged 45–64, tooth retention was lower for Hispanic and non-Hispanic black adults compared with non-Hispanic white adults.
Disparities based on poverty status also existed for many oral health indicators. Among children aged 3–5 and 6–9 years, untreated caries was significantly higher for those living at or below the federal poverty level compared with those living above the poverty threshold. Conversely, dental sealants were more prevalent among children aged 6–9 years living above the poverty level compared with children living in lower-income families. Prevalence of complete tooth retention was significantly higher among adults aged 45–64 living above the poverty level compared with those living in poverty. Complete tooth loss was significantly higher among adults aged 65–74 living at or below the poverty level compared with those with higher incomes.
Definitions
Untreated dental caries: Dental cavities that have not received appropriate treatment.
Dental sealants: Plastic-like coatings that are applied to the chewing surfaces of back teeth. The applied sealant resin bonds into the grooves of teeth to form a protective physical barrier.
Tooth retention: Having all natural permanent teeth present, excluding third molars.
Edentulism: Having all natural permanent teeth missing, including third molars.
Poverty status or percentage of federal poverty level: An index based on the ratio of family income to poverty. The Department of Health and Human Services’ poverty guidelines were used as the poverty measure to calculate this index. Additional information can be found on the HHS website.
Data source and methods
Data from the Nationl Health and Nutrition Examination Survey (NHANES) were used to produce this report. NHANES is a cross-sectional survey designed to monitor the health and nutritional status of the civilian noninstitutionalized U.S. population. The survey consists of interviews conducted in participants’ homes and standardized physical examinations in mobile examination centers. The sample design includes oversampling to obtain reliable estimates of health and nutritional measures for population subgroups. In 2009–2010, oversampling included non-Hispanic black and Hispanic persons aged 60 and over and low-income white persons. Additional information can be found on the NHANES website.
From 2009 to 2010, the NHANES oral health assessment was conducted in mobile examination centers by trained dental hygienists. The assessment included a tooth count to identify the presence or absence of permanent or primary teeth, including retained dental root tips and dental implants. The oral health screening also included a person-based assessment for dental caries, restorations, and sealants on study participants aged 3–19 years. This evaluation was a fast and simple process by which an examiner visually inspected the oral cavity to detect the presence or absence of specific oral conditions. Overall, the data reliability analyses conducted for 2009–2010 indicated that examiner performance was similar to prior survey periods since the NHANES continuous survey began in 1999. Additional information regarding 2009–2010 oral health screening and quality assurance issues are published elsewhere (5).
The age groups used in this report approximate the age groups used for the Healthy People 2020 oral health objectives. Key age groups include 3–5, 6–9, and 13–15 years for children and adolescents, and ages 45–64 and 65–74 for adults. Moreover, the Healthy People 2020 objective focusing on tooth retention is presented differently in this report because 2009–2010 NHANES data did not provide a determination of reasons for tooth loss. Consequently, the prevalence of complete tooth retention is shown, not the original objective highlighting no tooth loss due to dental disease. Additional information pertaining to Healthy People 2020 is available.
Population estimates and standard errors were calculated in SAS-callable SUDAAN software (release 10.0; RTI International, Research Triangle Park, N.C.) Sample weights to account for differing probabilities of selection, nonresponse, and noncoverage were used for analysis. The standard errors of the percentages were estimated using Taylor series linearization, to take into account the complex sampling design. Differences between groups were evaluated using a t statistic at the p < 0.05 significance level. Tests of trends were done using the p < 0.05 significance level. All results presented in the figures have a relative standard error less than 30%. All differences discussed are statistically significant unless otherwise indicated. Calculated estimates were not age adjusted, and no adjustments were made for multiple comparisons.
About the authors
Bruce A. Dye is with the Centers for Disease Control and Prevention’s (CDC) National Center for Health Statistics (NCHS), Division of Health and Nutrition Examination Surveys. Xianfen Li is with the Harris Corporation under a contract with NCHS. Gina Thornton-Evans is with the CDC’s National Center for Chronic Disease Prevention and Health Promotion, Division of Oral Health.
References
- U.S. Department of Health and Human Services. Healthy People 2020 [online]. 2010. [Accessed 2012 June 1].
- U.S. Department of Health and Human Services (HHS). Oral Health in America: A report of the Surgeon General [PDF – 4.7 MBN]. Rockville, MD: HHS, National Institute of Dental and Craniofacial Research, National Institutes of Health. 2000.
- Dye BA, Tan S, Smith V, et al. Trends in oral health status—United States, 1988–1994 and 1999–2004 [PDF – 1.84 MB]. Vital Health Stat 11(248). 2007.
- Dye BA, Thornton-Evans G. Trends in oral health by poverty status as measured by Healthy People 2010 objectives. Public Health Rep 125(6):817–30. 2010.
- Dye BA, Li X, Lewis BG, Iafolla T, Beltran-Aguilar ED, Eke P. Overview and quality assurance for the oral health component of the National Health and Nutrition Examination Survey (NHANES), 2009–2010 [forthcoming]. 2012.
Suggested citation
Dye BA, Li X, Thornton-Evans G. Oral health disparities as determined by selected Healthy People 2020 oral health objectives for the United States, 2009–2010. NCHS data brief, no 104. Hyattsville, MD: National Center for Health Statistics. 2012.
Copyright information
All material appearing in this report is in the public domain and may be reproduced or copied without permission; citation as to source, however, is appreciated.
National Center for Health Statistics
Edward J. Sondik, Ph.D., Director
Jennifer H. Madans, Ph.D., Associate Director for Science
Division of Health and Nutritional Examination Surveys
Clifford L. Johnson, M.S.P.H., Director