Deaths: Final Data for 2004
by Arialdi M. Miniño, M.P.H.; Melonie Heron, Ph.D.; Sherry L. Murphy, B.S.; and Kenneth D. Kochanek, M.A. Division of Vital Statistics
This report from the Centers for Disease Control and Prevention’s (CDC) National Center for Health Statistics (NCHS) provides selected, key findings for the 2004 final mortality data for the United States and announces the release of final national mortality data for 2004. The findings come from information reported on death certificates completed by funeral directors, attending physicians, medical examiners, and coroners.
Key findings from this report, as illustrated in Tables 1-4 [PDF – 112 KB] and Figures 1-3, follow:
Mortality experience in 2004
- In 2004, a total of 2,397,615 deaths occurred in the United States (Tables 1 and 2).
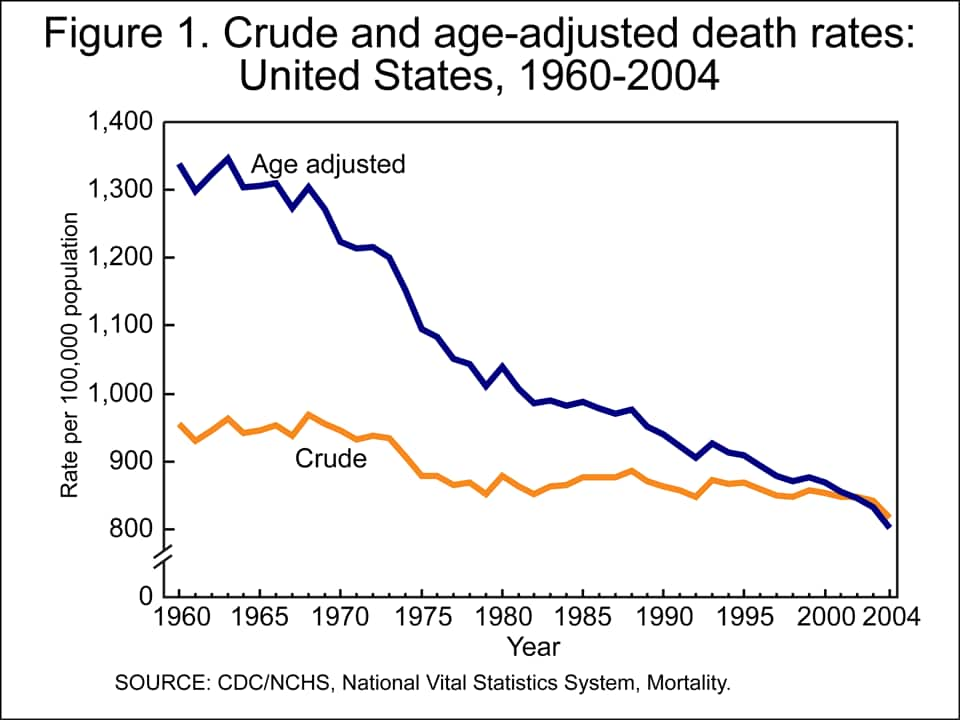
- The age-adjusted death rate (Tables 1 and 2), which accounts for changes in the age distribution of the population, reached a record low of 800.8 per 100,000 U.S. standard population. The crude death rate for 2004 was 816.5 per 100,000 population.
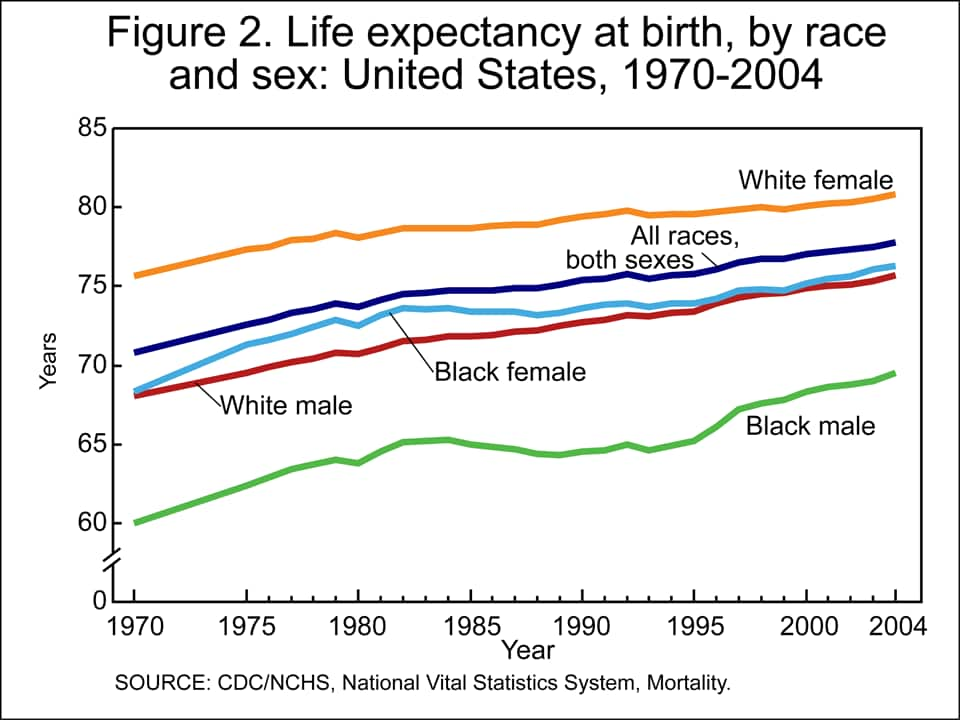
- Life expectancy at birth for the U.S. population in 2004 reached a record high of 77.8 years (Table 1 [PDF – 112 KB]).
- The 15 leading causes of death in 2004 (Table 2 [PDF – 112 KB]) were:
- Diseases of heart (heart disease);
- Malignant neoplasms (cancer);
- Cerebrovascular diseases (stroke);
- Chronic lower respiratory diseases;
- Accidents (unintentional injuries);
- Diabetes mellitus;
- Alzheimer’s disease;
- Influenza and pneumonia;
- Nephritis, nephrotic syndrome and nephrosis (kidney disease);
- Septicemia;
- Intentional self-harm (suicide);
- Chronic liver disease and cirrhosis;
- Essential (primary) hypertension and hypertensive renal disease (hypertension);
- Parkinson’s disease; and
- Assault (homicide)
- The infant mortality rate for 2004 was 6.79 infant deaths per 1,000 live births (Tables 1 and 3).
- The 10 leading causes of infant mortality for 2004 (Table 4 [PDF – 112 KB]) were:
- Congenital malformations, deformations and chromosomal abnormalities (congenital malformations);
- Disorders related to short gestation and low birth weight, not elsewhere classified (low birthweight);
- Sudden infant death syndrome (SIDS);
- Newborn affected by maternal complications of pregnancy (maternal complications);
- Accidents (unintentional injuries);
- Newborn affected by complications of placenta, cord and membranes (cord and placental complications);
- Respiratory distress of newborn;
- Bacterial sepsis of newborn;
- Neonatal hemorrhage; and
- Diseases of the circulatory system
Trends
- The age-adjusted death rate reached a record low of 800.8 per 100,000 U.S. standard population (Figure 1). This value is 3.8 percent lower than the 2003 rate of 832.7 (Table 1 [PDF – 112 KB]). All of the subgroups defined by sex, race, and Hispanic origin addressed in this report showed significant decreases in the age-adjusted death rate between 2003 and 2004. The relative magnitudes of these decreases were:
- Non-Hispanic white males (3.6 percent);
- Non-Hispanic white females (3.5 percent);
- Non-Hispanic black males (3.7 percent);
- Non-Hispanic black females (3.4 percent);
- American Indian or Alaska Native males (4.9 percent);
- American Indian or Alaska Native females (5.8 percent);
- Asian or Pacific Islander males (5.0 percent);
- Asian or Pacific Islander females (4.4 percent);
- Hispanic males (5.5 percent); and
- Hispanic females (5.8 percent)
- Life expectancy at birth for the total population in 2004 reached a record high of 77.8 years. This represents an increase of 0.3 year relative to 2003. Record-high life expectancies were reached for white and black males, as well as for white and black females (Figure 2).
- The trend toward convergence in mortality figures across the sexes continued in 2004. The difference in life expectancy at birth between male and female has decreased an average one-tenth of a year every year since 1980. The difference between male and female life expectancy was 5.2 years in 2004, the smallest such difference since 1946.
- The trend toward convergence in mortality figures across the major race groups also continued in 2004. The trend that began between 1993 and 1994 has resulted in an average decrease (of the difference) of one-fifth of a year every year since 1993. The difference between white and black life expectancy in 2004 was 5.2 years.
- The 15 leading causes of death in 2004 (Table 2 [PDF – 112 KB]) remained the same as in 2003 with the exception that Alzheimer’s disease and Influenza and pneumonia swapped positions with each other relative to their previous placement in 2003. The age-adjusted death rate declined significantly for 9 of the 15 leading causes of death. Long-term decreasing trends for heart disease, cancer, and stroke (the three leading causes of death) continued. Significant increases occurred for unintentional injuries, hypertension and Alzheimer’s disease.
- The slight decrease of less than 1 percent in the infant mortality rate between 2003 and 2004 (Tables 1 and 3) was not statistically significant.
Technical Notes
Nature and sources of data
Data in this report are based on information from all death certificates filed in the 50 states and the District of Columbia and are processed by the CDC’s NCHS. The data for 2004 are based on records of deaths that occurred during 2004 and were received as of March 31, 2006. NCHS received the data from the states’ vital registration systems through the Vital Statistics Cooperative Program. In this report, U.S. totals include only events occurring within the 50 states and the District of Columbia. Data for Puerto Rico, the Virgin Islands, Guam, American Samoa, and the Northern Marianas are shown in the table showing data by state included in the forthcoming full report (1).
2003 revision of the U.S. Standard Certificate of Death, multiple race data, and Hispanic origin
The U.S. Standard Certificate of Death—which is used as a model by the states—was revised in 2003 (2). Prior to 2003, the Standard Certificate of Death had not been revised since 1989 (3). This report includes data for 12 areas (California, Idaho, Michigan, Montana, New Hampshire, New Jersey, New York City, New York State, Oklahoma, South Dakota, Washington, and Wyoming) which implemented the 2003 revision of the U.S. Standard Certificate of Death in 2004, and for the remaining states and the District of Columbia that collected and reported death data in 2004 based on the 1989 revision of the U.S. Standard Certificate of Death. The 1989 and 2003 revisions are described in detail elsewhere (2-4). Because most of the items presented in this report appear largely comparable despite changes to item wording and format in the 2003 revision, data from both groups of states are combined unless otherwise stated.
The 2003 revision of the U.S. Standard Certificate of Death allows the reporting of more than one race (multiple races). This change was implemented to reflect the increasing diversity of the population of the United States and to be consistent with the decennial census (2). The new standards of the Office of Management and Budget (OMB) mandate the collection of more than one race for federal data (5).
In addition to states reporting multiple race information via their revised death certificates, multiple race was also reported on the unrevised certificates of Hawaii, Maine, Minnesota, and Wisconsin. Refer to the “Technical Notes” of the forthcoming full report for details (1).
In order to provide uniformity and comparability of the data during the transition period (before all or most of the data are available in the new multiple-race format), it was necessary to “bridge” the responses of those for whom more than one race was reported (multiple race) to one, single race. The bridging procedure of mortality data is similar to the procedure used to bridge multiracial population estimates provided by the U.S. Census Bureau (read section on population bases for computing rates, below). Multiracial decedents are imputed to a single race (either white, black, American Indian or Alaska Native, or Asian or Pacific Islander) according to their combination of races, Hispanic origin, sex, and age indicated on the death certificate. See the imputation procedure [PDF – 74 KB] for more details.
Maternal mortality
Maternal mortality rates are computed on the basis of the number of live births. The maternal mortality rate indicates the likelihood of a pregnant woman dying of maternal causes. They are calculated by dividing the number of maternal deaths in a calendar year by the number of live births registered for the same period and are presented as rates per 100,000 live births. The number of live births used in the denominator is an approximation of the population of pregnant women who are at risk of a maternal death.
“Maternal deaths” are defined by the World Health Organization as “the death of a woman while pregnant or within 42 days of termination of pregnancy, irrespective of the duration and the site of the pregnancy, from any cause related to or aggravated by the pregnancy or its management, but not from accidental or incidental causes”(6). Included in these deaths are ICD–10 codes A34, O00-O95, and O98-O99.
Some state death certificates include a separate question regarding pregnancy status. A positive response to the question is interpreted as if “pregnant” was reported in Part II of the cause-of-death section of the death certificate. If a specified length of time is not provided by the medical certifier, it is assumed that the pregnancy terminated 42 days or less prior to death. Further, if only indirect maternal causes of death (i.e., a previously existing disease or a disease that developed during pregnancy that was not due to direct obstetric causes but was aggravated by physiologic effects of pregnancy) are reported in Part I and pregnancy is reported in either Part I or Part II, the death is classified as a maternal death.
The 2003 revision of the U.S. Standard Certificate of Death introduced a standard question format with categories designed to utilize additional codes available in ICD–10 for deaths associated with pregnancy, childbirth, and the puerperium. As states revise their certificates, most states are expected to introduce the standard item or replace pre-existing questions (which can vary in wording and format) with the standard item, so that there will be wider adoption of a pregnancy status item across the country and greater standardization of the particular item used.
A separate pregnancy status item on the death certificate results in the identification of more maternal deaths. Refer to the “Technical Notes” of the forthcoming full report for details (1).
Population bases for computing rates
The rates in this report use population estimates based on the 2000 census and estimated as of July 1, 2003, and July 1, 2004. See Bridged-race population estimates for more information.
Reflecting the new guidelines issued in 1997 by OMB, the 2000 census included an option for individuals to report more than one race as appropriate for themselves and household members (5). Death certificates for 35 states and the District of Columbia collected only one race in the same categories as specified in the 1977 OMB guidelines (see “2003 revision of the U.S. Standard Certificate of Death” in the “Technical Notes”) throughout 2004. In addition, those death certificate data did not report Asians separately from Native Hawaiians or Other Pacific Islanders. The death certificate data by race (the numerators for death rates) thus collected are therefore incompatible for most states with the population data collected in the 2000 census (the source of denominators for the rates).
In order to produce national death rates for 2003 and 2004, it was necessary to bridge the reported population data for multiple-race persons back to single-race categories. In addition, the census counts were modified to be consistent with the 1977 OMB racial categories; that is, to report the data for Asian persons and Native Hawaiians or Other Pacific Islanders as a combined category, Asian or Pacific Islanders, and to reflect age as of the census reference date. The procedures used to produce the bridged populations are described in separate publications (7,8). It is anticipated that bridged data will be used over the next few years for computing population-based rates. As more states collect mortality data for race according to the 1997 OMB guidelines (5), it is expected that use of the bridged populations can be discontinued.
Availability of mortality data
Mortality data are available in publications, unpublished tables, and electronic products as described on the mortality website. More detailed analysis than provided in this report is possible by using the Mortality public-use data set issued each data year. Since 1991, the data set is available through NCHS in CD-ROM format.
References
- Miniño A, Heron M, Smith B, Kochanek K. Deaths: Final data for 2004. National vital statistics reports. Hyattsville, MD. National Center for Health Statistics. Forthcoming.
- 2003 revision of the U.S. Standard Certificate of Death [PDF – 553 KB]. National Center for Health Statistics. 2003.
- Tolson G, Barnes J, Gay G, Kowaleski J. The 1989 revision of the U.S. standard certificates and reports. Vital Health Stat 4 (28): National Center for Health Statistics. 1991.
- Report of the Panel to Evaluate the U.S. Standard Certificates [PDF – 1.9 MB]. National Center for Health Statistics. 2000.
- Revisions to the standards for the classification of federal data on race and ethnicity. Federal Register 62FR58782-58790 (58790): Office of Management and Budget. Available from: . 1997.
- International Statistical Classification of Diseases and Related Health Problems, Tenth Revision. Geneva. World Health Organization. 1992.
- Ingram D, Weed J, Parker J, Hamilton B, Schenker N, et al. U.S. Census 2000 Population with Bridged Race Categories. Vital Health Stat 2 (135): 2003.
- Schenker N, Parker J. From single-race reporting to multiple-race reporting: Using imputation methods to bridge the transition. Statistics in Medicine 22 1571-87 2003.
Suggested citation
Miniño AM, Heron M, Smith BL, Kochanek KD. Deaths: Final data for 2004. Health E-Stats. Released November 24, 2006.
Figures

Acknowledgments
This report was prepared in the Division of Vital Statistics under the general direction of Robert N. Anderson, Chief, Mortality Statistics Branch (MSB). Elizabeth Arias of MSB provided content related to life expectancy. Robert N. Anderson and Sherry Murphy of MSB, and David W. Justice of the Data Acquisition and Evaluation Branch (DAEB) contributed to the “Technical Notes.” David Johnson, Jaleh Mousavi, Jordan Sacks, Manju Sharma, and Charles Royer of the Systems, Programming, and Statistical Resources Branch (SPSRB) provided computer programming support and produced statistical tables. Thomas D. Dunn of SPSRB managed population data and provided content review. Steven J. Steimel and David P. Johnson of SPSRB prepared the mortality file. Staff of MSB provided content and table review. Registration Methods staff and staff of DAEB provided consultation to state vital statistics offices regarding collection of the death certificate data on which this report is based. This E-Stat was edited by Demarius V. Miller, Office of Information Services, Information Design and Publishing Staff and Laura Drescher, NOVA contractor; graphics were produced by Tommy C. Seibert, Jr., of CoCHIS/NCHM/Division of Creative Services; and formatted and posted on the Internet by Christine J. Brown, Office of Information Services, Information Design and Publishing Staff.