Flu Vaccination Coverage, United States, 2013-14 Influenza Season
Data sources: National Immunization Survey-Flu (NIS-Flu) and Behavioral Risk Factor Surveillance System (BRFSS)
Influenza (flu) can cause serious illness and death, particularly in younger and older persons, pregnant women, and those with certain medical conditions. An annual flu vaccination is the best way to prevent flu and is recommended for all persons 6 months of age and older. (1) Based on a study of the 2012–13 flu season, flu vaccination was found to have prevented an estimated 6.6 million illnesses, 3.2 million medically attended illnesses, and 79,260 hospitalizations. (2)
For this report, CDC analyzed data from the National Immunization Survey-Flu (NIS-Flu) for children 6 months through 17 years and the Behavioral Risk Factor Surveillance System (BRFSS) for adults ≥18 years to estimate national flu vaccination coverage from the 2013–14 flu season. Coverage estimates are presented by age group, race/ethnicity, and month of vaccination with additional information for adults with certain medical conditions (e.g., asthma, diabetes, heart disease, chronic obstructive pulmonary disease, or cancers other than skin cancer) that put them at higher risk for flu-related complications.
Additional estimates of flu vaccination coverage by age and racial/ethnic groups for the 2013–14 and earlier seasons for each state, each Health and Human Services (HHS) region, and the United States are provided in FluVaxView as interactive maps, figures, and tables. Selected estimates for local areas and territories are also available ( 2013-14 Estimates for Local Areas and Territories ). Coverage estimates for pregnant women and healthcare personnel are reported in the MMWR.
Key Findings
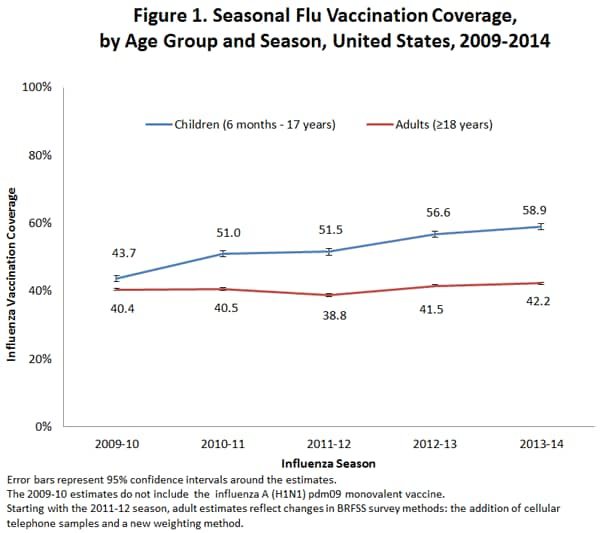
- Flu vaccination coverage among children increased by 2.3 percentage points for the 2013–14 season compared to the 2012–13 season.
- Flu vaccination coverage among adults increased by 0.7 percentage points for the 2013-14 season compared to the 2012–13 season.
- State variability in child and adult flu vaccination coverage continues to be large. (Interactive Report).
Coverage by Age Group
- Among all people ≥6 months, flu vaccination coverage during the 2013–14 flu season was 46.2%, which was 1.2 percentage points higher than the 2012–13 season (45.0%).
- State-specific flu vaccination coverage among all people ≥6 months ranged from 36.4% (Nevada) to 57.4% (South Dakota). (Interactive Report)
| Age Group |
Unweighted Sample Size |
%‡ ±95% CI§ |
Difference from the 2012–13 Season ±95% CI |
|---|---|---|---|
| All People ≥6 months |
481,432 |
46.2 ± 0.4 |
1.2 ± 0.6|| |
| Children (6 months−17 years) |
126,860 |
58.9 ± 0.8 |
2.3 ± 1.2|| |
| Adults (≥18 years) |
354,572 |
42.2 ± 0.4 |
0.7 ± 0.6|| |
Children (6 months through 17 years)
- Flu vaccination coverage among children 6 months through 17 years decreased with increasing age:
- 6–23 months: 74.3%
- 2–4 years: 68.1%
- 5–12 years: 61.0%
- 13–17 years: 46.4%
- Among children 6 months through 17 years, coverage with one or more doses of flu vaccine was 58.9%, an increase of 2.3 percentage points from the 2012–13 season.
- State-specific flu vaccination coverage for children 6 months through 17 years ranged from 42.1% (Wyoming) to 74.5% (Rhode Island). (Interactive Report)
| Age Group |
Unweighted Sample Size |
%‡ ±95% CI§ |
Difference from the 2012-13 Season ±95% CI |
|---|---|---|---|
| 6 months−17 years |
126,860 |
58.9 ± 0.8 |
2.3 ± 1.2|| |
| 6 months−4 years |
36,196 |
70.4 ± 1.3 |
0.6 ± 2.1 |
| 6−23 months |
13,414 |
74.3 ± 2.0 |
-2.6 ± 3.0 |
| 2−4 years |
22,782 |
68.1 ± 1.8 |
2.3 ± 2.7 |
| 5−17 years |
90,664 |
55.3 ± 0.9 |
3.0 ± 1.3|| |
| 5−12 years |
62,590 |
61.0 ± 1.1 |
2.4 ± 1.7|| |
| 13−17 years |
28,074 |
46.4 ± 1.5 |
3.9 ± 2.1|| |
For estimates for children by place of vaccination, please see Place of Flu Vaccination 2013-14. Adults (18 years and older)
- Coverage among adults 18 years and older increased with increasing age:
- 18–49 years: 32.3%
- 50–64 years: 45.3%
- ≥65 years: 65.0%
- Among adults ≥18 years, coverage was 42.2%, which was 0.7 percentage points higher than coverage in the 2012–13 season (41.5%).
- State-specific coverage for adults 18 years and older ranged from 32.3% (Nevada) to 54.0% (South Dakota). (Interactive Report)
| Age Group |
Unweighted Sample Size |
%‡ ±95% CI§ |
Difference from the 2012-13 Season ±95% CI |
|---|---|---|---|
| ≥18 years |
354,572 |
42.2 ± 0.4 |
0.7 ± 0.6|| |
| 18−64 years |
233,459 |
36.7 ± 0.6 |
1.0 ± 0.8|| |
|
18−64 years at high risk¶ |
60,603 |
46.3 ± 1.0 |
0.9 ± 1.6 |
|
18−64 years not at high risk |
170,313 |
33.9 ± 0.6 |
1.0 ± 0.8|| |
| 18−49 years |
119,708 |
32.3 ± 0.6 |
1.2 ± 1.0|| |
|
18−49 years at high risk |
21,198 |
38.7 ± 1.8 |
0.6 ± 2.5 |
|
18−49 years not at high risk |
97,005 |
31.1 ±0.8 |
1.3 ± 1.1|| |
| 50−64 years |
113,751 |
45.3 ± 0.6 |
0.2 ± 1.0 |
| ≥65 years |
121,113 |
65.0 ± 0.6 |
-1.2 ± 1.0|| |
Coverage by Sex
Children (6 months through 17 years)
- There were no differences in flu vaccination coverage between male and female children.
- For adults, flu vaccination coverage was higher among females than males for every age group except adults ≥ 65 years.
| Male | Female | |||
|---|---|---|---|---|
| Age Group |
Unweighted Sample Size |
%‡ ±95% CI§ |
Unweighted Sample Size |
%±95% CI |
| All Ages | ||||
| ≥6 months |
211,911 |
43.5 ±0.5** |
269,521 |
48.8 ± 0.5** |
| Children | ||||
| 6 months−17 years |
65,205 |
58.6 ± 1.1 |
61,655 |
59.3 ± 1.1 |
| 6 months−4 years |
18,637 |
70.0 ± 1.8 |
17,559 |
70.9 ± 2.0 |
| 6−23 months |
6,963 |
73.3 ± 2.6 |
6,451 |
75.3 ± 2.9 |
| 2−4 years |
11,674 |
68.0 ± 2.4 |
11,108 |
68.3 ± 2.6 |
| 5−12 years |
32,043 |
60.6 ± 1.4 |
30,547 |
61.4 ± 1.7 |
| 13−17 years |
14,525 |
46.3 ± 2.2 |
13,549 |
46.5 ± 2.2 |
| Adults | ||||
| ≥18 years |
146,706 |
38.5 ± 0.6** |
207,866 |
45.6 ± 0.6** |
| 18−64 years |
100,928 |
32.9 ± 0.8** |
132,531 |
40.4 ± 0.6** |
|
18−64 years at high risk¶ |
23,224 |
44.3 ± 1.8** |
37,379 |
47.7 ± 1.4** |
|
18−64 years not at high risk |
76,433 |
30.2 ± 0.8** |
93,880 |
37.8 ± 0.8** |
| 18−49 years |
53,272 |
28.5 ± 1.0** |
66,436 |
36.4 ± 0.8** |
|
18−49 years at high risk |
7,499 |
35.2 ± 2.9** |
13,699 |
41.1 ± 2.2** |
|
18−49 years not at high risk |
44,994 |
27.5 ± 1.0** |
52,011 |
35.2 ± 1.0** |
| 50−64 years |
47,656 |
42.7 ± 1.0** |
66,095 |
47.7 ± 1.0** |
| ≥65 years |
45,778 |
65.0 ± 1.0 |
75,335 |
65.1 ± 0.8 |
Coverage by Race/Ethnicity
- Among people ≥6 months, coverage for non-Hispanic whites (47.4%) was higher than that of non-Hispanic blacks (41.5%), Hispanics (44.3%), and people of other or multiple races (42.9%) and was similar to coverage among American Indians/Alaska Natives (AI/AN) (48.0%).
- Additionally, coverage for non-Hispanic blacks (41.5%) was lower than that of Hispanics (44.3%), Asians (51.3%), and AI/ANs (48.0%); in addition to the previously mentioned differences coverage for Asians (51.3%) was higher than non-Hispanic whites (47.4%), Hispanics (44.3%), and people of other or multiple races (42.9%). For all other racial/ethnic group comparisons there were not statistically significant differences.
- Among all people ≥6 months, coverage during the 2013–14 increased by one percentage point for non-Hispanic white people compared to the 2012–13 season; there were no increases in the other racial/ethnic groups.
| Race/Ethnicity§§ |
Unweighted Sample Size |
%‡ ±95% CI§ |
Difference from the 2012-13 Season ±95% CI |
|---|---|---|---|
| Overall |
481,432 |
46.2 ± 0.4 |
1.2 ± 0.6|| |
| White only, non-Hispanic |
352,467 |
47.4 ± 0.4 |
1.0 ± 0.6|| |
| Black only, non-Hispanic |
39,861 |
41.5 ± 1.2 |
0.2 ± 1.8 |
| Hispanic |
47,670 |
44.3 ± 1.2 |
1.6 ± 1.8 |
| Other, non-Hispanic (Total) |
34,468 |
47.3 ± 1.5 |
0.6 ± 2.3 |
| Asian |
11,267 |
51.3 ± 2.7 |
1.4 ± 4.0 |
|
American Indian/Alaska Native (AI/AN) |
7,512 |
48.0 ± 4.9 |
4.6 ± 6.0 |
|
Other or multiple race†† |
15,689 |
42.9 ± 2.0 |
-1.5 ± 3.1 |
Children (6 months through 17 years)
- Non-Hispanic white children (55.2%) had lower flu vaccination coverage than Hispanic children (66.0%), Asian children (70.6%), AI/AN children (65.5%) and children of other or multiple races (59.2%). White children had similar coverage to non-Hispanic black children (57.2%).
- Additionally, non-Hispanic black children (57.2%) had lower flu vaccination coverage than Hispanic children (66.0%), Asian children (70.6%), and AI/AN children (65.5%). Hispanic children (66.0%) had higher coverage than children of other or multiple races (59.2%), and Asian children (70.6%) had higher coverage than Hispanic children (66.0%) and children of other or multiple races (59.2%). For all other racial/ethnic group comparisons, there were not statistically significant differences.
- Among children, coverage during the 2013–14 season increased by 1.4 percentage points for non-Hispanic white, 5.1 for Hispanic, and 13.0 for AI/AN children compared to the 2012–13 season, while coverage for non-Hispanic black children did not change.
| Race/Ethnicity§§ |
Unweighted Sample Size |
%‡ ±95% CI§ |
Difference from the 2012-13 Season ±95% CI |
|---|---|---|---|
| Overall |
126,860 |
58.9 ± 0.8 |
2.3 ± 1.2|| |
| White only, non-Hispanic |
75,934 |
55.2 ± 0.9 |
1.4 ± 1.3|| |
| Black only, non-Hispanic |
12,934 |
57.2 ± 2.2 |
0.5 ± 3.5 |
| Hispanic |
23,247 |
66.0 ± 2.1 |
5.1 ± 3.0|| |
| Other, non-Hispanic (Total) |
14,745 |
64.9 ± 2.1 |
4.1 ± 3.4|| |
| Asian |
5,455 |
70.6 ± 3.2 |
4.8 ± 5.5 |
|
American Indian/Alaska Native (AI/AN) |
1,933 |
65.5 ± 5.6 |
13.0 ± 8.8|| |
|
Other or multiple race†† |
7,357 |
59.2 ± 3.0 |
0.7 ± 4.7 |
For additional race/ethnicity estimates by age group, please see Table 6 Supplement. Influenza Vaccination Coverage* by Race/Ethnicity, Children 6 months through 17 years–United States,† 2013-14 Season. Adults (18 years and older)
- Among adults, coverage for non-Hispanic whites (45.4%) was higher than coverage for non-Hispanic blacks (35.6%), Hispanics (33.1%), and adults of other or multiple races (34.9%); non-Hispanic whites had similar coverage to Asian (43.6%) and AI/AN (44.1%) adults.
- Additionally, non-Hispanic black adults (35.6%) had higher coverage than Hispanic adults (33.1%), and lower coverage than Asian adults (43.6%) and AI/AN adults (44.1%), but had similar coverage compared to adults of other or multiple race (34.9%); in addition to the previously mentioned differences Hispanic adults (33.1%) had lower coverage than Asian adults (43.6%) and AI/AN adults (44.1%). Asian adults (43.6%) also had higher coverage than adults of other or multiple races (34.9%). For all other racial/ethnic group comparisons, there were not statistically significant differences.
- Among adults, coverage during the 2013–14 increased by 0.8 percentage points for non-Hispanic white adults compared to the 2012–13 season; there were no increases in the other racial/ethnic groups.
| Race/Ethnicity§§ |
Unweighted Sample Size |
%‡ ±95% CI§ |
Difference from the 2012-13 Season ±95% CI |
|---|---|---|---|
| Overall |
354,572 |
42.2 ± 0.4 |
0.7 ± 0.6|| |
| White only, non-Hispanic |
276,533 |
45.4 ± 0.4 |
0.8 ± 0.6|| |
| Black only, non-Hispanic |
26,927 |
35.6 ± 1.4 |
0.0 ± 2.1 |
| Hispanic |
24,423 |
33.1 ± 1.4 |
-0.7 ± 2.3 |
| Other, non-Hispanic (Total) |
19,723 |
40.1 ± 2.0 |
-1.5 ± 3.0 |
| Asian |
5,812 |
43.6 ± 3.5 |
-1.2 ± 4.9 |
|
American Indian/Alaska Native |
5,579 |
44.1 ± 5.9 |
3.0 ± 7.1 |
|
Other or multiple race†† |
8,332 |
34.9 ± 2.5 |
-3.1 ± 4.0 |
For additional race/ethnicity estimates by age group, please see Table 7 Supplement. Influenza Vaccination Coverage* by Race/Ethnicity, Adults 18 years and older–United States,† 2013-14 Season.
Coverage by Month
Children (6 months through 17 years)
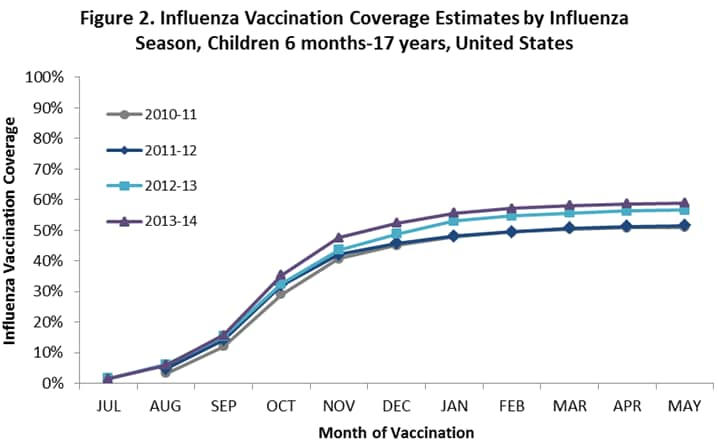
- Among children 6 months through 17 years, coverage by the end of May was higher for the 2013–14 season compared to the 2012–13 season.
- Among children 6 months through 17 years, cumulative monthly coverage for 2013–14 was similar to coverage in the 2012–13 season during the first few months of vaccination.
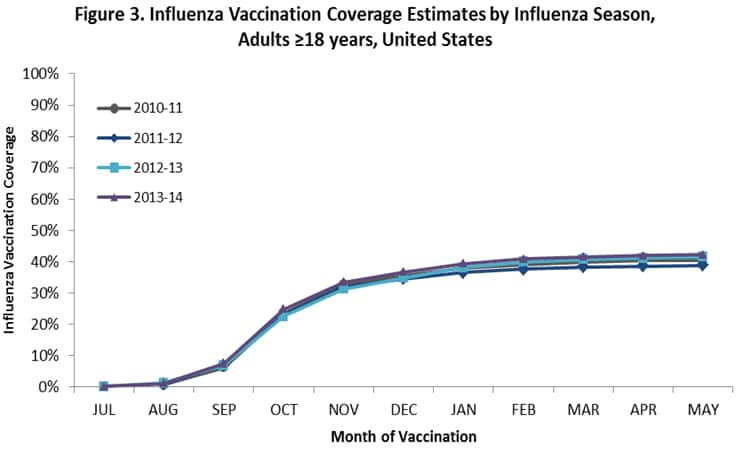
- Among adults ≥18 years, cumulative coverage by the end of May was slightly higher for the 2013–14 season compared to the 2012–13 season (Figure 3).
Learn more about the percentage of vaccinations given each month among vaccinated children.
Estimated Number of Persons Vaccinated
Based on reports of vaccination from survey respondents, the estimated numbers of persons with reported receipt of one or more seasonal flu vaccinations was 42.4 million (95% Confidence Interval [CI] 41.8–42.9 million) children (6 months through 17 years) and 100.8 million (95% CI 99.8–101.8 million) adults (≥18 years), for an estimated 143.2 million (95% CI 141.6–144.7 million) people vaccinated against seasonal flu during July 2013 through May 2014 among the civilian, non-institutionalized U.S. population. These estimates do not include military or institutionalized persons who were vaccinated and do not include second doses given to children. However, the actual number of doses of flu vaccine distributed during the 2013-14 season was 134.5 million, indicating that the flu vaccination coverage estimates reported in this article are high. Over-estimates of doses may be due to a combination of factors including respondents having higher coverage than persons not surveyed (response bias), recall bias, or other factors. Examples of studies in which medical record validation has been compared to adult patient or parent report of vaccination estimated that coverage by parental report was seven percentage points too high for children 6-59 months, and coverage by self-report was 5-11 percentage points too high for adults ≥65 years. (3;4) Thus, while numbers of doses administered cannot be validated with this data, the surveys do provide important data to following trends in vaccination over time among different populations. Top of Page
What Can Be Done?
For adults overall, flu vaccination coverage increased only slightly for the 2013-14 season compared to the 2012–13 season and among children 6 months through 17 years, there was an increase of 2.3 percentage points. There were some racial/ethnic differences in flu vaccination and considerable variation in coverage by state. Flu vaccination coverage for the 2013-14 season for all groups, except children 6-23 months, was below the Healthy People 2020 targets‡‡ of 70% vaccination coverage for persons 6 months through 17 years and ≥18 years. (5)
Since flu vaccination is the most effective strategy against flu and serious flu-related complications, immunization programs are encouraged to use strategies known to increase coverage:
- Improve use of evidence-based practices at medical sites to increase access to vaccination services (e.g., reducing client costs, vaccination programs in schools and WIC settings, and home visits), increase community demand for vaccinations (e.g., client reminder/recall systems and school vaccination requirements), and ensure that all those who visit a provider during the flu season receive a vaccination recommendation and offer from their provider (e.g., standing orders, and provider reminders). (6)
- Expand access through use of non-traditional settings for vaccination (e.g., pharmacy, workplace, and school venues) to reach individuals who may not visit a traditional physician’s office during the flu season. (7)
- Utilize immunization information systems, also known as registries, at the point of clinical care and at the population level to guide clinical and public health vaccination decisions. (6)
These and other strategies are described in the Community Guide for Preventive Services. (6)
Updated recommendations have been published for influenza vaccination for the 2014-15 influenza season. (8) Updated information for the 2014–15 influenza season includes 1) antigenic composition of U.S. seasonal influenza vaccines; 2) vaccine dose considerations for children 6 months through 8 years; and 3) a preference for the use, when immediately available, of live attenuated influenza vaccine (LAIV) for healthy children 2 through 8 years, to be implemented as feasible for the 2014–15 season but not later than the 2015–16 season. Information regarding issues related to influenza vaccination not addressed in this report is available in the 2013 ACIP seasonal influenza recommendations. Top of Page
Data Sources and Methods
CDC analyzed NIS-Flu and BRFSS data collected September (BRFSS) or October (NIS) 2013 through June 2014 (or as available) from all 50 states and the District of Columbia to estimate national and state level flu vaccination coverage from July 2013 through May 2014 for the 2013–14 flu season. These findings were compared to 2012–13 flu season estimates.
The NIS-Flu has three components: the NIS which includes households with children 19–35 months, the NIS-Teen which includes households with children 13–17 years, and a short flu vaccination module which is conducted for households with children 6–18 months and 3–12 years. The NIS-Flu is a national dual landline cellular list-assisted random-digit-dialed telephone survey of households. Respondents ≥18 years were asked if their child had received a flu vaccination since July 1, 2013 and, if so, in which month and year. The Council of American Survey and Research Organizations (CASRO) response rate for the NIS-Flu across the three quarters of flu vaccination data collection was 58.6% for landline and 32.1% for cellular telephones.
BRFSS is an ongoing state-based monthly telephone survey which collects information on health conditions and risk behaviors from ~400,000 randomly selected persons ≥18 years among the non-institutionalized, U.S. civilian population. BRFSS respondents were asked if they had received a flu vaccine in the past 12 months, and if so, in which month and year. The median state BRFSS response rate was 45.7% for October–December 2013 and 46.4% for January–June 2014. Starting in 2011, BRFSS methods changed by adding persons in households with only cellular telephone service and improvements to weighting procedures; these changes were reflected in the 2011–12 and subsequent flu vaccination coverage estimates. (9)
Flu vaccination coverage estimates from both surveys were calculated using Kaplan-Meier survival analysis to determine the cumulative flu vaccination coverage (≥1 dose) July 2013 through May 2014 using monthly interview data collected October 2013 through June 2014. NIS-Flu data were used to estimate coverage for children 6 months through 17 years and BRFSS data were used to estimate coverage for adults ≥18 years. Coverage estimates for all persons ≥6 months were determined using combined state-level monthly estimates weighted by the age-specific populations of each state. (10) For 16.3% of vaccinated NIS-Flu participants and 6.8% of vaccinated BRFSS participants, month of vaccination was not reported and was imputed from donor pools matched for week of interview, age group, state of residence, and race/ethnicity. Results from both surveys were weighted and analyzed with SAS and SUDAAN statistical software to account for the complex survey design. Differences between groups and between 2012–13 and 2013–14 seasons were determined using t-tests with significance at p<0.05. Differences mentioned in this report were statistically significant. Top of Page
Limitations
The estimates in this report are subject to the following limitations. First, flu vaccination status was based on self or parental report and not validated with medical records and, thus, is subject to respondent recall bias. (3;4) NIS-Flu and BRFSS, as well as the National Health Interview Survey (NHIS), are all subject to respondent recall bias. Second, response rates for NIS-Flu and BRFSS surveys were low and nonresponse bias may remain even after weighting adjustments. A comparison of NIS-Flu estimates with those from NHIS suggests that the NIS-Flu estimates have a slight upward nonresponse bias. (11;12) Third, combining NIS-Flu and BRFSS estimates allowed estimation of coverage for all persons ≥6 months; however, differences in survey methodology (e.g., different sampling frame, survey design, exact survey question wording, response rates and weighting) may result in different levels of bias that are averaged for this group. Fourth, the number of persons vaccinated was overestimated, evidenced by a higher number vaccinated than doses distributed as has occurred previously. (13) Fifth, the definition of high-risk status changed for this report compared to previous year’s reports. Previous years included people with asthma, diabetes, or heart disease; this report expanded that definition to include those with chronic obstructive pulmonary disease or cancers other than skin cancer. To see how this affected the estimates a crosswalk table has been provided at Flu Vaccination Coverage by High-Risk Conditions, Adults, BRFSS. Note that the season-comparison differences in Table 3 were calculated based on 2012-13 estimates that were recalculated to include this expanded high-risk definition and so differ from the estimates in last season’s online report. Sixth, BRFSS interviews were not conducted in California from January through June 2014; therefore, only interviews from September through December 2013 could be used for California. Vaccination coverage could only be estimated through November 2013 for California for adults (39.2%). Assuming California had a similar increase in coverage from November 2013 to May 2014 as other states in 2013-14, with adjustments for possibly higher later season uptake in California compared to other states based on 2012-13 data, estimated coverage for California for adults through May 2014 was 47.9%. Using this estimate, national coverage for adults would be 42.8%, 0.6 percentage points higher than the 42.2% estimate in this report. To evaluate the possible effects on differences in estimates compared to the prior season, differences were also computed using 2012-13 season estimates which excluded interview data from California for January through June 2013. For most of the estimated differences from 2012-13 to 2013-14 season in this report, conclusions based on statistical testing were the same and the changes across seasons very similar. There were three subgroups for which the differences in this report were reduced and no longer statistically significant when excluding January-June 2013 interview data from California from the 2012-13 estimates: white-only non-Hispanic adults 18-64 years at high-risk; adults 18-64 years not at high-risk; and white-only non-Hispanic whites 18-64 years not at high-risk. Mississippi had too few interviews (n<30) conducted in April through June 2014 to produce reliable state-level estimates for March through May. Finally, some age-by-state-specific estimates in the accompanying interactive reports may be unreliable due to large confidence intervals. Estimates flagged as potentially unreliable should be interpreted with caution. Top of Page
Authors
Tammy A. Santibanez, PhD; Alissa O’Halloran, MSPH; Yusheng Zhai, MSPH; Katherine E. Kahn, MPH; Nick Davis, MS; Carolyn B. Bridges, MD; Stacie M. Greby, DVM, MPH; Walter W. Williams, MD, MPH; Peng-Jun Lu, MD, PhD; Erin D. Kennedy, DVM, MPH; James A. Singleton, PhD
Related Links
National Immunization Survey (NIS):
- National Immunization Survey
- Vaccination Coverage in the U.S.
Behavioral Risk Factor Surveillance System (BRFSS):
- Behavioral Risk Factor Surveillance System
- Adult Vaccination Coverage Reported via BRFSS
FluVaxView Vaccination Coverage Reports:
Flu General Information:
Footnotes
* Estimates of the percentage of people vaccinated are based on interviews conducted beginning September (BRFSS) or October (NIS) 2013 through June 2014 and reported vaccinations from July 2013 through May 2014. For California, BRFSS interview data were only available for September-December 2013 and thus estimates for persons ≥18 years only reflect vaccinations during July-November 2013. For Mississippi, sample size was insufficient from interviews conducted April-June 2014 to estimate vaccinations past the end of February, 2014 for persons ≥18 years.
† Excludes U.S territories.
‡ Percentage vaccinated. Percentages are weighted to the non-institutionalized U.S. civilian population. Month of vaccination was imputed for respondents with missing month of vaccination data.
§ Confidence interval half-widths.
|| Statistically significant difference between the 2013-14 season and the 2012-13 season by t-test (P<0.05).
¶ Selected high-risk (HR) conditions; includes people with asthma, diabetes, heart disease, chronic obstructive pulmonary disease, or cancers other than skin cancer.
** Statistically significant difference between male and female estimates by t-test (P<0.05).
†† Includes Native Hawaiian or other Pacific Islander, multiracial, and other races.
‡‡ The National Health Interview Survey (NHIS) is the data source used to monitor the Healthy People objectives for influenza vaccination (IID-12.11-14). Final NHIS estimates for the 2013-14 season will be available by September 2015. Information about these objectives is available online at: Immunization and Infectious Diseases. A comparison of estimates from NIS and BRFSS to NHIS is available online at 2012-13 NHIS, BRFSS, and NIS-Flu Influenza Data.
§§ Race is reported by respondent; people of Hispanic ethnicity may be of any race.
References
(1) CDC. Prevention and control of seasonal influenza with vaccines: recommendations of the Advisory Committee on Immunization Practices–Unted States, 2013-14. MMWR Recomm Rep 2013;62:1-43.
(2) CDC. Estimated influenza illnesses and hospitalizations averted by influenza vaccination-United States, 2012-13 influenza season. MMWR Morb Mortal Wkly Rep 2013;62:997-1000.
(3) MacDonald R, Baken L, Nelson A, Nichol KL. Validation of self-report of influenza and pneumococcal vaccination status in elderly outpatients. Am J Prev Med 1999;16:173-177.
(4) Brown C, Clayton-Boswell H, Chaves SS et al. Validity of parental report of influenza vaccination in young children seeking medical care. Vaccine 2011;29:9488-9492.
(5) U.S.Department of Health and Human Services. Healthy People 2020. Topics & Objectives-Immunization and Infectious Diseases. [serial online] 2013; Accessed July 26, 2013.
(6) Guide to Community Preventive Services. Increasing appropriate vaccination. [serial online] 2013; Accessed July 30, 2013.
(7) Murphy PA, Frazee SGCJP, Cohen E, Rosan JR, Harshburgher DE. Pharmacy provision of influenza vaccinations in medically underserved communities. J Am Pharm Assoc 2012;52:70.
(8) Grohskopf LA, Olsen SJ, Sokolow LZ et al. Prevention and control of seasonal influenza with vaccines: recommendations of the Advisory Committee on Immunization Practices (ACIP)–United States, 2014-15 influenza season. MMWR 2014;63:691-697.
(9) CDC. Methodologic changes in the Behavioral Risk Factor Surveillance System in 2011 and potential effects on prevalence estimates. MMWR 2012;61:410-413.
(10) Furlow-Parmley C, Singleton JA, Bardenheier B, Bryan L. Combining estimates from two surveys: an example from monitoring 2009 influenza A(H1N1) pandemic vaccination. Stat Med 2012;31:3285-3294.
(11) Santibanez TA, Lu PJ, O’Halloran A, Meghani A, Grabowsky M, Singleton JA. Trends in Childhood Influenza Vaccination Coverage–U.S., 2004-2012. Public Health Rep 2014;in press.
(12) CDC. Surveillance of influenza vaccination coverage–United States, 2007-08 through 2011-12 influenza seasons. MMWR CDC Surveill Summ 2013;62:1-28.
(13) CDC. Interim results: state-specific seasonal influenza vaccination coverage–United States, August 2009-January 2010. MMWR Morb Mortal Wkly Rep 2010;59:477-484.