
Explore key facts and resources about transportation safety.
Featured Topics

Know how to keep child passengers safe.

Learn how to keep teen drivers safe.

Learn about risks for older adult drivers and key safety steps.
Transportation Safety Topics

Pedestrian, Bicycle, and Motorcycle Safety
Learn about pedestrian, bicycle, and motorcycle safety.
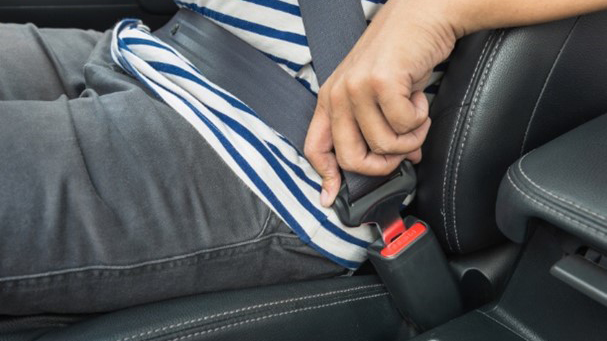
Learn how seat belt use can prevent injuries and deaths.

Learn about the types of distracted driving and the impact they have.

Learn ways to prevent impaired driving.

Explore proven strategies to reduce motor vehicle injuries and deaths among tribal communities.

Learn more about global road safety.