Epidemiology and Statistics
Q fever was first recognized as a human disease in Australia in 1935 and in the United States in the early 1940s. The “Q” stands for “query” and was applied at a time when the cause was unknown. Q fever is caused by infection with the bacteria Coxiella burnetii. Cattle, sheep, and goats are commonly infected and people often become exposed by breathing in dust contaminated with infected animal body fluids. People in direct contact with animals during birthing, such as veterinarians and farmers, may be at higher risk for infection. C. burnetii can survive for long periods of time in the environment and may be carried long distances by wind.
Q Fever in the United States
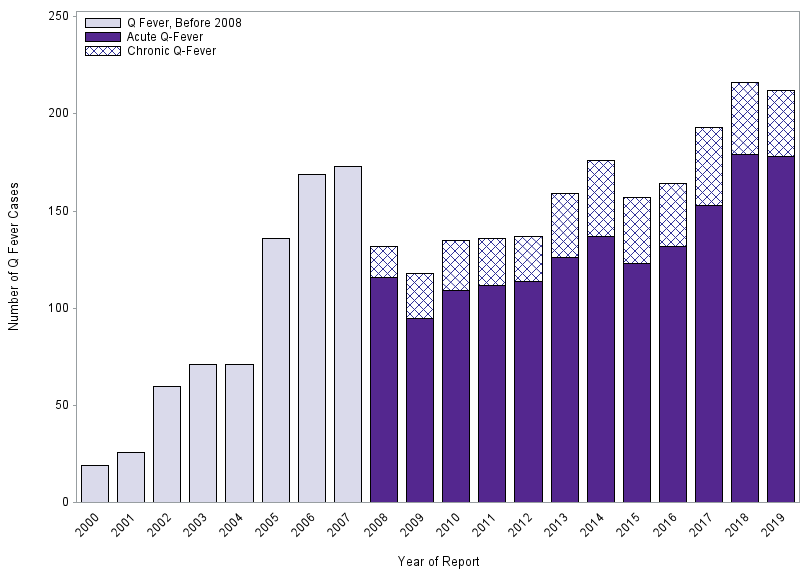
Q fever was made a nationally notifiable disease in the United States in 1999. CDC compiles the number of cases reported by state and local health departments and reports national trends. The number of Q fever cases reported to CDC increased, from 19 cases reported in 2000, to 173 cases reported in 2007. In 2008, the Q fever case definition was changed to allow for the reporting of chronic and acute Q fever separately. During 2008–2013 the number of reported cases decreased slightly, relative to 2007, returning to high levels in 2014. In 2019, 178 acute Q fever cases were reported, as well as 34 chronic Q fever cases.
Number of reported cases of Q fever –United States, 2000–2019
| Number of Cases | |||
|---|---|---|---|
| Year | Q Fever, Before 2008 | Acute Q-Fever | Chronic Q-Fever |
| 2000 | 19 | – | – |
| 2001 | 26 | – | – |
| 2002 | 60 | – | – |
| 2003 | 71 | – | – |
| 2004 | 71 | – | – |
| 2005 | 136 | – | – |
| 2006 | 169 | – | – |
| 2007 | 173 | – | – |
| 2008 | – | 116 | 16 |
| 2009 | – | 95 | 23 |
| 2010 | – | 109 | 26 |
| 2011 | – | 112 | 24 |
| 2012 | – | 114 | 23 |
| 2013 | – | 126 | 33 |
| 2014 | – | 137 | 39 |
| 2015 | – | 123 | 34 |
| 2016 | – | 132 | 32 |
| 2017 | – | 153 | 40 |
| 2018 | 179 | 37 | |
| 2019 | 178 | 34 | |
Geography
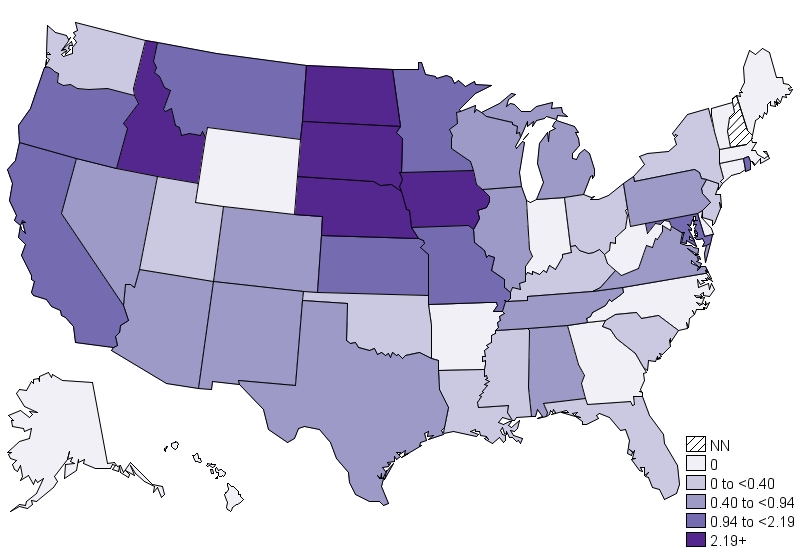
The number of cases of Q fever per million persons varies by state, with cases most frequently reported from western and plains states where ranching and rearing of livestock are common. More than one third of cases (36%) are reported from three states (California, Texas, and Iowa). Sporadic reports of cases may result when people travel to other states or countries and are infected with C. burnetii.
Annual incidence (per million population) of reported Q fever–United States, 2019. (NN= Not notifiable)
| State of Residence | Cases per Million |
|---|---|
| Alabama | 0.41 |
| Alaska | 0 |
| Arizona | 0.82 |
| Arkansas | 0 |
| California | 0.99 |
| Colorado | 0.87 |
| Connecticut | 0 |
| Delaware | 0 |
| District of Columbia | 0 |
| Florida | 0.09 |
| Georgia | 0 |
| Hawaii | 0 |
| Idaho | 2.24 |
| Illinois | 0.71 |
| Indiana | 0 |
| Iowa | 5.71 |
| Kansas | 1.37 |
| Kentucky | 0.22 |
| Louisiana | 0.22 |
| Maine | 0 |
| Maryland | 0.99 |
| Massachusetts | 0 |
| Michigan | 0.5 |
| Minnesota | 2.13 |
| Mississippi | 0.34 |
| Missouri | 1.3 |
| Montana | 1.87 |
| Nebraska | 2.58 |
| Nevada | 0.65 |
| New Hampshire | NN |
| New Jersey | 0.34 |
| New Mexico | 0.48 |
| New York | 0.21 |
| North Carolina | 0 |
| North Dakota | 2.62 |
| Ohio | 0.26 |
| Oklahoma | 0.25 |
| Oregon | 1.19 |
| Pennsylvania | 0.78 |
| Rhode Island | 0.94 |
| South Carolina | 0.39 |
| South Dakota | 12.43 |
| Tennessee | 0.59 |
| Texas | 0.66 |
| Utah | 0.31 |
| Vermont | 0 |
| Virginia | 0.7 |
| Washington | 0.39 |
| West Virginia | 0 |
| Wisconsin | 0.69 |
| Wyoming | 0 |
Seasonal Trends
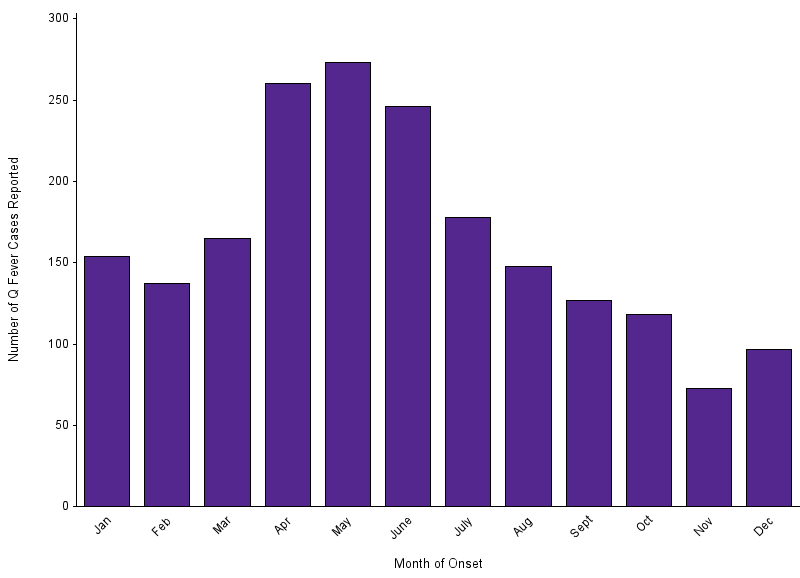
Cases of Q fever can occur during any month of the year. Most cases of report illness begin in the spring and early summer months, peaking in April and May. This timeframe is also the peak of birthing season for cattle, sheep and goats.
Number of reported cases of Q fever, by month of onset–United States, 2000–2019
| Month of Onset | Number of Q Fever Cases Reported |
|---|---|
| January | 154 |
| February | 137 |
| March | 165 |
| April | 260 |
| May | 273 |
| June | 246 |
| July | 178 |
| August | 148 |
| September | 127 |
| October | 118 |
| November | 73 |
| December | 97 |
People at Risk
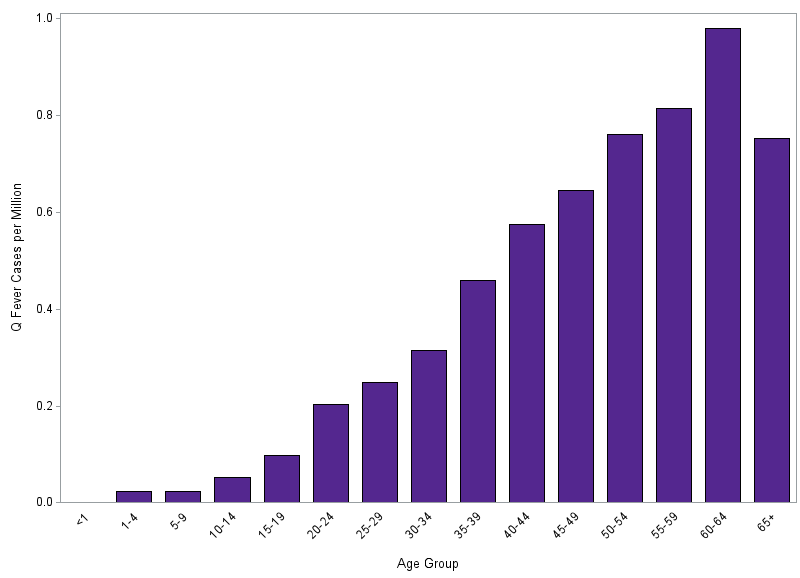
More cases of Q fever are reported in older people, especially men. However, men may be more likely to hold jobs with increased risk for Q fever exposure, such as ranching or livestock management. People who live or spend time near ranches and livestock facilities are at increased risk for Q fever infection. Studies have shown that people with a history of heart valve defects, endocarditis, or heart valve implants may have increased risk of chronic infection and severe disease.
Average annual incidence (per million population) of reported Q fever, by age group–United States, 2019
| Age Group | Cases per Million |
|---|---|
| Under 1 | 0 |
| <1-4 | 0.02 |
| 5-9 | 0.02 |
| 10-14 | 0.05 |
| 15-19 | 0.1 |
| 20-24 | 0.2 |
| 25-29 | 0.25 |
| 30-34 | 0.31 |
| 35-39 | 0.46 |
| 40-44 | 0.58 |
| 45-49 | 0.65 |
| 50-54 | 0.76 |
| 55-59 | 0.81 |
| 60-64 | 0.98 |
| 65 and older | 0.75 |