Occurrence and Transmission
Classic CJD has been recognized since the early 1920s. The majority of cases of CJD (about 85%) are believed to occur sporadically, caused by the spontaneous transformation of normal prion proteins into abnormal prions. This sporadic disease occurs worldwide, including the United States, at a rate of roughly 1 to 2 cases per 1 million population per year. The risk of CJD increases with age; the 2016–2020 average annual rate in the United States was about 5 cases per million in persons 55 years of age or older.
A smaller proportion of patients (5–15%) develop CJD because of inherited mutations of the prion protein gene. These inherited forms include Gerstmann-Straussler-Scheinker syndrome and fatal familial insomnia. Death records are a good index of the incidence of CJD because the disease is always fatal, and the median duration of illness is about 4–5 months.
Creutzfeldt-Jakob disease deaths and age-adjusted death rate, United States, 1979–2020*
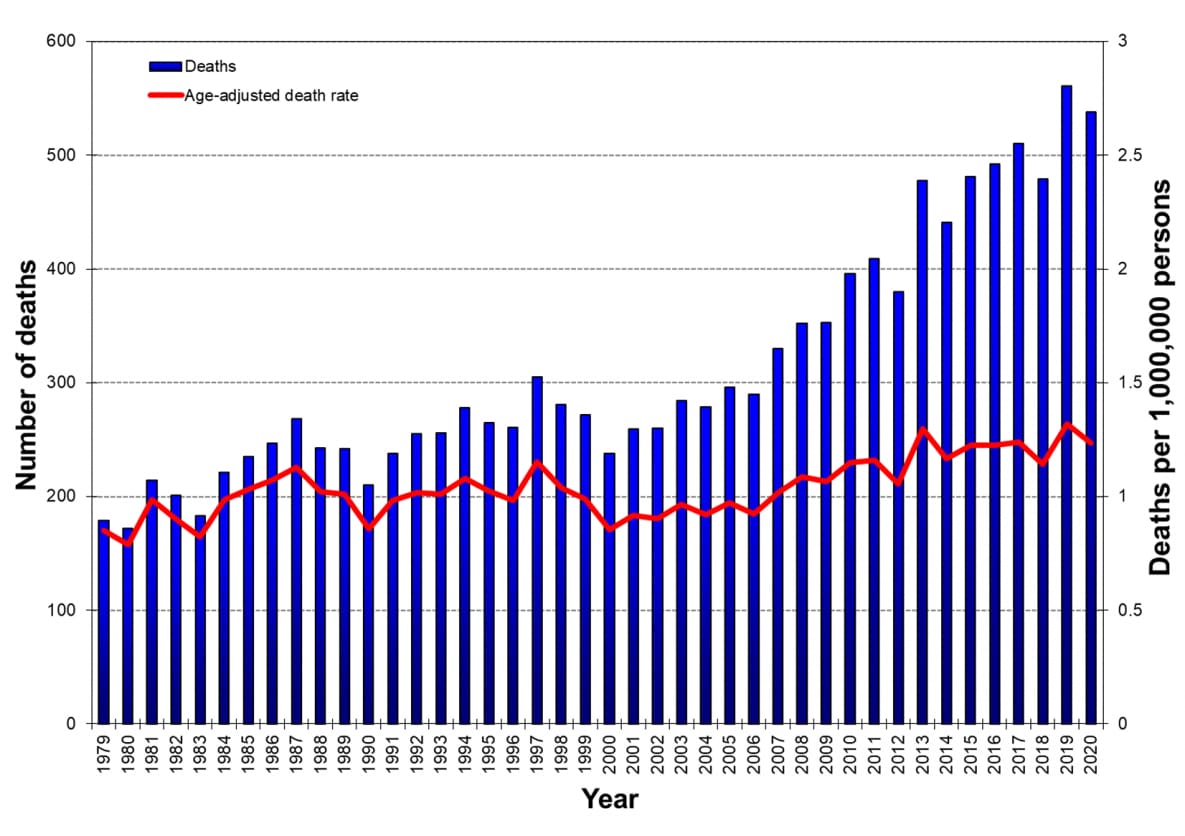
*Deaths obtained from multiple cause-of-death data include all forms of human prion disease and are based on ICD-9 and ICD-10 codes and available computerized literal death certificate data. Some modifications have been made to these data based on relevant information obtained from other surveillance mechanisms. Rates are adjusted to the US standard 2000 projected population.
Case counts include persons with probable CJD based on clinical tests such as a positive real-time quaking-induced conversion (RT-QuIC) provided a prion disease diagnosis is listed on the death certificate. When positive, the RT-QuIC test has been shown to be strongly indicative of prion disease (Rhoads, et al.) and, unless there is an alternative diagnosis, listing prion disease on the death certificate is strongly encouraged. Annual numbers of persons with positive RT-QuIC clinical tests, but lacking brain tissue analyses for disease confirmation, can be found on the National Prion Disease Pathology Surveillance Center website (NPDPSC Tables).
| Year | Deaths (approximate) | Age-adjusted Death Rate |
|---|---|---|
| 1979 | 179 | 0.850 |
| 1980 | 172 | 0.787 |
| 1981 | 214 | 0.988 |
| 1982 | 201 | 0.901 |
| 1983 | 183 | 0.825 |
| 1984 | 221 | 0.985 |
| 1985 | 235 | 1.033 |
| 1986 | 247 | 1.073 |
| 1987 | 268 | 1.129 |
| 1988 | 243 | 1.020 |
| 1989 | 242 | 1.011 |
| 1990 | 210 | 0.859 |
| 1991 | 238 | 0.982 |
| 1992 | 255 | 1.018 |
| 1993 | 256 | 1.012 |
| 1994 | 278 | 1.079 |
| 1995 | 265 | 1.023 |
| 1996 | 261 | 0.984 |
| 1997 | 305 | 1.152 |
| 1998 | 281 | 1.038 |
| 1999 | 272 | 0.990 |
| 2000 | 238 | 0.853 |
| 2001 | 259 | 0.917 |
| 2002 | 260 | 0.904 |
| 2003 | 284 | 0.967 |
| 2004 | 279 | 0.921 |
| 2005 | 296 | 0.972 |
| 2006 | 290 | 0.925 |
| 2007 | 330 | 1.019 |
| 2008 | 352 | 1.086 |
| 2009 | 353 | 1.067 |
| 2010 | 396 | 1.149 |
| 2011 | 409 | 1.161 |
| 2012 | 380 | 1.054 |
| 2013 | 478 | 1.300 |
| 2014 | 441 | 1.168 |
| 2015 | 481 | 1.227 |
| 2016 | 492 | 1.225 |
| 2017 | 510 | 1.241 |
| 2018 | 479 | 1.141 |
| 2019 | 561 | 1.319 |
| 2020 | 538 | 1.235 |