Viewing Oral Health Data by Topic
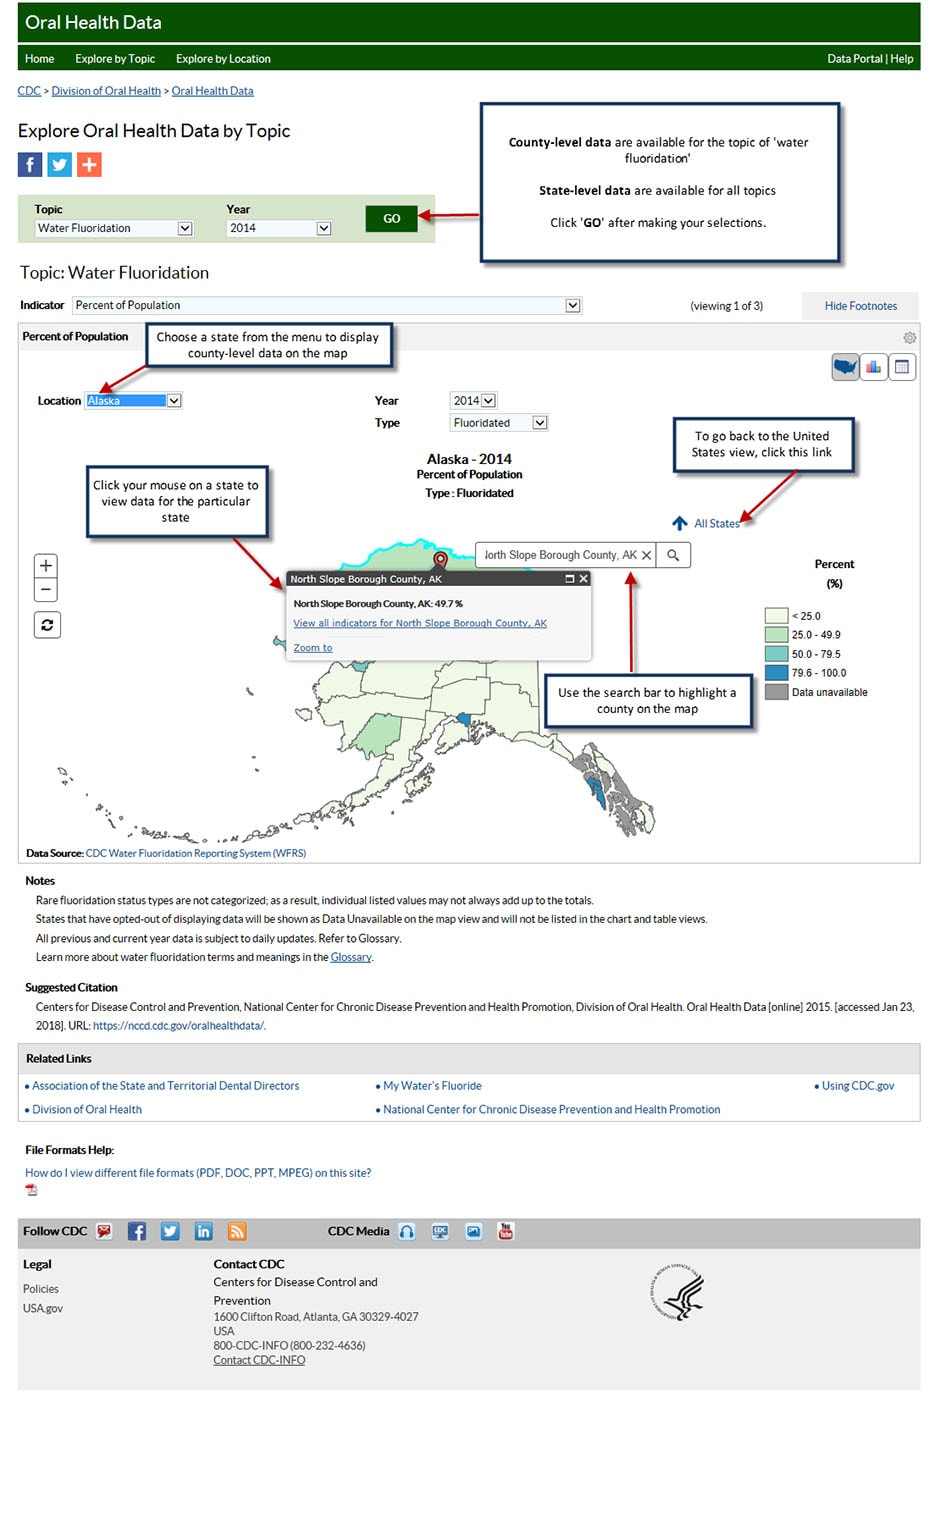
The Explore Oral Health Data by Topic page allows you to view one indicator across all available locations at the national, state, and county levels. Whenever available, you can use the dropdown lists inside the large panel to further filter the data. To begin, select Topic and Year from the respective dropdown lists, and click GO. By default, the system displays the data in map format. You can then view the data as a chart or table. For indicators with available data, the user can also change to view either state or county data.
Viewing a map
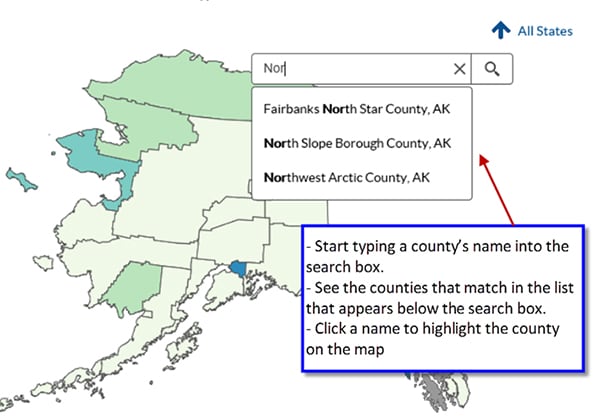
After selecting a topic and year, a color-coded map displays the indicator data. A legend explaining the colors is displayed to the right of the map. To view county-level data for a specific state, select a location from the Location dropdown list. The map will display the county map for the selected state.
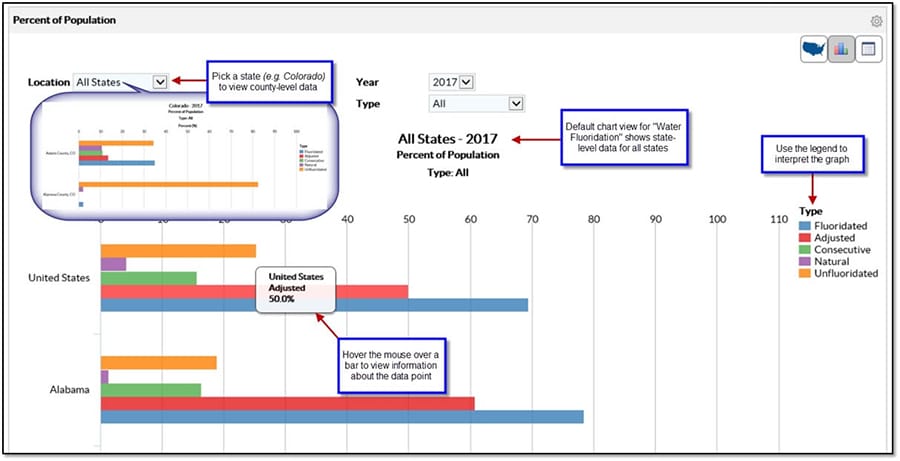
Viewing a chart
You can view data in a bar chart format by clicking the Chart icon next to the Map icon.
Note: If a location does not have data for a particular response, the location is not displayed in the chart. The chart will display county-level data when a state is selected from the Location dropdown list.
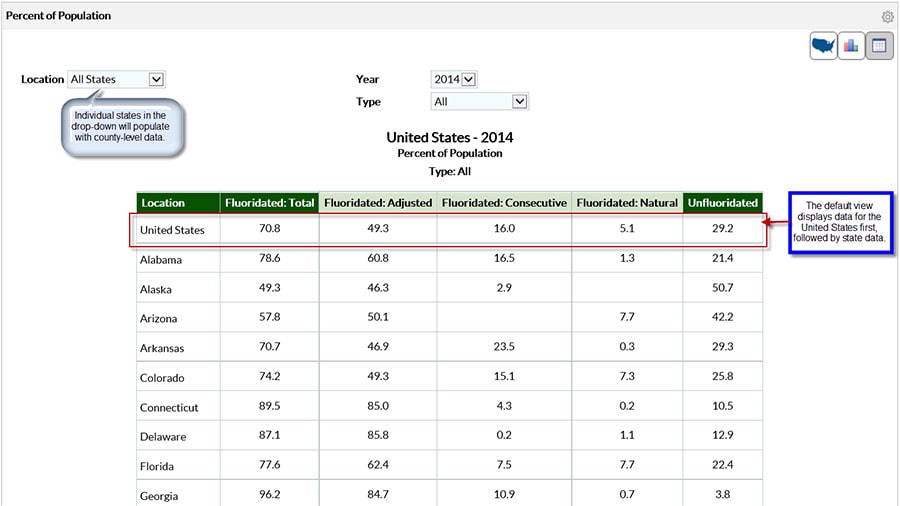
Viewing data in table format
You can view data in table format by clicking the Table icon next to the Chart icon.
Footnotes
The Footnotes section at the bottom of the page provide more information for the content displayed on the page and also explains the symbols displayed on the page.
Measure Definitions
The Measure Definitions section provides a description for the measures that are used on the page.
Related Links
The Related Links section contains links to other sites on the Web. When you click these links, the system takes you to the related sites. These sites are not contained within Oral Health Data.