
Work-Related Roadway Crashes
March 2004
DHHS (NIOSH) Publication Number 2004-137
Roadway crashes are the leading cause of occupational fatalities in the U.S.
Background and Trends
- From 1992 through 2001, roadway crashes were the leading cause of occupational fatalities in the U.S., accounting for 13,337 civilian worker deaths (22% of all injury-related deaths).
- The annual numbers of work-related roadway deaths increased over the decade, despite overall declines in the number and rate of occupational fatalities from all causes. Fatality rates showed little change, hovering around 1 fatality per 100,000 full-time equivalent (FTE) workers [Figure 1].
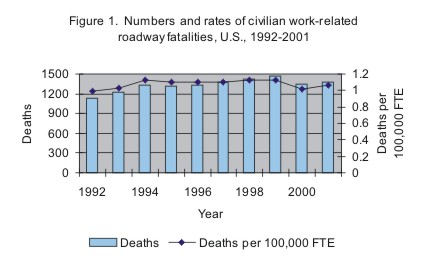
Data source: CFOI.*
Worker Characteristics
- 89% of the victims were male; the fatality rate for males (1.7 deaths per 100,000 FTE) was almost six times higher than the rate for females (0.3).
- The age group with the largest number of roadway crash fatalities was 35-44 year olds (3,275, 25% of crash fatalities) followed closely by 45-54 year olds (2,904, 22%) and 25-34 year olds (2,899, 22%).
- After age 64, crash-related fatality rates increased substantially. Workers 75 years and older had the highest fatality rate of all age groups (6.4 deaths per 100,000 FTE), followed by workers 65-74 years old (3.8).
Data source: CFOI.*
Industry and Occupation Characteristics
- The industry divisions with the highest number of fatalities were Transportation/Communications/Public Utilities (TCPU) (4,358, 33% of the total), Services (1,884, 14%), Construction (1,403, 11%), and Manufacturing (1,093, 8%).
- The highest fatality rates by industry were in TCPU (4.6 deaths per 100,000 FTE), Mining (3.4), and Agriculture/Forestry/Fishing (2.6).
- The occupation divisions with the greatest proportion of fatalities were Transportation/Material Movers (6,212, 47%), Precision Production/Craft/Repairers (1,178, 9%), Sales (975, 7%), and Service (961, 7%).
- The highest fatality rates by occupation were among Transportation/Material Movers (11.1 deaths per 100,000 FTE), Farmers/Foresters/Fishers (2.5), and Laborers (1.4).
- Truck drivers, who are included among Transportation/Material Mover occupations, had a rate of 17.6 deaths per 100,000 FTE, a rate considerably higher than that for this occupation group as a whole.
Data source: CFOI.*
Crash Characteristics
- Work-related crash fatalities most often resulted from collisions between vehicles (49%). Other prominent crash types were single-vehicle incidents that did not involve a collision with another vehicle or with a pedestrian (non-collisions) (26%), and collisions between a vehicle and a stationary object on the roadside (18%).
- 62% of fatalities occurred between 7 a.m. and 4 p.m.; 38% occurred on U.S. or State-designated highways, 26% on interstate highways, and 24% on a local road or street.
Data source: CFOI.*
Vehicles
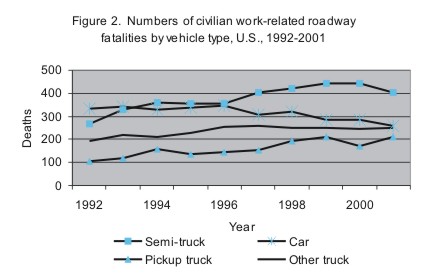
- Vehicles occupied by fatally injured workers were most often semi-trucks (3,780, 28%), cars (3,140, 24%), other and unspecified trucks (2,359, 18%), and pickup trucks (1,607, 12%). [Data source: CFOI.*]
- Between 1992 and 2001, truck occupant deaths increased, as car occupant deaths decreased [Figure 2]. [Data source: CFOI.*]
- 62% of vehicles occupied by a fatally injured worker were registered to a business or government, 17% were registered to the driver, and 12% to an individual other than the driver. [Data source: FARS. †]
- Crashes involving large trucks (more than 10,000 lb. gross vehicle weight rating) were 7 times as likely to be fatal to other motorists as to truck occupants. An average of 4,425 motorists involved in collisions with large trucks died each year from 1992 through 2001, compared to 681 large-truck occupants. [Data source: Traffic Safety Facts 2001. ‡]
Data source: CFOI.*
Vehicle Occupants and Drivers
- Between 1997 and 2002, 28% of fatally injured workers were wearing a seat belt; 56% were unbelted or had no seat belt available. Belt use was unknown for the remaining 16%.
- Factors associated with the worker’s vehicle that contributed to the crash included: running off the road or failing to stay in the proper lane (46%); driving over the speed limit or too fast for conditions (23%); driver inattention (11%); and the driver being drowsy or asleep (7%). NOTE: Up to four factors may be reported for each vehicle.
- In 8% of crashes fatal to a worker, the driver of the worker’s vehicle was determined to have been drinking.
Data source: FARS.†
Data sources
Occupational fatality data
*Census of Fatal Occupational Injuries (CFOI), 1992-2001 (special research file prepared for NIOSH by the Bureau of Labor Statistics; excludes New York City).
†Fatality Analysis Reporting System (FARS), 1997-2002; National Highway Traffic Safety Administration (NHTSA) (public-use microdata files).
Data on large truck-related fatalities ‡ Traffic Safety Facts 2001 [NHTSA]. Publication DOT HS 809 484 (December 2002).
Employment data used to calculate fatality rates
Current Population Survey, 1992-2001 (microdata files).
Work-Related Roadway Crashespdf icon [PDF – 78 KB]