
NCHS Data Detectives Camp
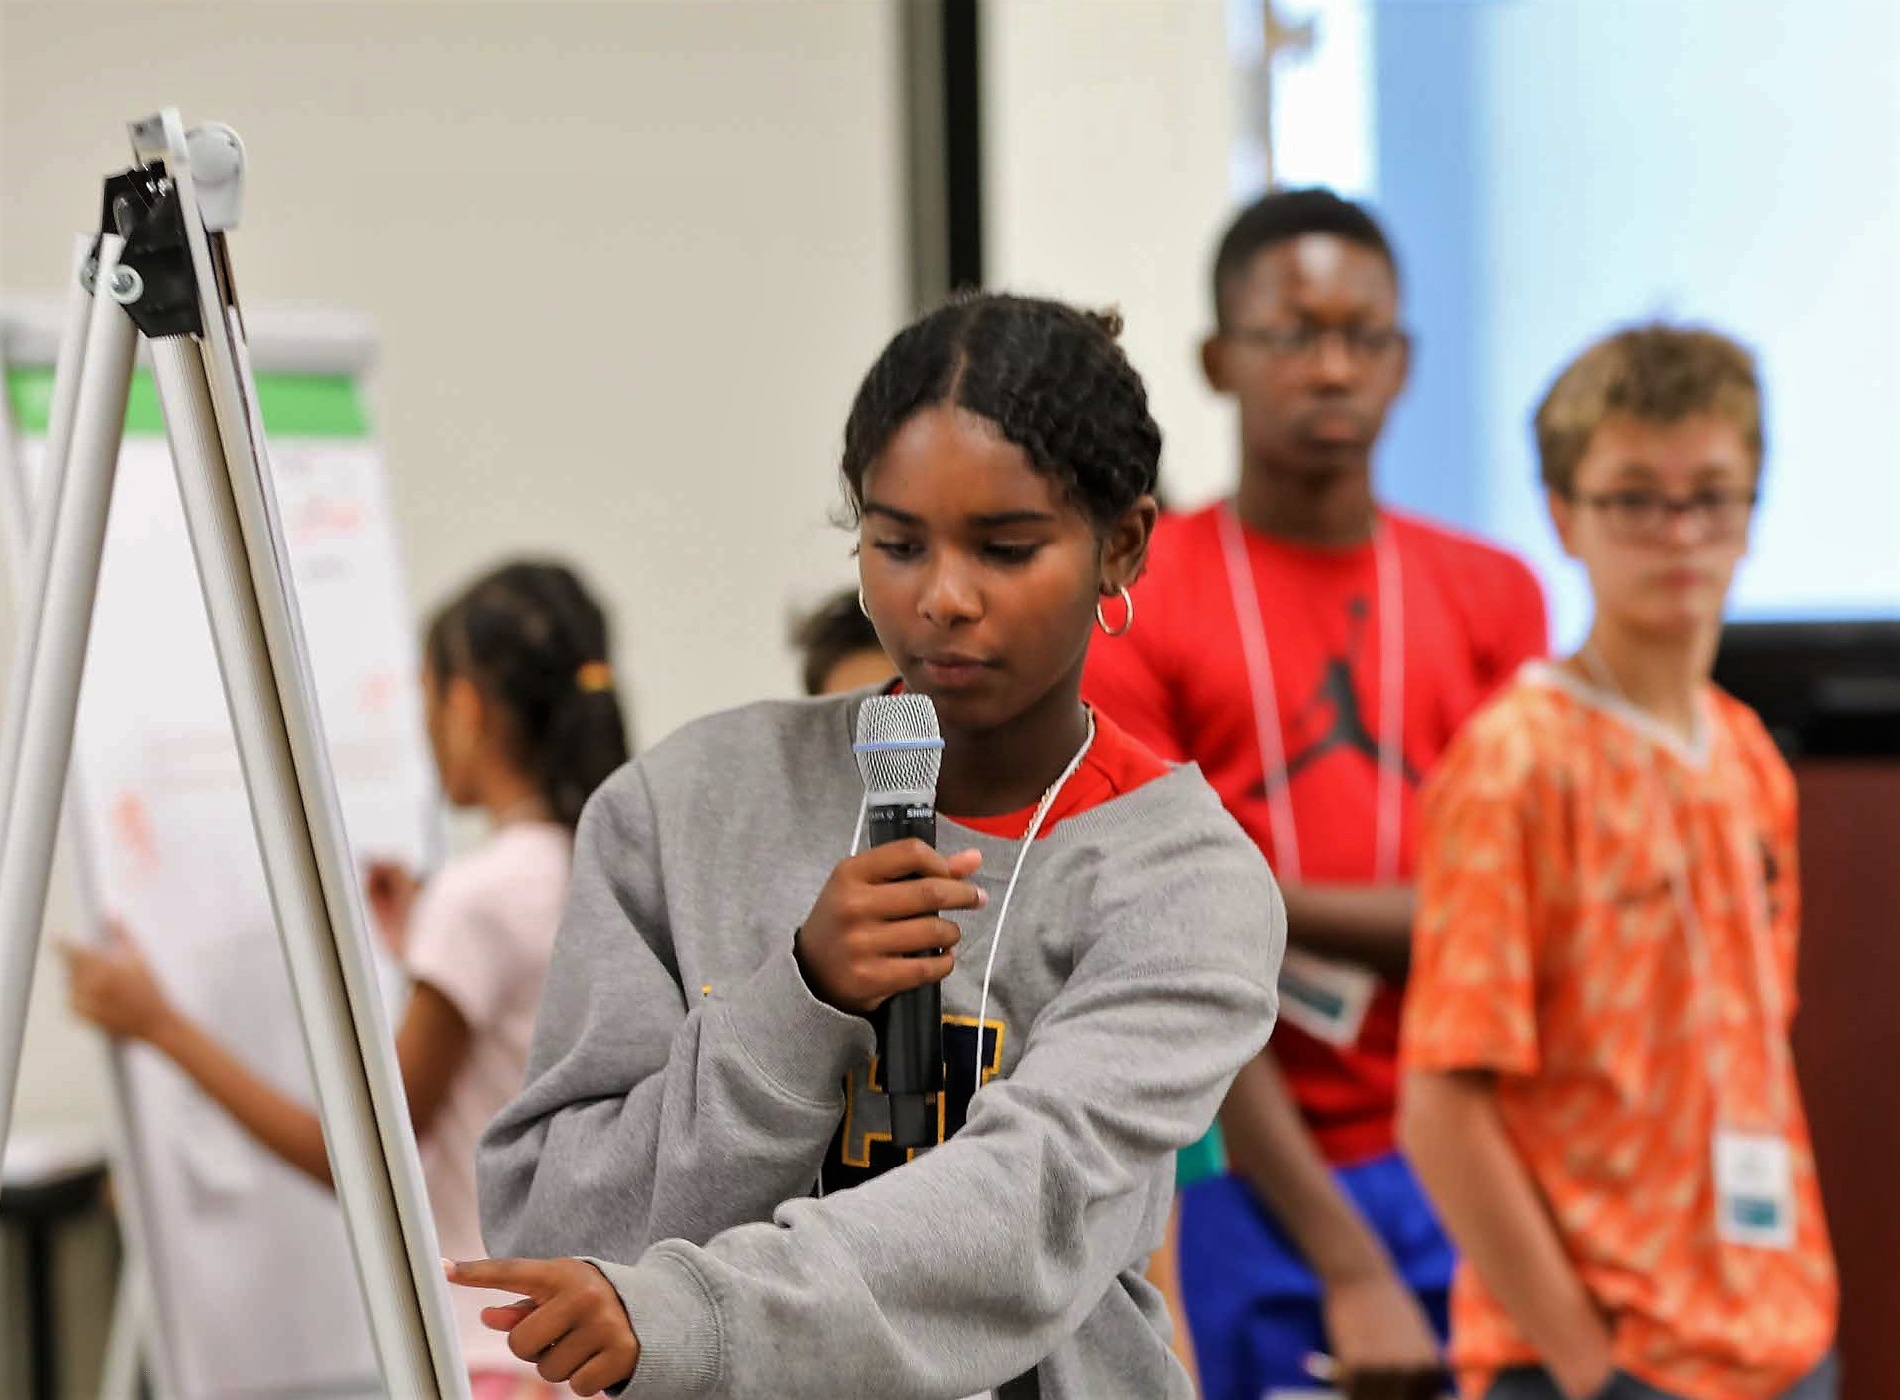
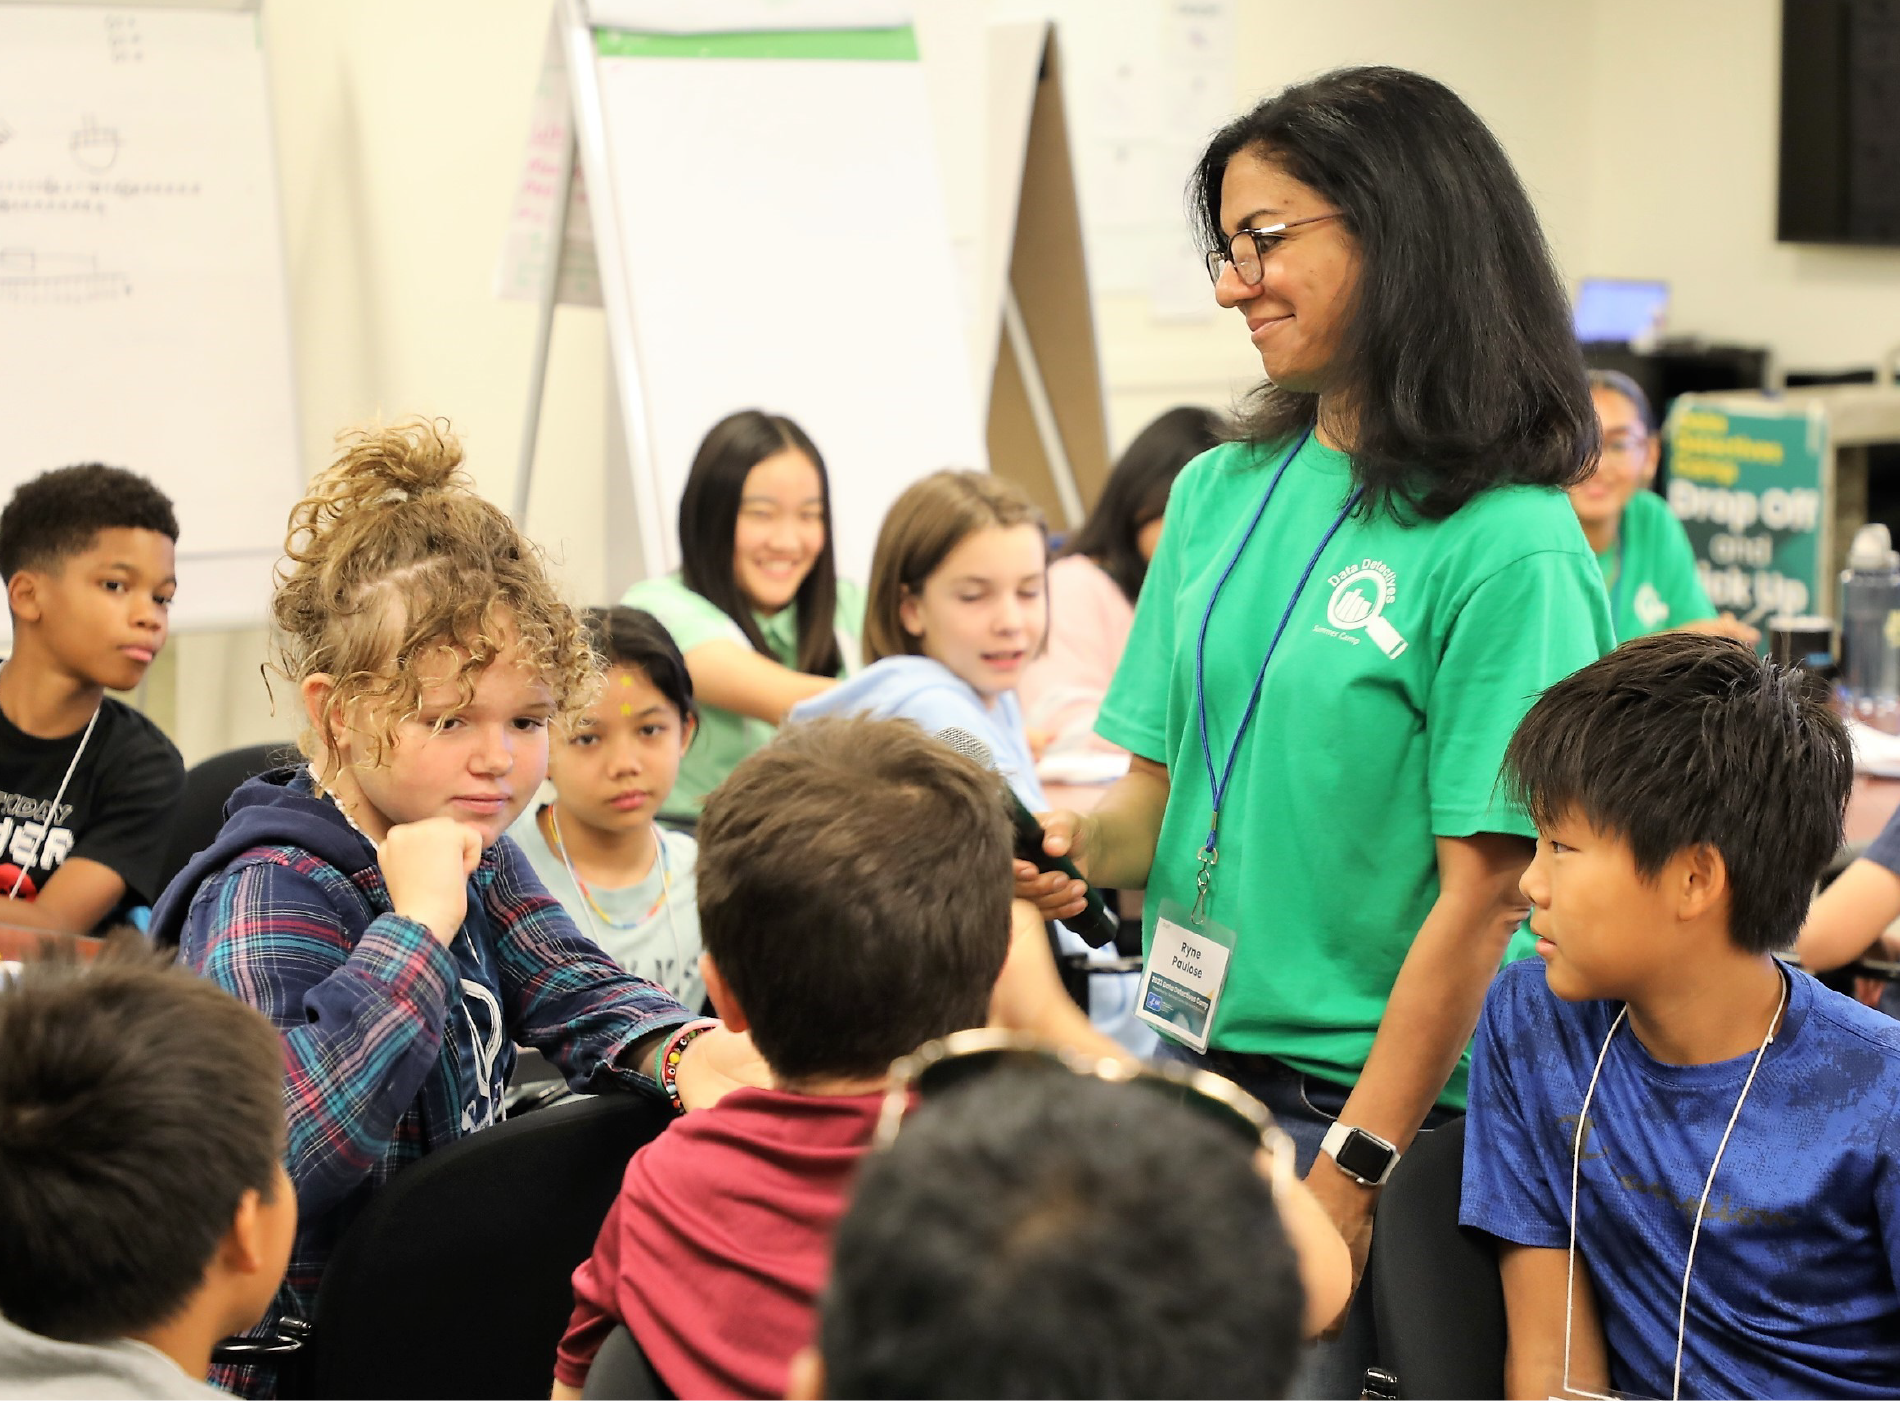
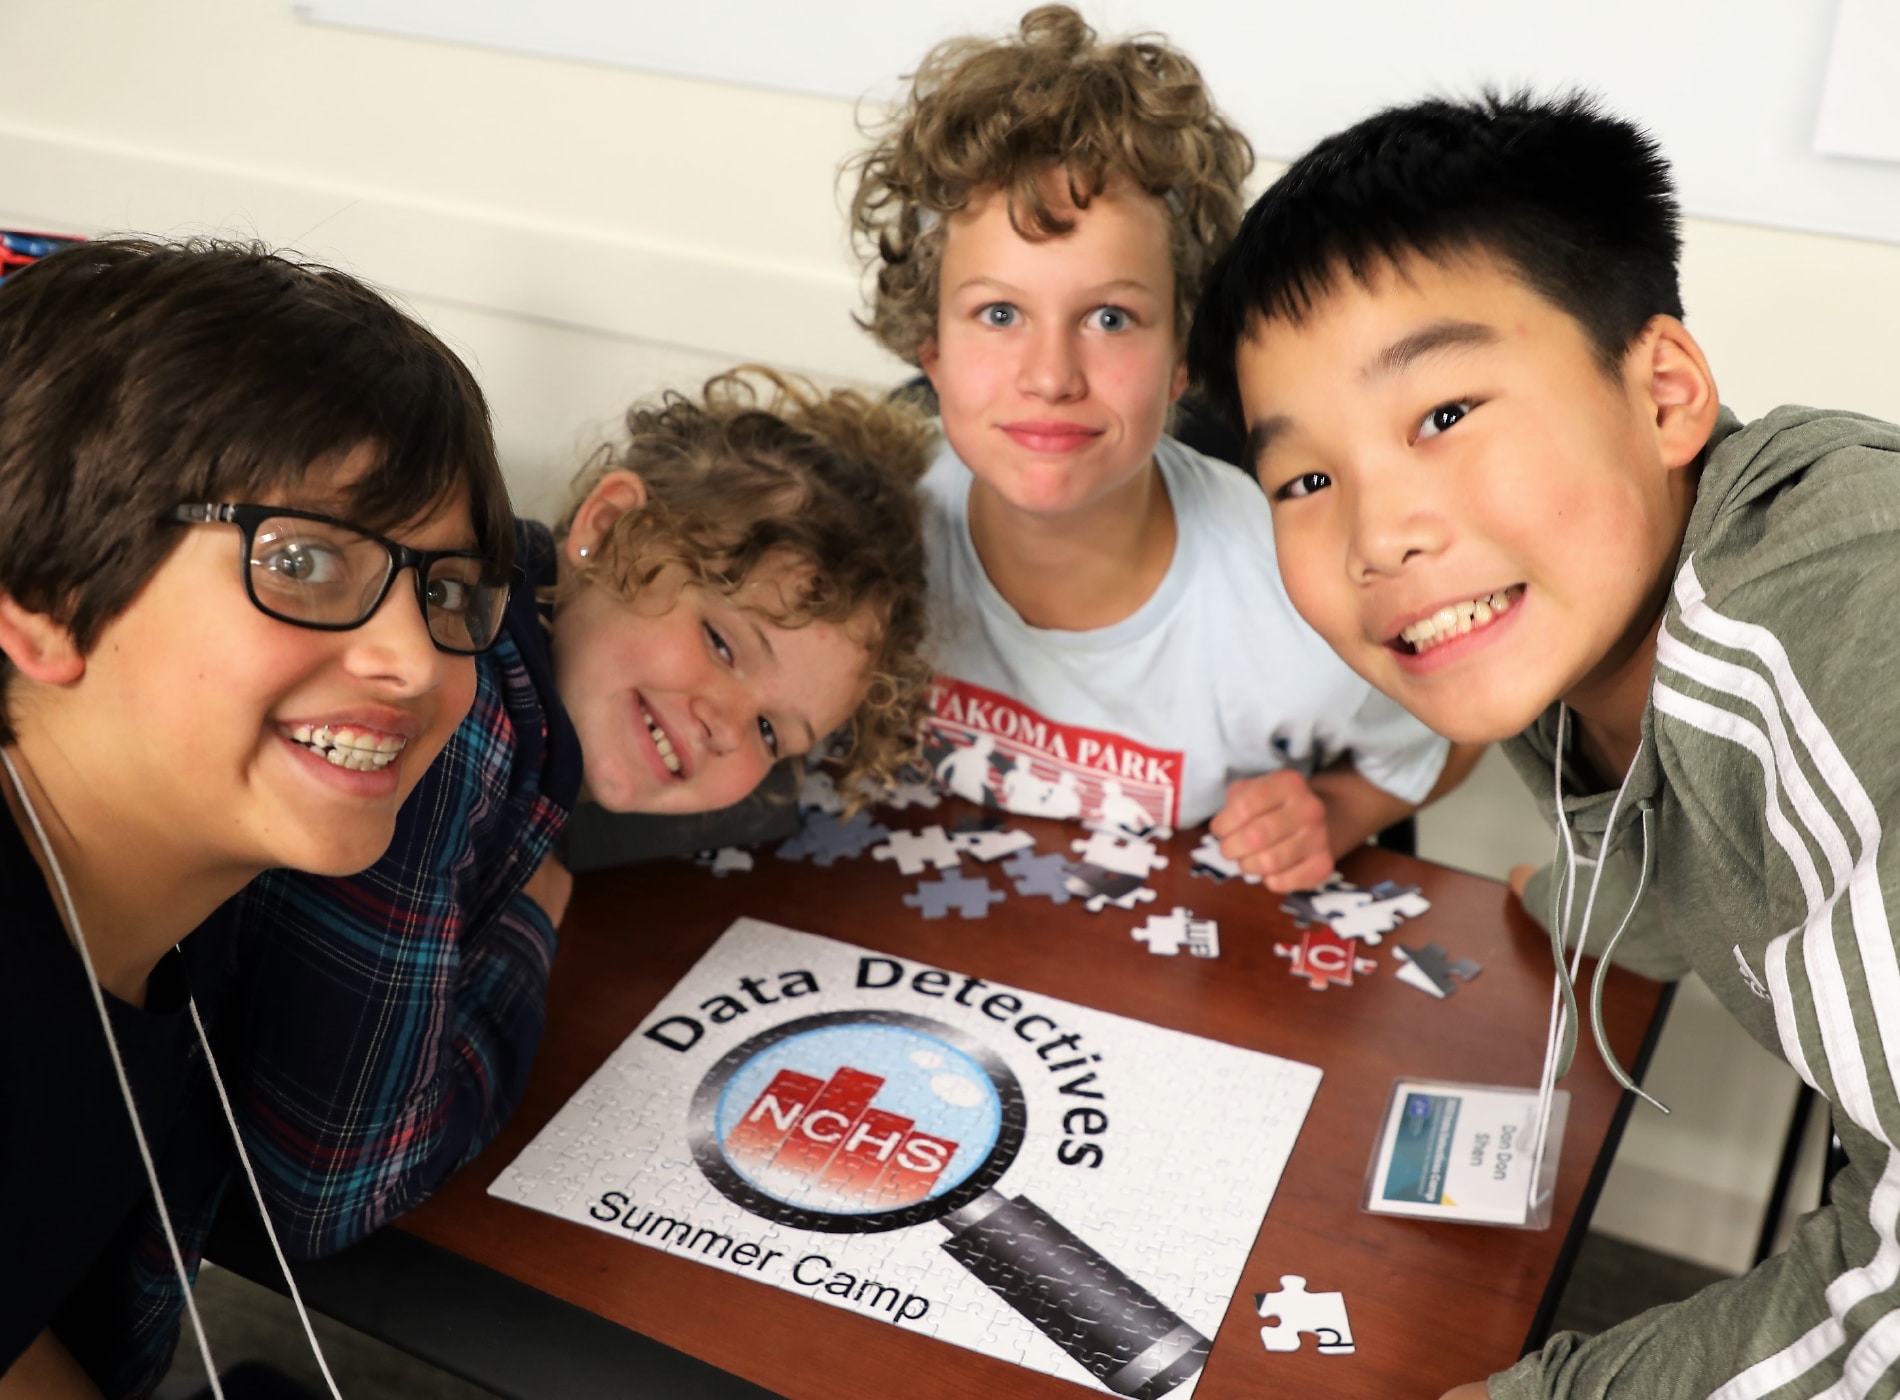
The Data Detectives Camp, conducted by CDC’s National Center for Health Statistics, is an opportunity for rising 6th and 7th grade students to learn about statistics and science in a fun, hands-on way. The free, commuter camp was held in two locations in 2024:
- Atlanta, Georgia
CDC Headquarters
July 8–July 12
9 a.m.–4 p.m.
- Hyattsville, Maryland
NCHS Headquarters
July 29–August 2
9 a.m.–4 p.m.
NCHS Data Detectives builds STEM confidence and skills, especially in data science areas. Campers also learn how to think critically, solve problems, work with others, and think like Data Detectives.
Distribution and Outliers
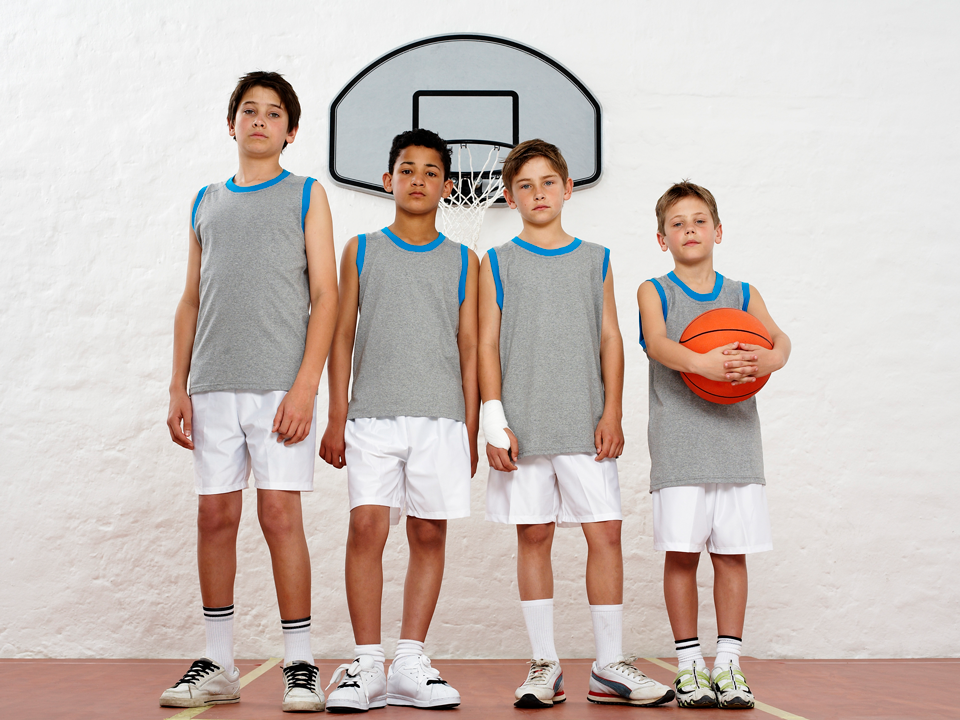
Learn about distributions by examining the height of fellow campers. See how a 7-foot-tall basketball player throws off the average height of the class.
Visualizing Data
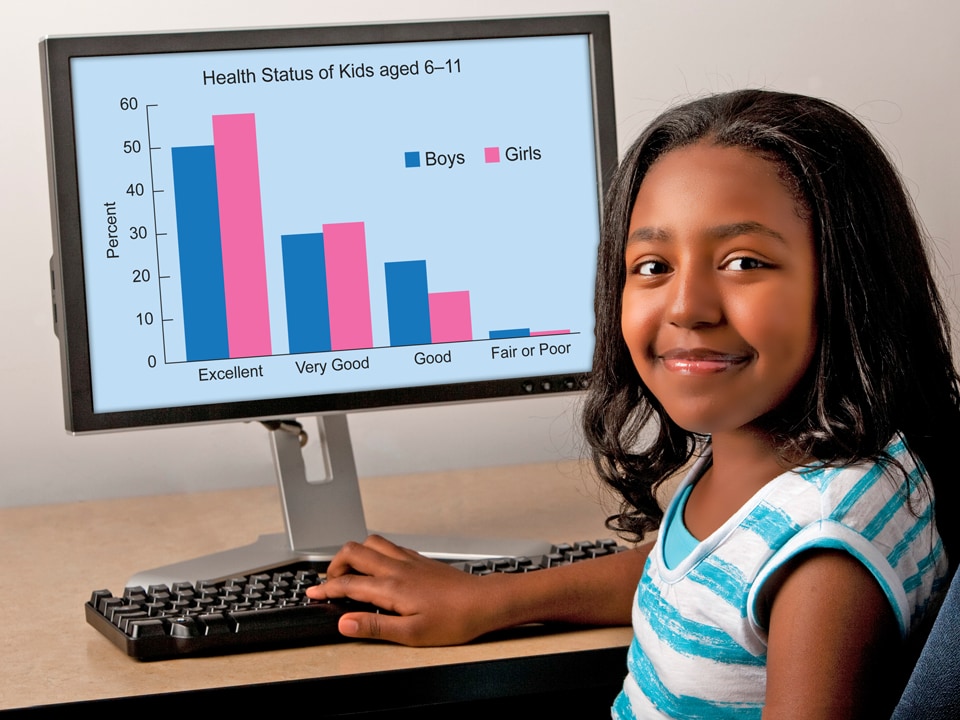
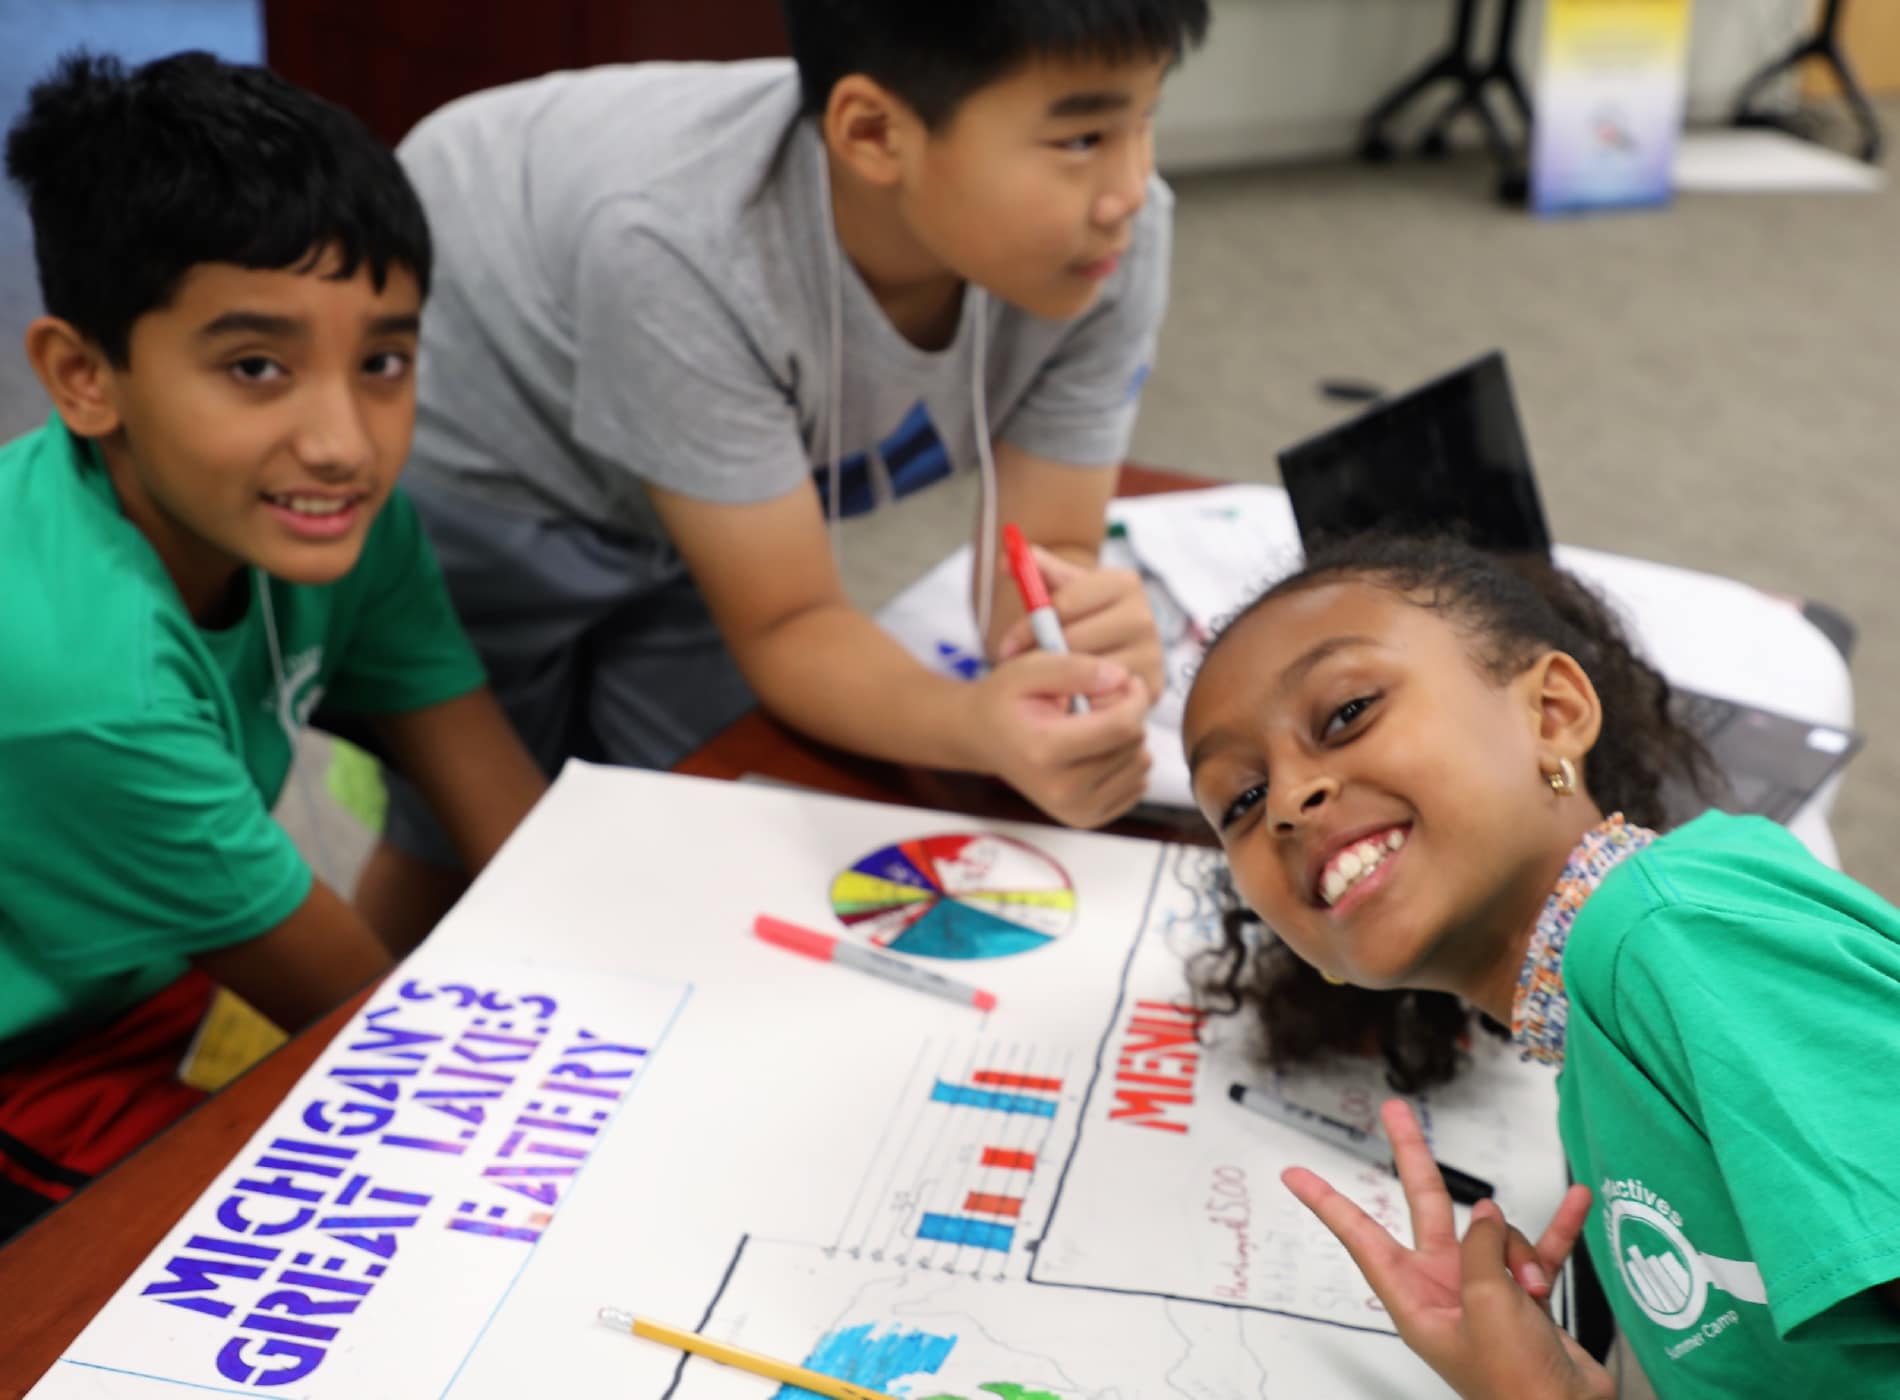
Learn to display your data through figures and charts. How does data visualization allow you to interpret your data and draw conclusions?
Comparisons and Predictions

Collect data and analyze it to draw comparisons between variables, such as number of siblings and arm span. Can you draw any conclusions?
Game Day Friday
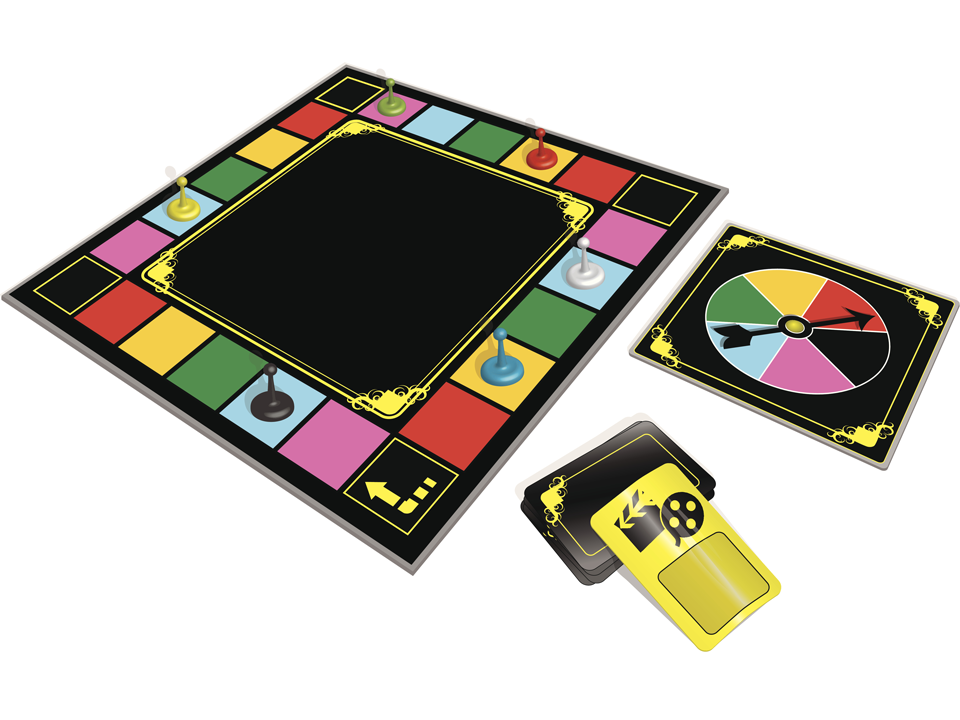
Review the concepts you learned on the last day of camp with fun, group trivia games.
The Data Detectives Camp is led by NCHS staff with expertise in diverse public health disciplines. They are supported by volunteers from CDC and partner organizations that have made Data Detectives Camp successful since 2016.

Dr. Paulose is the camp founder. She is an epidemiologist by training and was the Director and Associate Director for Science for the Division of Health and Nutrition Examination Surveys at NCHS. Dr. Paulose was also a director at Pfizer, Inc. in health economics and outcomes research. She enjoys creating fun approaches to teaching children statistics.
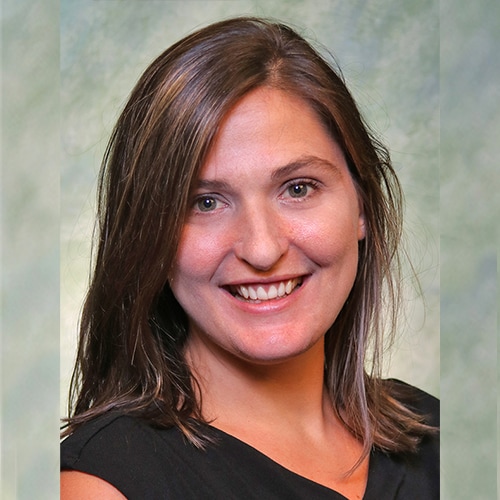
Ms. Jones has been a camp instructor since 2024. She is a communication expert at NCHS. In this role, she finds ways to communicate data science in compelling and interesting ways. Ms. Jones has also served as the lead health communication specialist on several major NCHS projects. She loves finding ways to make science fun and interesting to students.

Dr. Martinez helped design the camp’s statistical curriculum and has been a camp instructor since 2016. She is a statistician demographer in the Division of Health Interview Statistics at NCHS. Dr. Martinez brings years of experience teaching, overseeing data collection for surveys, and researching fertility and reproductive health. She loves teaching kids all about data and pivot tables.

Ms. McAllister has been a camp instructor since 2017. She is a survey statistician in the Division of Health and Nutrition Examination Surveys at NCHS. Ms. McAllister came to NCHS to oversee a national survey on hospital-based victim services. Her background is in criminology.
The Data Detectives Camp is conducted by NCHS in collaboration with various statistical organizations, universities, and federal agencies. These partnerships are invaluable for developing and growing the camp. Partner contributions vary, but include assisting with developing lectures and extracurricular activities, providing camp space, funding camp materials, serving as camp counselors, and much more.


The Data Detectives wordmark and the Data Detectives design mark are trademarks of the U.S. Department of Health and Human Services. Unauthorized use of the marks is strictly prohibited.