COVID-19 Science Update released: October 22, 2021 Edition 110

The COVID-19 Science Update summarizes new and emerging scientific data for public health professionals to meet the challenges of this fast-moving pandemic. Weekly, staff from the CDC COVID-19 Response and the CDC Library systematically review literature in the WHO COVID-19 database, and select publications and preprints for public health priority topics in the CDC Science Agenda for COVID-19 and CDC COVID-19 Response Health Equity Strategy.
Section headings in the COVID-19 Science Update have been changed to align
with the CDC Science Agenda for COVID-19.
Here you can find all previous COVID-19 Science Updates.
PEER-REVIEWED
Effect of Delta variant on viral burden and vaccine effectiveness against new SARS-CoV-2 infections in the UK. Pouwels et al. Nature Medicine (October 14, 2021).
Key findings:
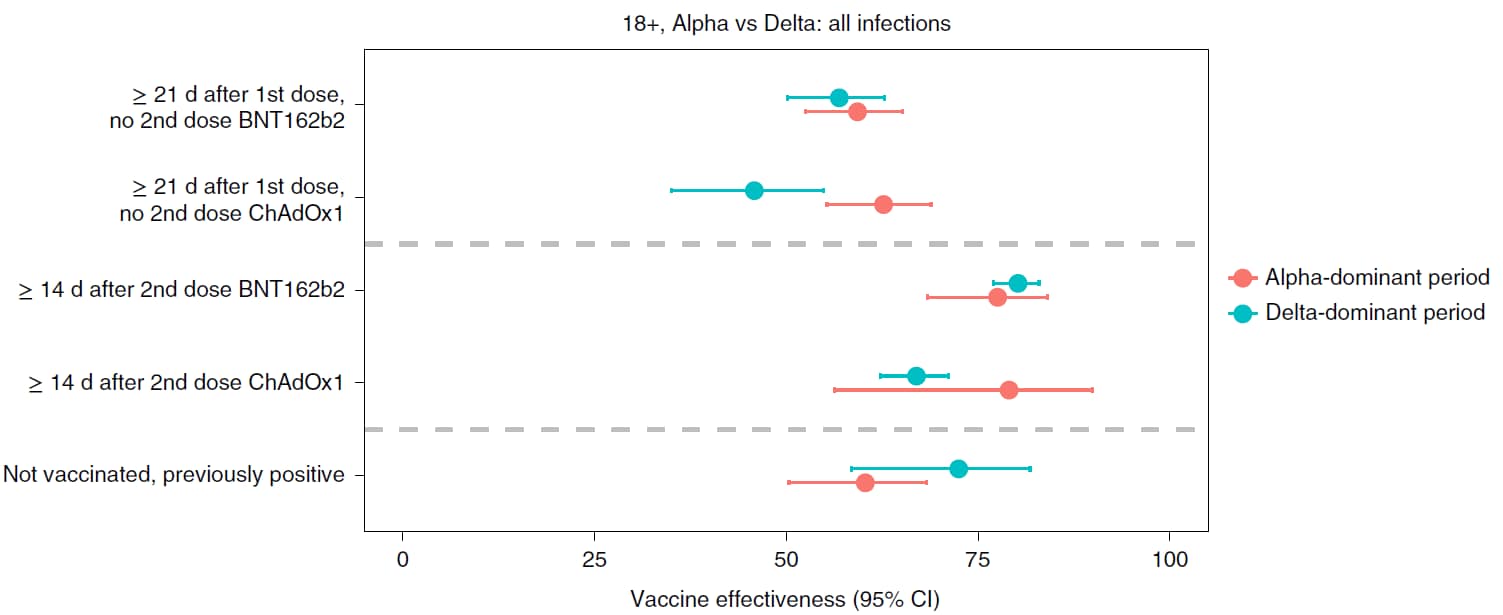
- Vaccine effectiveness (VE) against new SARS-CoV-2 infections ≥14 days after the 2nd dose of either BNT162b2 (Comirnaty, Pfizer/BioNTech) or ChAdOx1 (Oxford-AstraZeneca) during the Delta (B.1.617.2) period was similar to the VE during the Alpha (B.1.1.7) period (Figure).
- VE against SARS-CoV-2 infections with high viral burden and symptomatic infections was reduced 10–13% (BNT162b2) and 16% (ChAdOx1) from the Delta to the Alpha period.
- During the Delta period, SARS-CoV-2 infections after 2 doses of either BNT162b2 or ChAdOx1 had similar Ct values as infections in unvaccinated adults.
Methods: Large longitudinal community-based study of randomly selected households to examine COVID-19 vaccine effectiveness among adults ≥18 years (n = 384,543), United Kingdom, December 1, 2020–August 1, 2021. Outcomes included new PCR-positive cases, Ct values (<30 or ≥30), and symptoms. Limitations: Observational; sample size of available comparators (unvaccinated and no prior infections) declined over time; no information on severe outcomes.
Implications: Vaccine effectiveness of BNT162b2 was robust during the Delta period yet modest declines were observed for some infections. Vaccination remains a centerpiece of protection against SARS-CoV-2 and the Delta viral variant.
Figure:
Note: Adapted from Pouwels et al. Vaccine effectiveness (VE) against all new PCR-positive cases in adults ≥18 years in the Alpha and Delta periods. All estimates (VE = 100% × (1 odds ratio)) from a generalized linear model with a logit link compared to reference category of “Not vaccinated, not previously positive, and ≥21 days before vaccination” and using clustered robust standard errors. Error bars represent 95% CIs. Licensed under CC BY 4.0.
PREPRINTS (NOT PEER-REVIEWED)
Heterologous SARS-CoV-2 booster vaccinations – preliminary report. Atmar et al. medRxiv (October 13, 2021). Published in NEJM as Homologous and heterologous COVID-19 booster vaccinations (March 17, 2022).
Key findings:
- Following homologous or heterologous booster vaccinations, reported reactions (injection site pain, malaise, headache, and myalgia) were similar to those reported after the primary vaccination series.
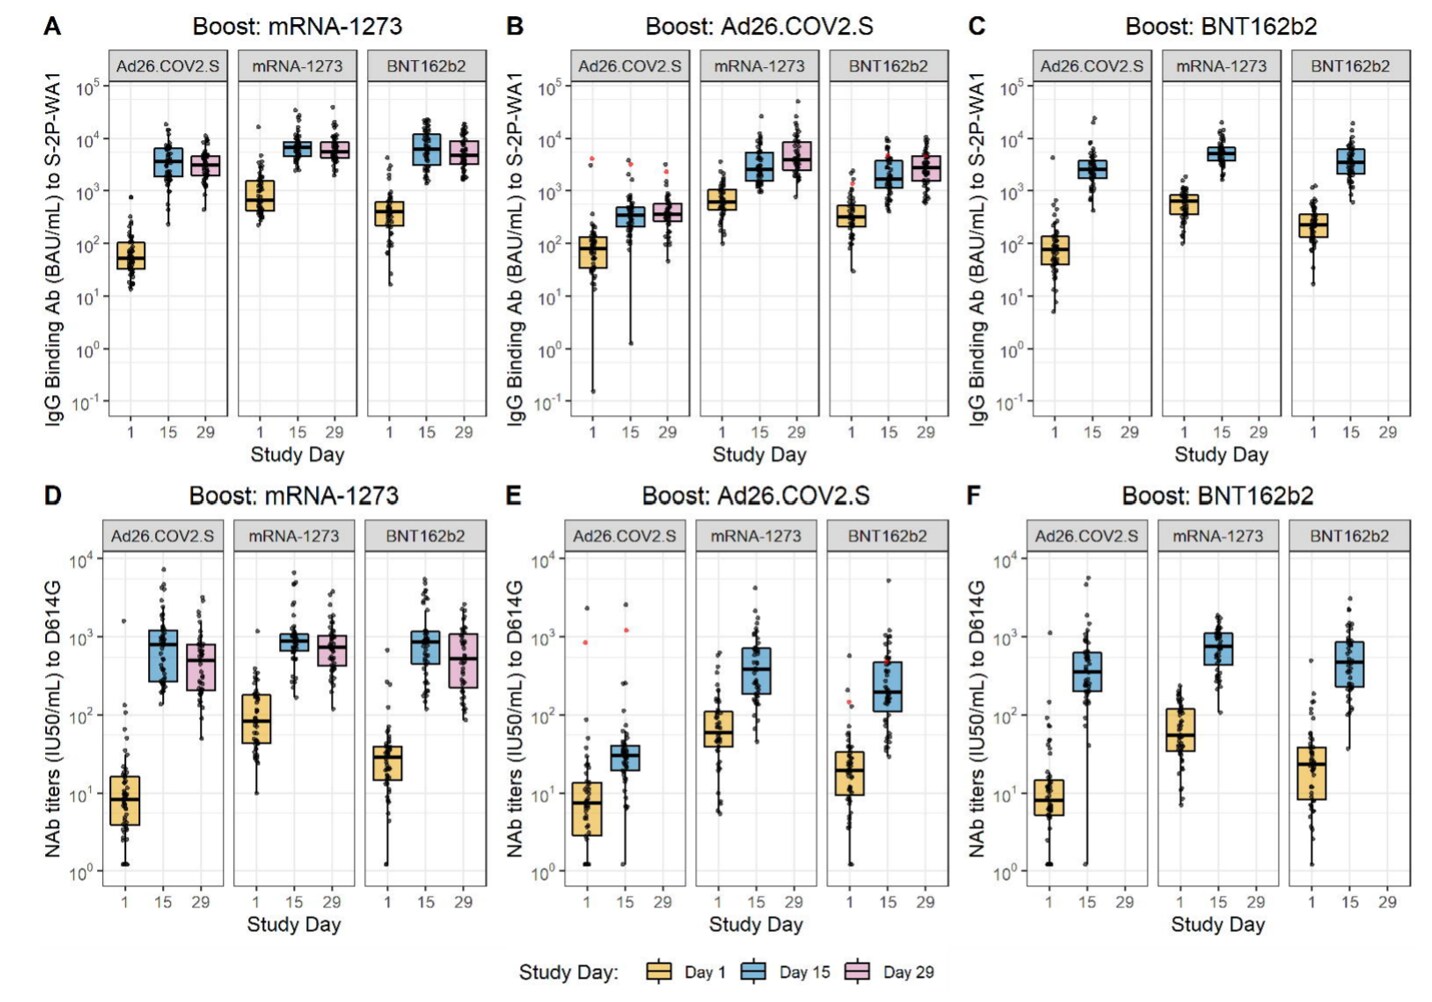
- Booster vaccines, including heterologous mRNA vaccine boosters, increased neutralizing activity for all vaccine combinations (Figure).
Methods: In a phase 1/2 clinical trial at 10 U.S. sites, 458 persons who were vaccinated ≥12 weeks prior with mRNA-1273 (Moderna), Ad26.COV2.S (Johnson & Johnson/Janssen), or BNT162b2 (Comirnaty, Pfizer/BioNTech) were given a booster vaccine of mRNA-1273 100 μg, Ad26.COV2.S 5×10¹⁰ virus particles, or BNT162b2 30 μg. Post-booster safety, reactogenicity, and immune response at 15 and 29 days were assessed. Limitations: Small sample size; non-randomized; brief follow-up period.
Implications: Homologous and heterologous COVID-19 vaccine boosters appeared to be safe and stimulated immune responses.
Figure:
Note: Adapted from Atmar et al. SARS-CoV-2 IgG binding antibody titers (A–C) and neutralization antibody titers (D–F) at Study Day 1 (baseline), Study Day 15 (post-boost), and Study Day 29 (subset analysis; day 29 data not available for all groups). Box plots represent median and 25th and 75th percentiles and the whiskers drawn to the value nearest to, but within, 1.5 times the interquartile range below and above the 25th and 75th percentile, respectively. Licensed under CC-BY-NC-ND 4.0.
Breakthrough SARS-CoV-2 infections after vaccination in North Carolina. Uschner et al. medRxiv (October 13, 2021).
Key findings:
- 1.9% (310/16,020) of fully vaccinated persons reported a subsequent positive SARS-CoV-2 test (event rate of 7.3 infections per 100,000 person-years).
- Among fully vaccinated persons followed for 34 weeks, cumulative incidence of symptomatic breakthrough infection was 5.2% at 34 weeks (Figure).
- Rates were higher among persons vaccinated with Ad26.COV2.S (Johnson & Johnson/Janssen), from rural areas, and aged <45 years.
Methods: Prospective observational cohort study of adults aged ≥18 years in 6 healthcare systems in North Carolina, September 24–January 13, 2021. Participants completed daily online surveys of symptoms, SARS-CoV-2 testing, and vaccination. Outcome was self-reported SARS-CoV-2 infection ≥2 weeks after vaccination. Limitations: Self-reported symptoms and test results; variable follow-up duration; incomplete follow-up.
Implications: SARS-CoV-2 infection following full vaccination was infrequent. Younger adults and those vaccinated with Ad26.COV2.S, among whom breakthrough infections occurred more commonly, may benefit from combining vaccination with additional prevention approaches, such as consistent mask use.
Figure:
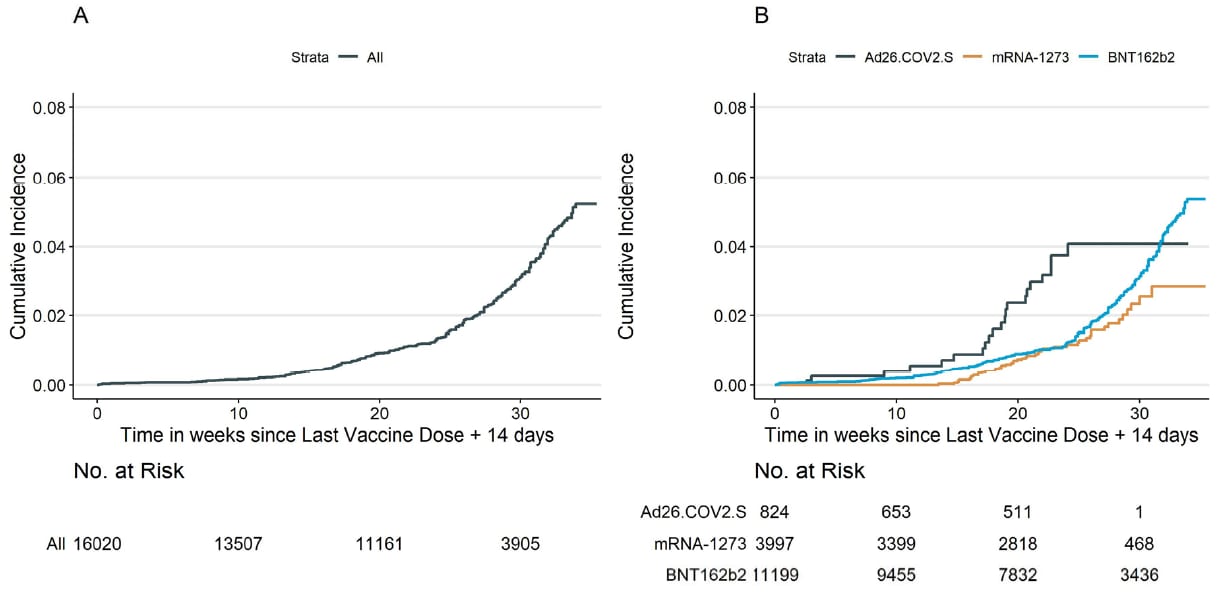
Note: Adapted from Uschner et al. Cumulative incidence curves (1 minus the unadjusted Kaplan-Meier risk) for the first self-reported symptomatic infection with positive SARS-CoV-2 test, ≥2 weeks after full vaccination. A) all participants; B) stratified by vaccine type (Ad26.COV2.S, mRNA-1273, BNT162b2). Sample sizes at each time point are displayed beneath the figures. Licensed under CC-BY-NC-ND 4.0.
Differentiation of SARS-CoV-2 naturally infected and vaccinated individuals in an inner-city emergency department. Beck et al. medRxiv (October 14, 2021). Published in Journal of Clinical Microbiology as Differentiation of individuals previously infected with and vaccinated for SARS-CoV-2 in an inner-city emergency department (March 16, 2022).
Key findings:
- The sensitivity and specificity of a testing algorithm for identifying vaccinated persons were 100% (95% CI 99.1%-100.0%) and 98.9% (95 Cl 98.2%-99.3%), respectively.
- The sensitivity and specificity for identifying previously infected persons were 84.4% (95% CI 80.9%-87.5%) and 100% (95% CI 99.7%-100.0%).
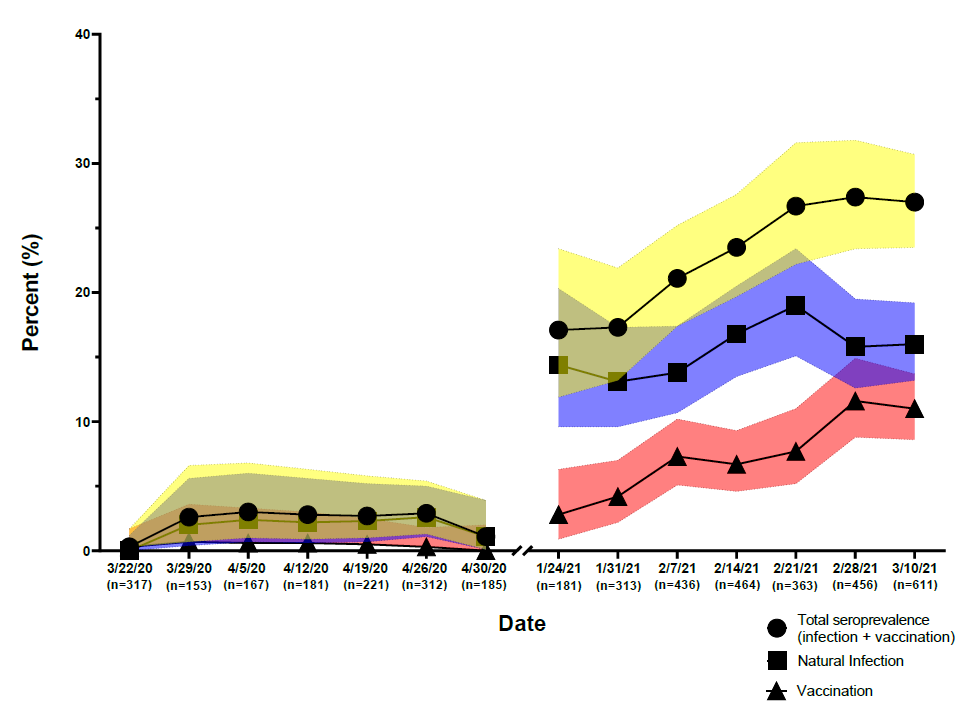
- Among patients in a Baltimore ED, overall seroprevalence of antibodies to SARS-CoV-2 increased from 1.6% (95% CI 1.1%-2.5%) in early 2020 to 23.8% (95% CI 22.2%-25.4%) in early 2021 (Figure).
- In spring 2020, a similar proportion of Hispanic patients and non-Hispanic patients had been infected.
- By spring 2021, a higher proportion of Hispanic patients than non-Hispanic patients had been infected (aOR = 3.31 [95% CI 2.16, 5.07]).
Methods: Using 1,914 samples with known exposure status, a testing algorithm was developed to differentiate previous infection from vaccination by detecting antibodies to spike, spike glycoprotein receptor binding domain, and nucleocapsid targets with commercially available serologic assays. Algorithm was used on 4,360 samples (March–April 2020 and January–March 2021). Limitations: Antibody reactivity may differ over time and by age and illness severity; persons with known breakthrough infections were not tested.
Implications: Seroprevalence and vaccine coverage estimates may be refined with the use of algorithm based on serologic results, particularly when vaccination and infection history data are unavailable.
Figure:
Note: Adapted from Beck et al. Seroprevalence of antibodies to SARS-CoV-2 (total, from natural infection, and from vaccination), 2020–2021, according to date sample was drawn. U.S. Government work not subject to copyright.
PEER-REVIEWED
Associations between HIV infection and clinical spectrum of COVID-19: A population level analysis based on US National COVID Cohort Collaborative (N3C) data. Yang et al. The Lancet HIV (October 13, 2021).
Key findings:
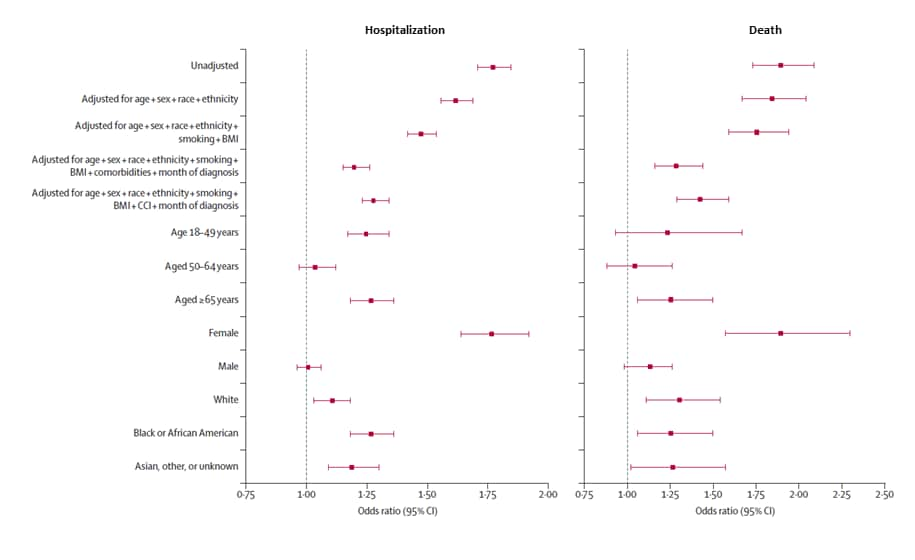
- Among COVID-19 cases, people with HIV were more likely than people without HIV to be hospitalized (adjusted OR [aOR] 1.20, 95% CI 1.15-1.26) and die (aOR 1.29, 95% CI 1.16-1.44) (Figure)
- People with HIV were less likely to have mild/moderate illness (aOR 0.61, 95% CI 0.59-0.64).
- Among people with HIV, lower CD4 cell counts (<200 cells per μL) were associated with higher risks for severe disease, hospitalization, and death.
- Viral suppression was associated with reduced risk of hospitalization.
Methods: Data from the U.S. National COVID Cohort Collaborative (1,436,622 adult COVID-19 cases, including 13,170 among individuals with HIV), January 1, 2020–May 8, 2021. Association between HIV, immune markers (CD4 count, viral load), demographics, and comorbidities with COVID-19 clinical outcomes were estimated. Limitations: May not be generalizable to all persons with COVID-19 or HIV; electronic health record data were incomplete or non-standardized.
Implications: The higher risk of hospitalization and death among persons living with HIV highlights a need to strengthen COVID-19 prevention for and to improve clinical outcomes among people with HIV, particularly among those with greatest immunodeficiency.
Figure:
Note: Adapted from Yang et al. Estimates of the association between HIV status and COVID-19 hospitalization (left) and death (right) from multiple models. Stratified models (by age, sex, and race) were adjusted for age, sex, race, ethnicity, smoking, BMI, and individual comorbidities. BMI = body-mass index; CCI = Charlson Comorbidity Index. Reprinted from The Lancet HIV, October 4, 2021, Yang et al., Associations between HIV infection and clinical spectrum of COVID-19: A population level analysis based on US National COVID Cohort Collaborative (N3C) data, online ahead of print. Copyright 2021, with permission from Elsevier.
PEER-REVIEWED
The association of opening K–12 schools with the spread of COVID-19 in the United States: County-level panel data analysis. Chernozhukov et al. PNAS (October 19, 2021).
Key findings:
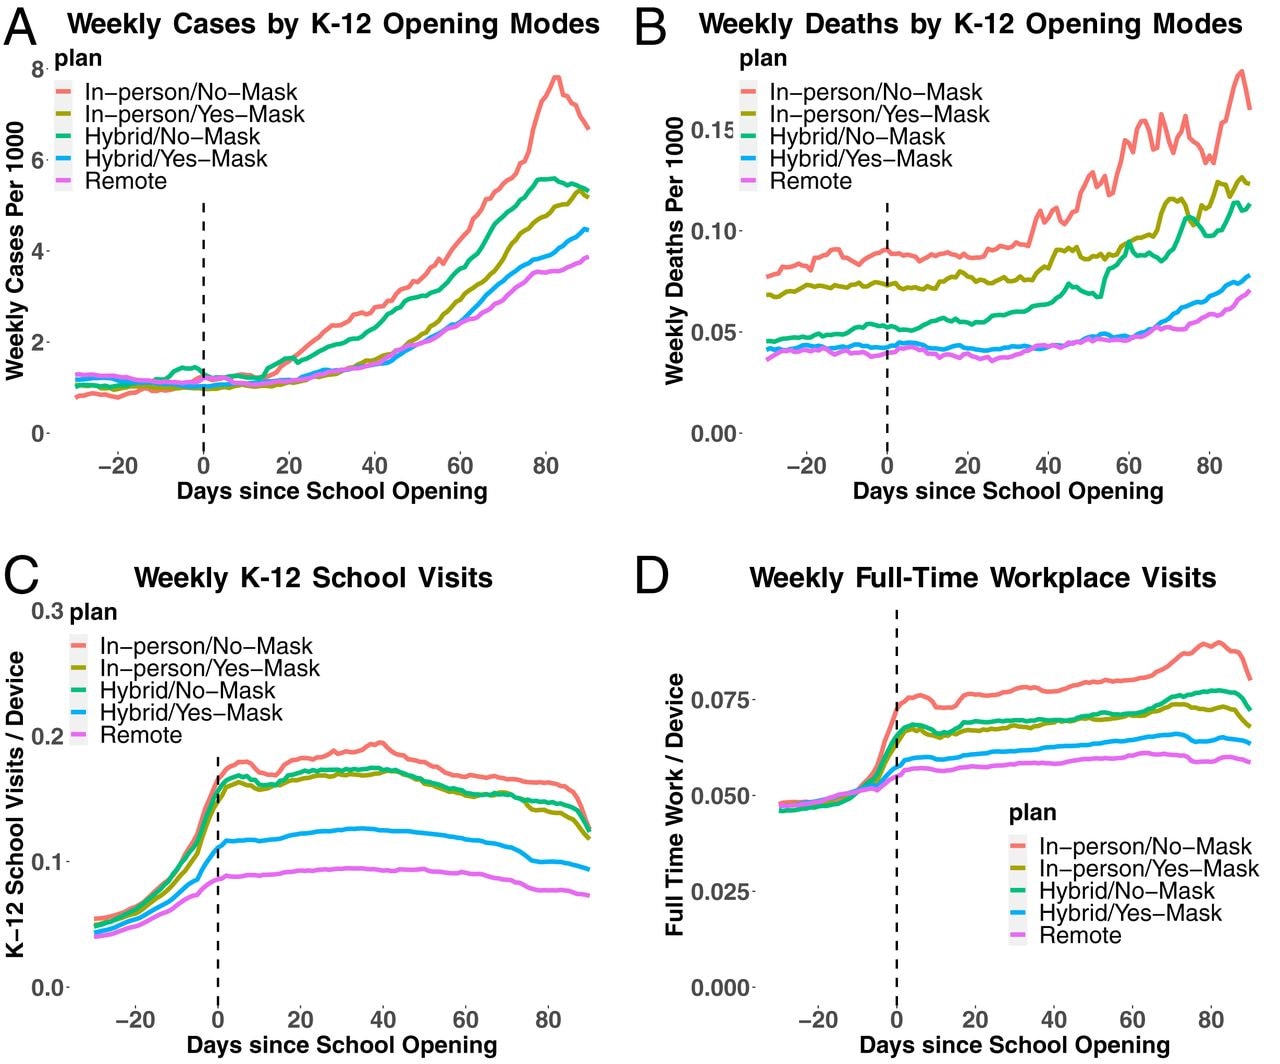
- In-person K–12 school openings were associated with increased county-level COVID-19 cases and deaths (Figure).
- The association was stronger in counties without staff mask mandates (Figure).
- K–12 school openings were associated with case growth rate increases of 5–7%.
- In-person school openings coincided with increased mobility (Figure).
Methods: Modeling of U.S. county-level data from April–December 2020, including 14,703 school districts and controlled for prior infection rates and mitigation policies. Mobility (school and workplace visits) ascertained from mobile phone location data. Limitations: Testing strategy data not available; observed link between school openings and case and death growth rates may not be causal.
Implications: Masking and other school-based mitigation policies may slow the spread of SARS-CoV-2 in the community upon school reopening.
Figure:
Note: Adapted from Chernozhukov et al. A) Average cases and B) deaths per 1,000 persons over time since K–12 school opening in days, stratified by teaching method (in-person, hybrid, or remote) and masking requirements. C) Visits to K–12 schools and D) full-time workplaces as a 7-day average per mobile phone location data over time since K–12 school opening in days. Licensed under CC BY 4.0.
PEER-REVIEWED
Association between risk of COVID-19 infection in nonimmune individuals and COVID-19 immunity in their family members. Nordström et al. JAMA Internal Medicine (October 11, 2021).
Key findings:
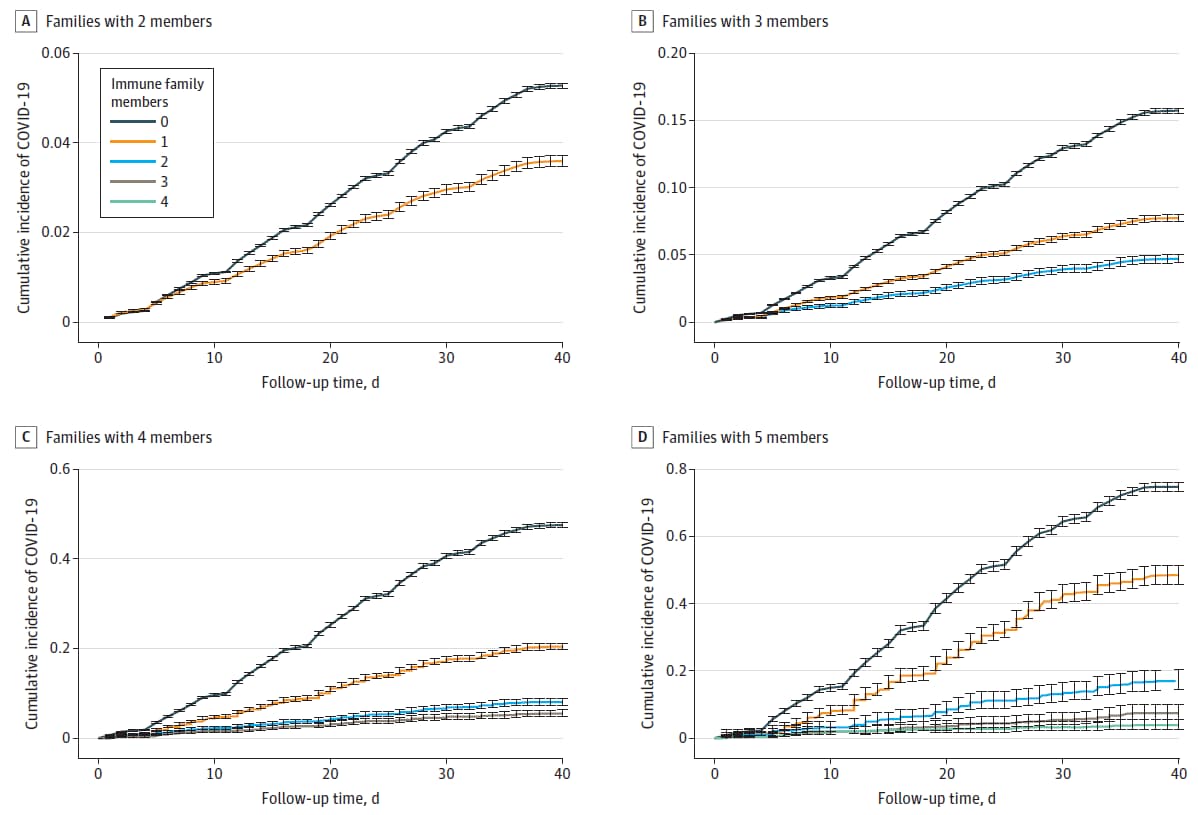
- Incident COVID-19 in nonimmune household family members decreased as the number of immune family members increased (Figure).
- Compared with individuals without any immune family members, nonimmune individuals with 1, 2, 3 or 4 immune family members had a 45%–61%,75%–86%, 91%–94%, and 97% lower risk of infection, respectively.
Methods: Cohort study using nationwide registry data of 1,789,728 individuals and 814,806 families with 2–5 members, Sweden, April–May 2021. Family members with previous infection or full vaccination were considered immune. Limitations: Small number of large families.
Implications: Vaccination remains a key prevention strategy. Increased vaccination coverage of family members may reduce household SARS-CoV-2 transmission.
Figure:
Note: Adapted from Nordström et al. Cumulative incidence of COVID-19 infection in families with 2–5 household members by number (0, 1, 2, 3, or 4) of immune family members. Error bars represent the 95% confidence intervals. Licensed under CC BY.
PEER-REVIEWED
COVID-19 incidence and mortality in federal and state prisons compared with the US population, April 5, 2020, to April 3, 2021. Marquez et al. JAMA (October 6, 2021).
Key findings:
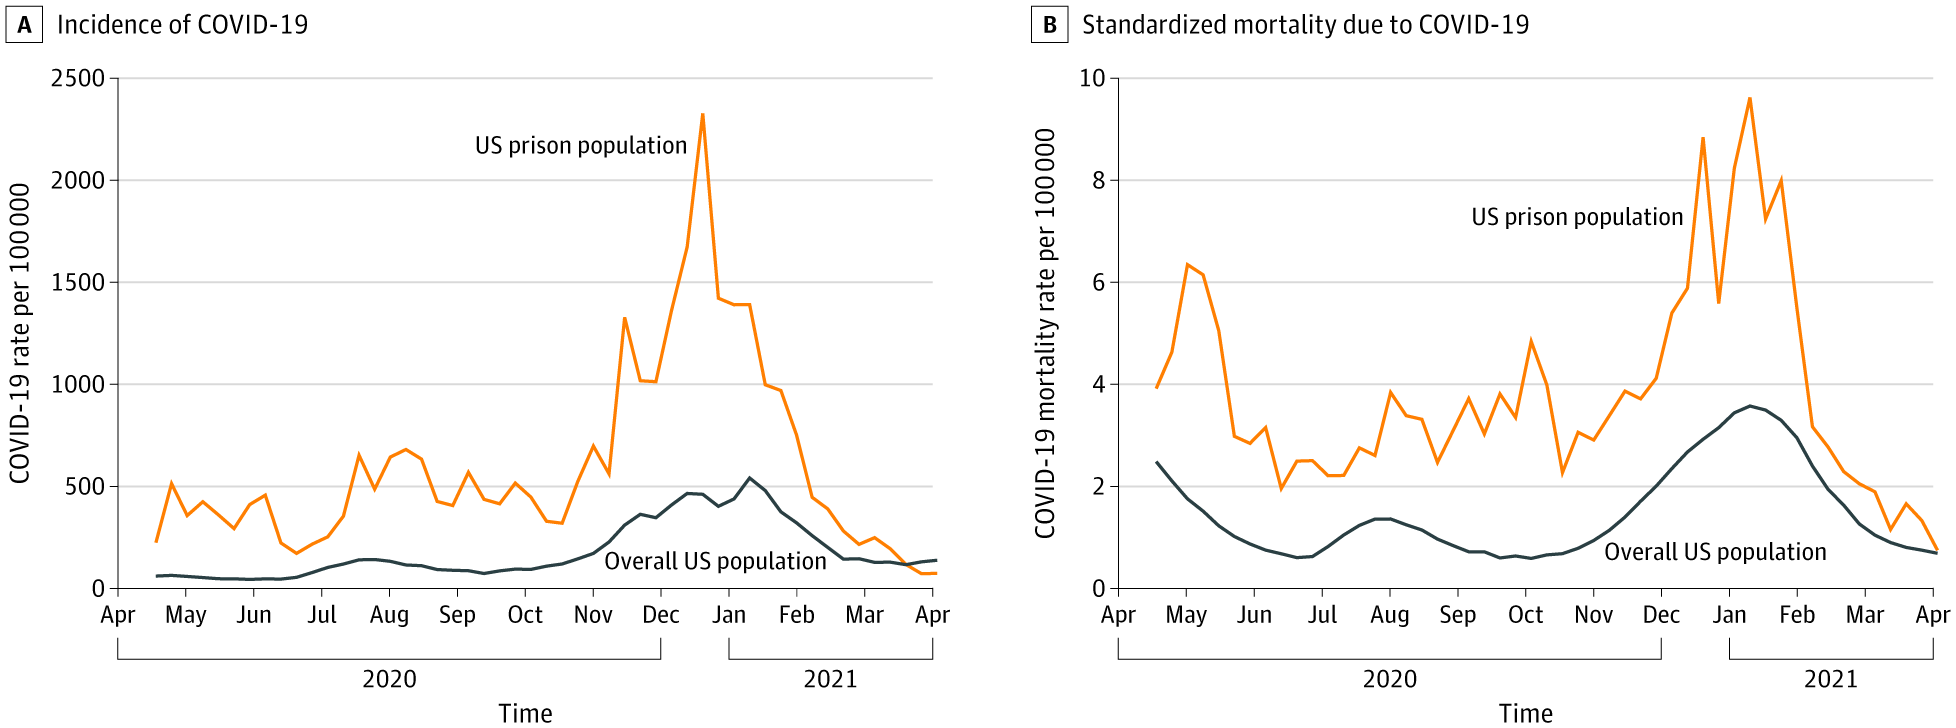
- Incarcerated persons were over 3 times as likely to contract COVID-19 (cumulative incidence rate ratio [cIRR] 3.3, 95% CI 3.3-3.3) and over twice as likely to die from COVID-19 (cumulative mortality rate ratio [cMRR] 2.5 95% CI 2.3-2.7) compared to the general population.
Methods: COVID-19 case and death rates among prisoners in all 50 state prison systems and the Federal Bureau of Prisons were compared to U.S. population rates using data from the UCLA Law COVID Behind Bars Project and Vera Institute. Cumulative incidence and mortality rates were calculated and adjusted for age and sex. Limitations: Differential testing rates may have influenced incidence and mortality ratios.
Implications: Policies and approaches to prevent COVID-19 among incarcerated persons should be prioritized.
Figure
Note: Adapted from Marquez et al. Weekly COVID-19 incidence and standardized mortality rates in US prisons and in the overall US population, April 5, 2020 to April 3, 2021. Reproduced with permission from JAMA, 2021. Published online October 6, 2021. https://doi.org/10.1001/jama.2021.17575. Copyright© 2021 American Medical Association. All rights reserved.
Vaccines
- Differential immunogenicity of homologous versus heterologous boost in Ad26.COV2.S vaccine recipients. Khoo et al. medRxiv (Preprint; October 14, 2021). Published in Med (January 19, 2022). Among 115 recipients of different vaccination regimens in Singapore, heterologous boosting with BNT162b2 after Ad26.COV2.S led to better immunogenicity based on virus-specific antibody, B cell, and T cell qualitative and quantitative measurements, compared to a homologous booster.
Note: Adapted from Khoo et al. Proportion of vaccinees with varying levels of Spike-IgG antibodies, neutralizing antibodies, spike-specific B and T cell frequencies. Responder type (Strong/moderate/none-weak) was expressed as a fraction of the number of vaccine recipients in each cohort. Responder type determined by percentile score from all vaccinees. Y-axis shows different vaccine regimens: J = Ad26.COV2.S, 1 dose (n = 12); J+J = Ad26.COV2.S, 2 doses (n = 23); J+P = Ad26.COV2.S + BNT162b2 dose (n = 9), P = BNT162b2, 1 dose (n = 10) and P+P = BNT162b2, 2 doses (n = 37). Licensed under CC-BY-NC-ND 4.0.
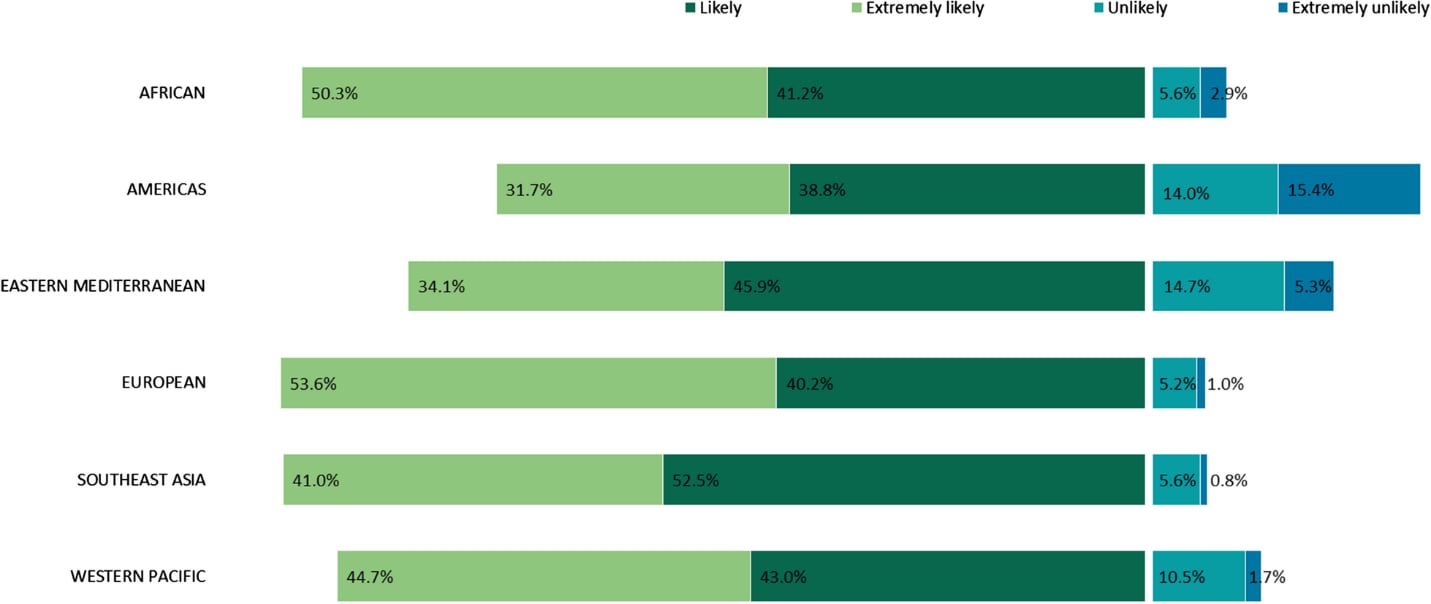
- COVID-19 vaccination intention and vaccine characteristics influencing vaccination acceptance: A global survey of 17 countries. Wong et al. Infectious Diseases of Poverty (October 7, 2021). COVID-19 vaccine acceptance was measured in a cross-sectional multi-country global online survey (n = 17 countries; 19,714 total responses), January 4–March 6, 2021. Nearly all respondents in Australia (96.4%), China (95.3%), and Norway (95.3) reported they were likely or extremely likely to receive a vaccine. About one-third of respondents in Japan (34.6%), the U.S. (29.4%), and Iran (27.9%) were unlikely or extremely unlikely to receive a vaccine. The U.S. had the highest proportion who were extremely unlikely to receive a vaccine (15.4%).
Note: Adapted from Wong et al. COVID-19 vaccine acceptance defined as Extremely Likely, Likely, Unlikely, Or Extremely Unlikely by WHO regions (African, Americas, Eastern Mediterranean, European, Southeast Asian, Western Pacific). Licensed under CC BY 4.0.
- Changes in COVID-19 vaccine intent from April/May to June/July 2021. Szilagyi et al. JAMA (October 13, 2021). Among 6,052 U.S. adults, the likelihood of vaccination remained stable during April–July 2021. Of 564 respondents who were somewhat/very likely to get vaccinated in April/May, 45.6% reported being vaccinated by June/July. Of 1,403 respondents who were very/somewhat unlikely or unsure in April/May, 7.3% reported being vaccinated by June/July.
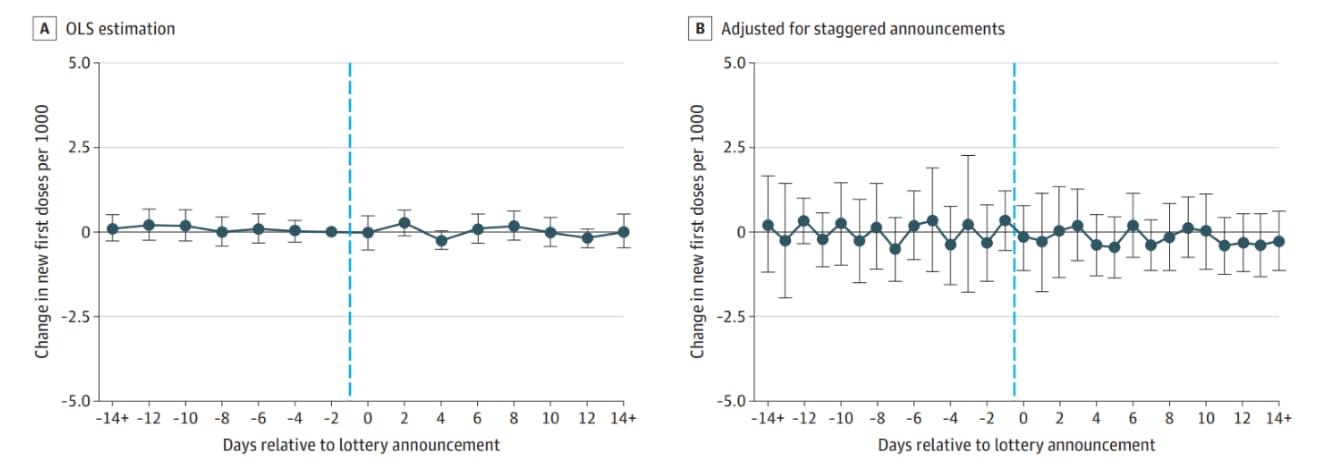
- Association between statewide COVID-19 lottery announcements and vaccinations. Dave et al. JAMA Health Forum (October 15, 2021). No association was found between cash lottery incentives and vaccination rates, April 28–July 1, 2021. Findings were based on a differences-in-differences method to compare COVID-19 vaccination rates before and after lottery announcements in 19 states vs. states that did not use lottery incentives.
Note: Adapted from Dave et al. Change in vaccination rate in relation to the day a cash lottery was announced (dashed line). Event-time estimates from ordinary least squares (OLS) method (Panel A) and from a novel method using states that had not yet announced lotteries as counterfactuals (Panel B) are displayed. Licensed under CC BY.
Natural History, Reinfection, and Health Impact
- Increased risk for COVID-19 breakthrough infection in fully vaccinated patients with substance use disorders in the United States between December 2020 and August 2021. Wang et al. World Psychiatry (October 5, 2021). Breakthrough infections were more likely among people with substance use disorders (N = 30,183) compared to those without (N = 549,189) among fully vaccinated peoples in a U.S. population-based study using electronic health records. People with substance use disorders who used cocaine (HR = 2.06; 95% CI 1.30-3.25) or cannabis (HR = 1.92; 95% CI 1.39-2.66) had the highest risks for breakthrough infections after controlling for age, gender, ethnicity, and vaccine type. There was a higher prevalence of comorbidities and adverse socioeconomic determinants among those with substance use disorders.
- Immunity to SARS-CoV-2 up to 15 months after infection. Marcotte et al. bioRxiv (Preprint; October 11, 2021). Published in iScience (January 7, 2022). In serum from 136 COVID-19 patients (98 from Italy, 38 from Sweden), IgG antibodies were found 6–15 months after natural infection in 68% (anti-RBD [n = 30/44]) and 73% (anti-S [n = 32/44]) of patients. Lower antibody levels were associated with milder disease. Neutralizing antibodies were lower against variants of concern than against wild type. SARS-CoV-2 memory B and T cells were present in >95% of patients 6–15 months after infection.
- Virologic features of SARS-CoV-2 infection in children. Yonker et al. The Journal of Infectious Diseases (October 14, 2021). Among 110 children (≤ 21 years, median age 10 years) with COVID-19 who presented to urgent care clinics or hospitals in Massachusetts during April 2020–April 2021 with symptoms or possible exposure, increasing age was associated with greater disease severity. Viral loads in children with asymptomatic or mild infections were higher than in children or adults with severe disease. Viral load and replication-competent virus in children was highest in the first 2 days of symptoms and decreased after 5 days.
Health Equity
- COVID-19 vaccine acceptance and access among Black and Latinx communities. Balasuriya et al. JAMA Network Open (October 13, 2021). To understand facilitators and barriers to COVID-19 vaccination, 8 semi-structured in-depth focus groups (4 in Spanish; 4 in English) were conducted in March 2021 with 72 participants who identified as Hispanic/Latino and/or Black and had a diverse range of community roles in New Haven, CT. Three major themes emerged: pervasive mistreatment of Black and Hispanic/Latino communities and associated distrust; opportunities to build trust via trusted messengers and messages, choice, social support, and diversity; and the need to address structural barriers to vaccination access.
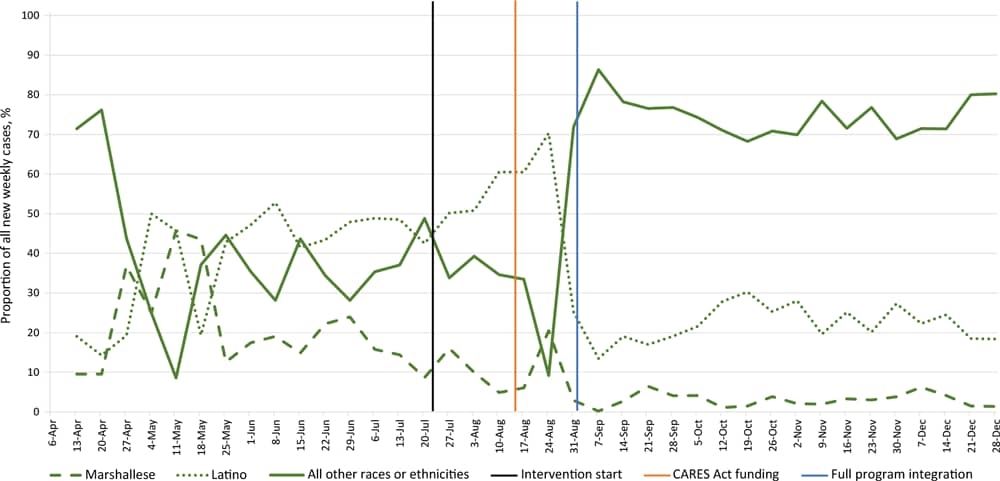
- Use of community-based participatory research partnerships to reduce COVID-19 disparities among Marshallese Pacific Islander and Latino Communities – Benton and Washington Counties, Arkansas, April–December 2020. McElfish et al. Preventing Chronic Disease (October 7, 2021). After the start of a community-based intervention to promote linguistically appropriate health education, testing, contact tracing, and care navigation, the proportion of COVID-19 cases that were among Marshallese and Hispanic/Latino populations decreased from 19% to 8% and from 46% to 32%, respectively.
Note: Adapted from McElfish et al. Percentages of new weekly COVID-19 cases from Benton and Washington counties that were Marshallese, Hispanic/Latino, and all other races or ethnicities, April–December 2020. Vertical lines represent significant events: intervention implementation on July 22, CARES Act funding on August 13, and full intervention integration on September 1. Open access journal; all content freely available.
- From the Morbidity and Mortality Weekly Report (October 22, 2021).
- Severity of Disease Among Adults Hospitalized with Laboratory-Confirmed COVID-19 Before and During the Period of SARS-CoV-2 B.1.617.2 (Delta) Predominance — COVID-NET, 14 States, January–August 2021
- COVID-19 Vaccination and Non–COVID-19 Mortality Risk — Seven Integrated Health Care Organizations, United States, December 14, 2020–July 31, 2021
- Effectiveness of Pfizer-BioNTech mRNA Vaccination Against COVID-19 Hospitalization Among Persons Aged 12–18 Years — United States, June–September 2021
Disclaimer: The purpose of the CDC COVID-19 Science Update is to share public health articles with public health agencies and departments for informational and educational purposes. Materials listed in this Science Update are selected to provide awareness of relevant public health literature. A material’s inclusion and the material itself provided here in full or in part, does not necessarily represent the views of the U.S. Department of Health and Human Services or the CDC, nor does it necessarily imply endorsement of methods or findings. While much of the COVID-19 literature is open access or otherwise freely available, it is the responsibility of the third-party user to determine whether any intellectual property rights govern the use of materials in this Science Update prior to use or distribution. Findings are based on research available at the time of this publication and may be subject to change.

