At a glance
Data used to estimate the burden of waterborne disease were from 2000 through 2015. Calculations were based on a U.S. population of 319 million in 2014, the most recent year for which data were available for all surveillance sources. CDC estimated the burden of waterborne disease using statistical models that included data from multiple sources and accounted for uncertainty with a distribution of plausible values.

Estimating U.S. illnesses for waterborne pathogens
The data, also used to estimate deaths and costs, were divided into three main categories:
- Surveillance data: Information reported to or gathered by public health officials from state and local health departments, laboratories, hospitals, and other settings.
- Scientific literature: Evidenced-based resources used to estimate cases for pathogens without surveillance systems and for multipliers in statistical modeling to account for underreporting, underdiagnosis, and sensitivity and specificity of lab testing.
- Administrative data: Data sources include the Health Care Utilization Project's National Inpatient Sample (HCUP NIS) hospitalization database, the HCUP's National Emergency Department Sample (HCUP NEDS) emergency department visit database, and the National Ambulatory Medical Care Survey (NAMCS) physicians' office visit database. These data sources use complex sample survey weighting methods and are considered nationally representative.
Diseases
Diseases included in this analysis were
- Campylobacteriosis
- Cryptosporidiosis
- Giardiasis
- Legionnaires' disease
- Nontuberculous mycobacterial (NTM) infection
- Norovirus infection
- Acute otitis externa ("swimmer's ear")
- Pseudomonas pneumonia and septicemia
- Shiga-toxin producing Escherichia coli (STEC) infection O157
- Non-O157 STEC infection
- Salmonellosis
- Shigellosis
- Vibriosis (including infections caused by Vibrio alginolyticus, parahaemolyticus, vulnificus and other species)
Researchers also estimated the impact of these illnesses by categorizing them as respiratory (primarily Legionnaires' disease, NTM infection, and Pseudomonas pneumonia) and intestinal (primarily campylobacteriosis, cryptosporidiosis, giardiasis, norovirus infection, salmonellosis, and shigellosis).
Methods
Illnesses
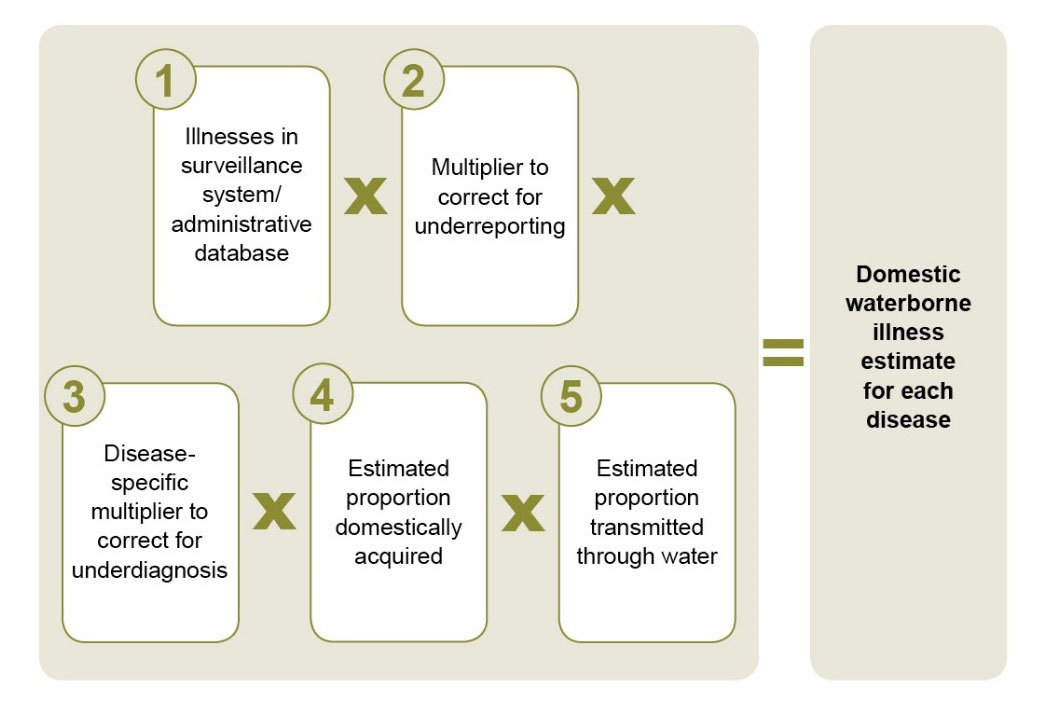
For each pathogen, CDC gathered data from surveillance systems, administrative systems, and research literature then corrected for underreporting and underdiagnosis. CDC multiplied the adjusted number by the proportion of illnesses acquired in the U.S. (that is, not during international travel) and the proportion transmitted by water to yield an estimated number of illnesses that are domestically acquired and waterborne. CDC then added the estimates for each of the pathogens to arrive at a total and used an uncertainty model to generate a point estimate and 95% credible interval (upper and lower limits) (Figure 1).
Figure 1: Illness burden estimate
*Probability distributions were used to model uncertainty in each of the data inputs. Point estimates were bounded by a 95% credible interval.
**To calculate the total estimated number of domestically acquired waterborne illnesses for the selected diseases and incorporate the uncertainty for all the individual estimates, a similar modeling process was used. Estimates for individual diseases are not additive because of the modeling process.
Emergency department visits, hospitalizations, and deaths
For each pathogen with available surveillance data, CDC multiplied the estimated number of reported illnesses (after correcting for underreporting) by the pathogen-specific hospitalization and death rate from surveillance or administrative data to estimate hospitalizations and deaths.
Most surveillance systems do not tally emergency department (ED) visits if the patient was not admitted to the hospital, so CDC estimated the number of ED visits using the ratio of ED visits to hospitalizations in HCUP data and the pathogen-specific hospitalization rate. Because some people with illnesses that were not laboratory-confirmed would also have had an ED visit, been hospitalized, or died, CDC doubled the estimates to correct for under-diagnosis.
CDC multiplied the adjusted ED visit, hospitalization and death estimates by the proportion of illnesses that were acquired within the United States (vs. international travel-related) and the proportion transmitted by water.
Finally, CDC used an uncertainty model to generate a point estimate and 95% credible intervals for both hospitalizations and deaths. (See Figures 2, 3, and 4.)
Figure 2: Emergency department (ED) visit burden estimate

*Probability distributions were used to model uncertainty in each of the data inputs. Point estimates were bounded by a 95% credible interval.
**To calculate the total estimated number of domestically acquired ED visits for the selected diseases and incorporate the uncertainty for all the individual estimates, a similar modeling process was used. Estimates for individual diseases are not additive because of the modeling process.
Figure 3: Hospitalization burden estimate

*Probability distributions were used to model uncertainty in each of the data inputs. Point estimates were bounded by a 95% credible interval.
**To calculate the total estimated number of hospitalizations for the selected diseases and incorporate the uncertainty for all the individual estimates, a similar modeling process was used. Estimates for individual diseases are not additive because of the modeling process.
Figure 4: Death burden estimate

*Probability distributions were used to model uncertainty in each of the data inputs. Point estimates were bounded by a 95% credible interval.
**To calculate the total estimated number of deaths for the selected diseases and incorporate the uncertainty for all the individual estimates, a similar modeling process was used. Estimates for individual diseases are not additive because of the modeling process.
Healthcare cost
CDC estimated the total direct healthcare cost using the sum of insurer and out-of-pocket payments for ED visits and hospitalizations attributed to waterborne disease transmission in the United States. CDC calculated the cost per ED visit or hospitalization for different insurance sources (commercial insurance, Medicare and Medicaid) using the IBM® MarketScan® Research Databases. CDC created a weighted average cost by multiplying the cost per insurance source by the proportion of ED visits or hospitalizations with the corresponding insurance source in HCUP NEDS or NIS. To obtain the total direct healthcare cost, CDC multiplied the total number of ED visits and hospitalizations attributed to U.S. waterborne disease (calculated using surveillance and administrative data as described above) by the weighted average cost per ED visit or hospitalization (calculated using insurance data).
Figure 5: Total direct healthcare costs of ED visits and hospitalizations

*The Healthcare Cost and Utilization Project’s National Inpatient Sample (HCUP NIS) and the Healthcare Cost and Utilization Project’s National Emergency Department Sample (HCUP NEDS)
- Collier, S. A., Deng, L., Adam, E. A., Benedict, K. M., Beshearse, E. M., Blackstock, A. J....Beach, M. J. (2021). Estimate of Burden and Direct Healthcare Cost of Infectious Waterborne Disease in the United States. Emerging Infectious Diseases, 27(1), 140-149. https://doi.org/10.3201/eid2701.190676.