Reported Tuberculosis in the United States, 2022
Table 19. Tuberculosis Cases and Percentages by Site of Disease: United States, 2010–2022
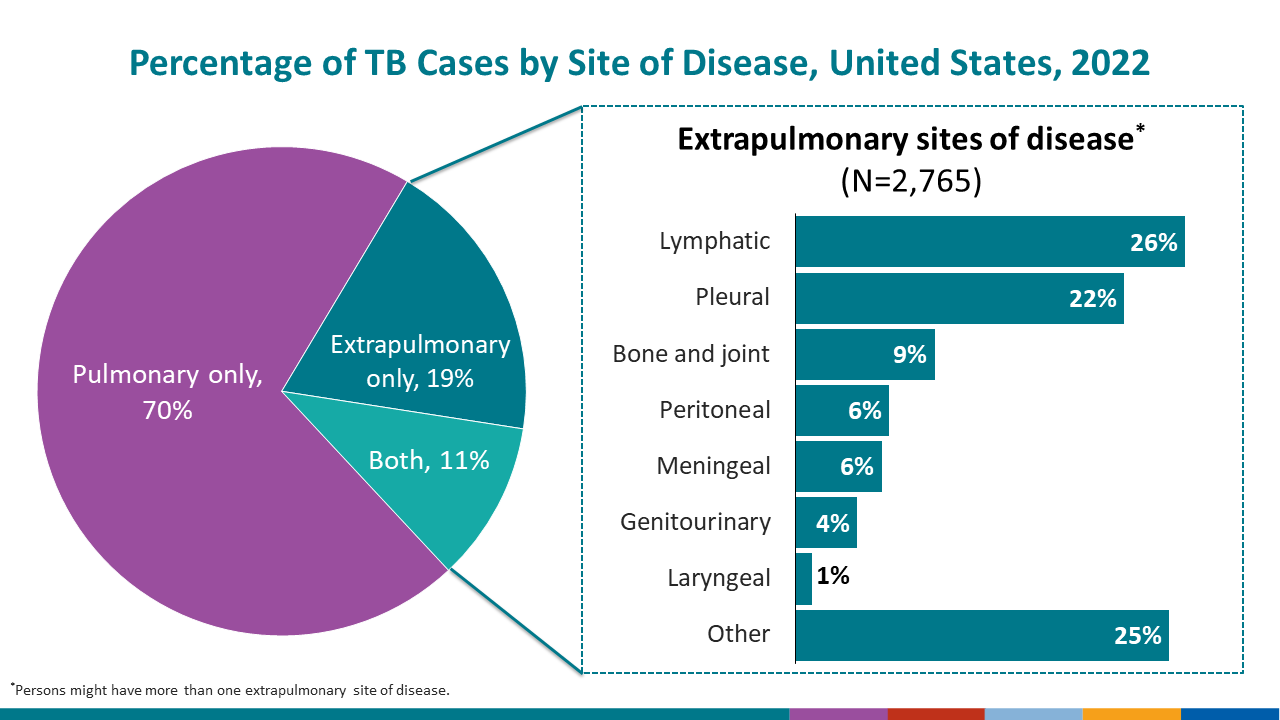
See surveillance slide #36.
| Year | Total pulmonary only cases1 | Total pulmonary and extrapulmonary cases2 | Total extrapulmonary only cases3 | Total extrapulmonary sites4 | Extrapulmonary site of disease | ||||||||||||||||||
|---|---|---|---|---|---|---|---|---|---|---|---|---|---|---|---|---|---|---|---|---|---|---|---|
| Pleural | Lymphatic5 | Bone or joint | Genitourinary | Meningeal | Peritoneal | Laryngeal | Other | ||||||||||||||||
| No. | (%) | No. | (%) | No. | (%) | No. | (%) | No. | (%) | No. | (%) | No. | (%) | No. | (%) | No. | (%) | No. | (%) | No. | (%) | ||
| 2022 | 5,864 | (70.4) | 881 | (10.6) | 1,569 | (18.8) | 2,765 | 610 | (22.1) | 723 | (26.1) | 259 | (9.4) | 115 | (4.2) | 160 | (5.8) | 174 | (6.3) | 31 | (1.1) | 693 | (25.1) |
| 2021 | 5,193 | (66.0) | 991 | (12.6) | 1,681 | (21.4) | 2,993 | 586 | (19.6) | 817 | (27.3) | 366 | (12.2) | 120 | (4.0) | 157 | (5.2) | 208 | (6.9) | 26 | (0.9) | 713 | (23.8) |
| 2020 | 4,782 | (66.7) | 875 | (12.2) | 1,512 | (21.1) | 2,635 | 559 | (21.2) | 813 | (30.9) | 219 | (8.3) | 107 | (4.1) | 131 | (5.0) | 196 | (7.4) | 15 | (0.6) | 595 | (22.6) |
| 2019 | 6,072 | (68.3) | 1,007 | (11.3) | 1,812 | (20.4) | 3,126 | 675 | (21.6) | 1,008 | (32.2) | 269 | (8.6) | 115 | (3.7) | 164 | (5.2) | 187 | (6.0) | 27 | (0.9) | 681 | (21.8) |
| 2018 | 6,154 | (68.4) | 1,039 | (11.5) | 1,802 | (20.0) | 3,117 | 673 | (21.6) | 1,015 | (32.6) | 281 | (9.0) | 145 | (4.7) | 148 | (4.7) | 167 | (5.4) | 23 | (0.7) | 665 | (21.3) |
| 2017 | 6,215 | (68.5) | 966 | (10.7) | 1,883 | (20.8) | 3,138 | 635 | (20.2) | 1,054 | (33.6) | 279 | (8.9) | 137 | (4.4) | 150 | (4.8) | 183 | (5.8) | 21 | (0.7) | 679 | (21.6) |
| 2016 | 6,424 | (69.5) | 940 | (10.2) | 1,867 | (20.2) | 3,068 | 593 | (19.3) | 958 | (31.2) | 270 | (8.8) | 161 | (5.2) | 160 | (5.2) | 194 | (6.3) | 25 | (0.8) | 707 | (23.0) |
| 2015 | 6,623 | (69.4) | 1,007 | (10.6) | 1,904 | (20.0) | 3,167 | 697 | (22.0) | 994 | (31.4) | 302 | (9.5) | 142 | (4.5) | 168 | (5.3) | 191 | (6.0) | 16 | (0.5) | 657 | (20.7) |
| 2014 | 6,458 | (68.8) | 999 | (10.6) | 1,920 | (20.5) | 3,189 | 690 | (21.6) | 1,077 | (33.8) | 309 | (9.7) | 152 | (4.8) | 176 | (5.5) | 178 | (5.6) | 18 | (0.6) | 589 | (18.5) |
| 2013 | 6,628 | (69.7) | 922 | (9.7) | 1,962 | (20.6) | 3,110 | 645 | (20.7) | 1,027 | (33.0) | 324 | (10.4) | 156 | (5.0) | 181 | (5.8) | 170 | (5.5) | 19 | (0.6) | 588 | (18.9) |
| 2012 | 6,783 | (68.5) | 1,040 | (10.5) | 2,077 | (21.0) | 3,369 | 697 | (20.7) | 1,139 | (33.8) | 342 | (10.2) | 168 | (5.0) | 181 | (5.4) | 189 | (5.6) | 29 | (0.9) | 624 | (18.5) |
| 2011 | 7,259 | (69.3) | 1,048 | (10.0) | 2,161 | (20.6) | 3,464 | 758 | (21.9) | 1,129 | (32.6) | 353 | (10.2) | 176 | (5.1) | 226 | (6.5) | 186 | (5.4) | 26 | (0.8) | 610 | (17.6) |
| 2010 | 7,696 | (69.5) | 964 | (8.7) | 2,408 | (21.8) | 3,586 | 695 | (19.4) | 1,305 | (36.4) | 352 | (9.8) | 183 | (5.1) | 208 | (5.8) | 189 | (5.3) | 20 | (0.6) | 634 | (17.7) |
1Persons with pulmonary as the only site of disease.
2Persons with both pulmonary and extrapulmonary sites of disease.
3Persons with extrapulmonary TB disease only.
4Persons might have more than one extrapulmonary site of disease.
5Persons with multiple lymphatic sites of disease are counted once.
Note:
Data for all years are updated through July 8, 2023.
See Technical Notes.