Reported Tuberculosis in the United States, 2022
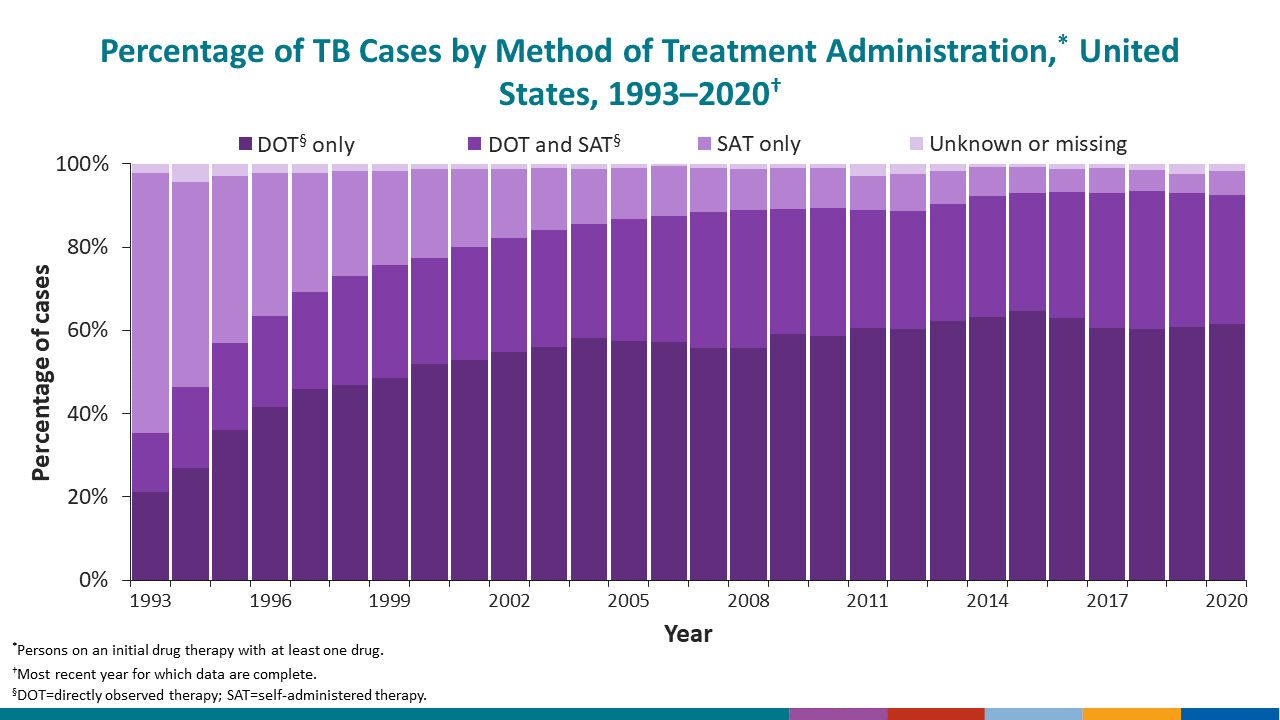
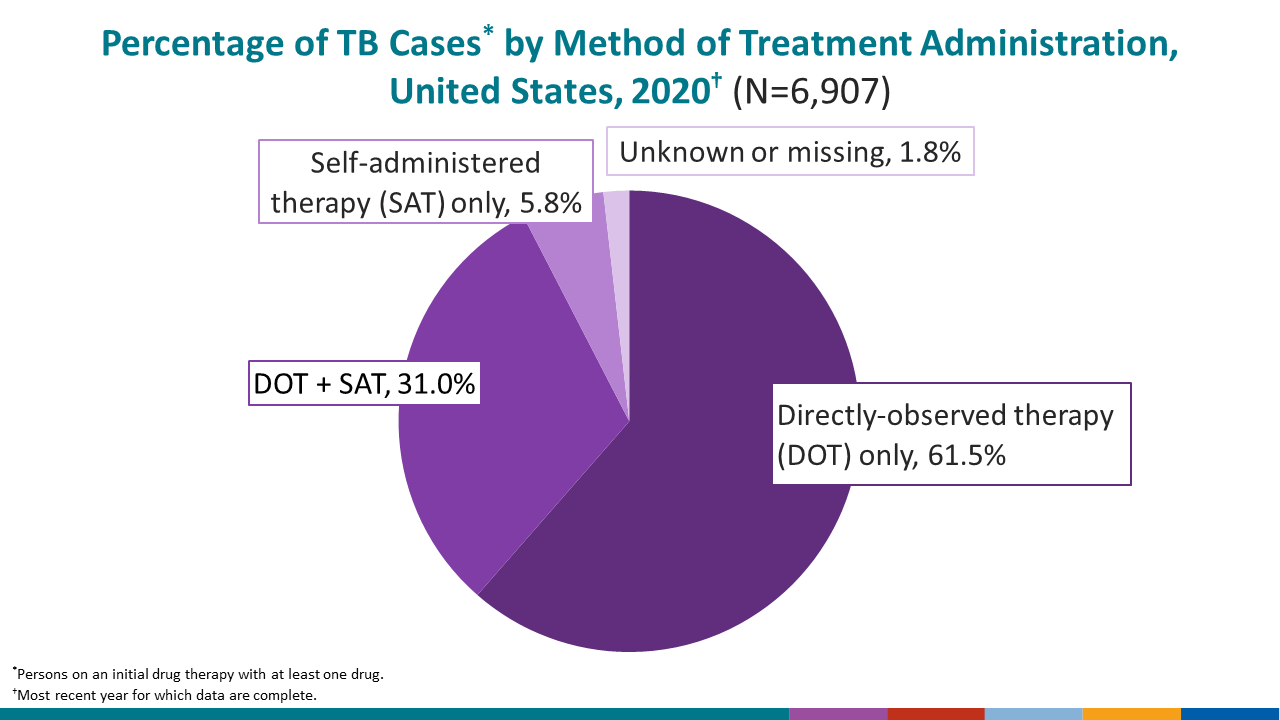
Table 15. Tuberculosis Cases and Percentages by Method of Treatment Administration: United States, 1993–2020
See surveillance slides #39 and #40.
| Year | Total cases1 | DOT only2 | SAT only3 | Both DOT and SAT | Unknown or missing | ||||
|---|---|---|---|---|---|---|---|---|---|
| No. | (%) | No. | (%) | No. | (%) | No. | (%) | ||
| 2020 | 6,907 | 4,245 | (61.5) | 399 | (5.8) | 2,139 | (31.0) | 124 | (1.8) |
| 2019 | 8,628 | 5,244 | (60.8) | 403 | (4.7) | 2,779 | (32.2) | 202 | (2.3) |
| 2018 | 8,739 | 5,271 | (60.3) | 434 | (5.0) | 2,905 | (33.2) | 129 | (1.5) |
| 2017 | 8,845 | 5,357 | (60.6) | 523 | (5.9) | 2,877 | (32.5) | 88 | (1.0) |
| 2016 | 8,976 | 5,661 | (63.1) | 503 | (5.6) | 2,701 | (30.1) | 111 | (1.2) |
| 2015 | 9,282 | 5,997 | (64.6) | 600 | (6.5) | 2,626 | (28.3) | 59 | (0.6) |
| 2014 | 9,147 | 5,785 | (63.2) | 644 | (7.0) | 2,646 | (28.9) | 72 | (0.8) |
| 2013 | 9,235 | 5,743 | (62.2) | 724 | (7.8) | 2,607 | (28.2) | 161 | (1.7) |
| 2012 | 9,642 | 5,818 | (60.3) | 855 | (8.9) | 2,744 | (28.5) | 225 | (2.3) |
| 2011 | 10,172 | 6,160 | (60.6) | 847 | (8.3) | 2,880 | (28.3) | 285 | (2.8) |
| 2010 | 10,750 | 6,314 | (58.7) | 1,030 | (9.6) | 3,303 | (30.7) | 103 | (1.0) |
| 2009 | 11,156 | 6,601 | (59.2) | 1,113 | (10.0) | 3,343 | (30.0) | 99 | (0.9) |
| 2008 | 12,602 | 7,038 | (55.8) | 1,251 | (9.9) | 4,165 | (33.1) | 148 | (1.2) |
| 2007 | 12,900 | 7,194 | (55.8) | 1,379 | (10.7) | 4,214 | (32.7) | 113 | (0.9) |
| 2006 | 13,310 | 7,612 | (57.2) | 1,601 | (12.0) | 4,022 | (30.2) | 75 | (0.6) |
| 2005 | 13,666 | 7,840 | (57.4) | 1,694 | (12.4) | 4,012 | (29.4) | 120 | (0.9) |
| 2004 | 14,079 | 8,181 | (58.1) | 1,857 | (13.2) | 3,857 | (27.4) | 184 | (1.3) |
| 2003 | 14,379 | 8,054 | (56.0) | 2,138 | (14.9) | 4,056 | (28.2) | 131 | (0.9) |
| 2002 | 14,563 | 7,972 | (54.7) | 2,418 | (16.6) | 3,996 | (27.4) | 177 | (1.2) |
| 2001 | 15,410 | 8,162 | (53.0) | 2,862 | (18.6) | 4,186 | (27.2) | 200 | (1.3) |
| 2000 | 15,785 | 8,193 | (51.9) | 3,381 | (21.4) | 4,029 | (25.5) | 182 | (1.2) |
| 1999 | 16,856 | 8,183 | (48.5) | 3,802 | (22.6) | 4,572 | (27.1) | 299 | (1.8) |
| 1998 | 17,585 | 8,240 | (46.9) | 4,451 | (25.3) | 4,594 | (26.1) | 300 | (1.7) |
| 1997 | 18,932 | 8,702 | (46.0) | 5,412 | (28.6) | 4,411 | (23.3) | 407 | (2.1) |
| 1996 | 20,300 | 8,437 | (41.6) | 6,970 | (34.3) | 4,452 | (21.9) | 441 | (2.2) |
| 1995 | 21,706 | 7,856 | (36.2) | 8,696 | (40.1) | 4,532 | (20.9) | 622 | (2.9) |
| 1994 | 23,053 | 6,190 | (26.9) | 11,342 | (49.2) | 4,528 | (19.6) | 993 | (4.3) |
| 1993 | 23,743 | 5,052 | (21.3) | 14,838 | (62.5) | 3,355 | (14.1) | 498 | (2.1) |
1Persons on an initial drug therapy with at least one drug.
2DOT, directly observed therapy.
3SAT, self-administered therapy.
Note:
Data for all years are updated through July 8, 2023.