Reported Tuberculosis in the United States, 2022
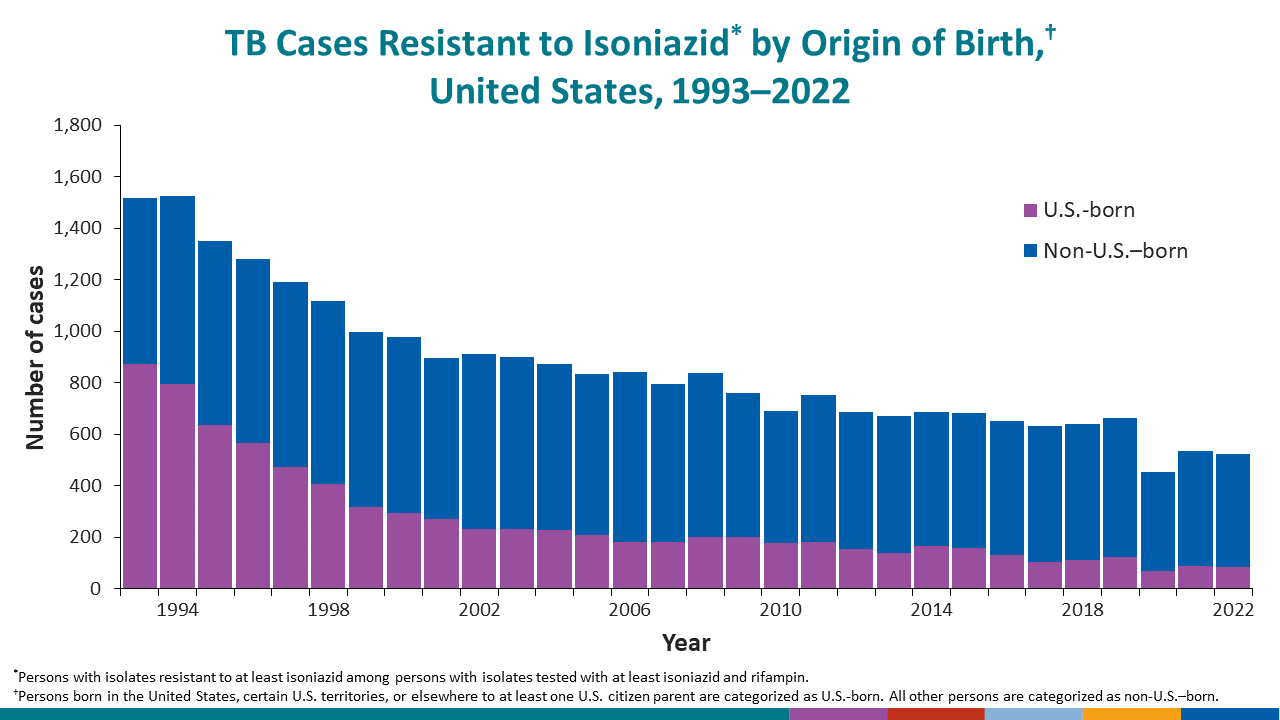
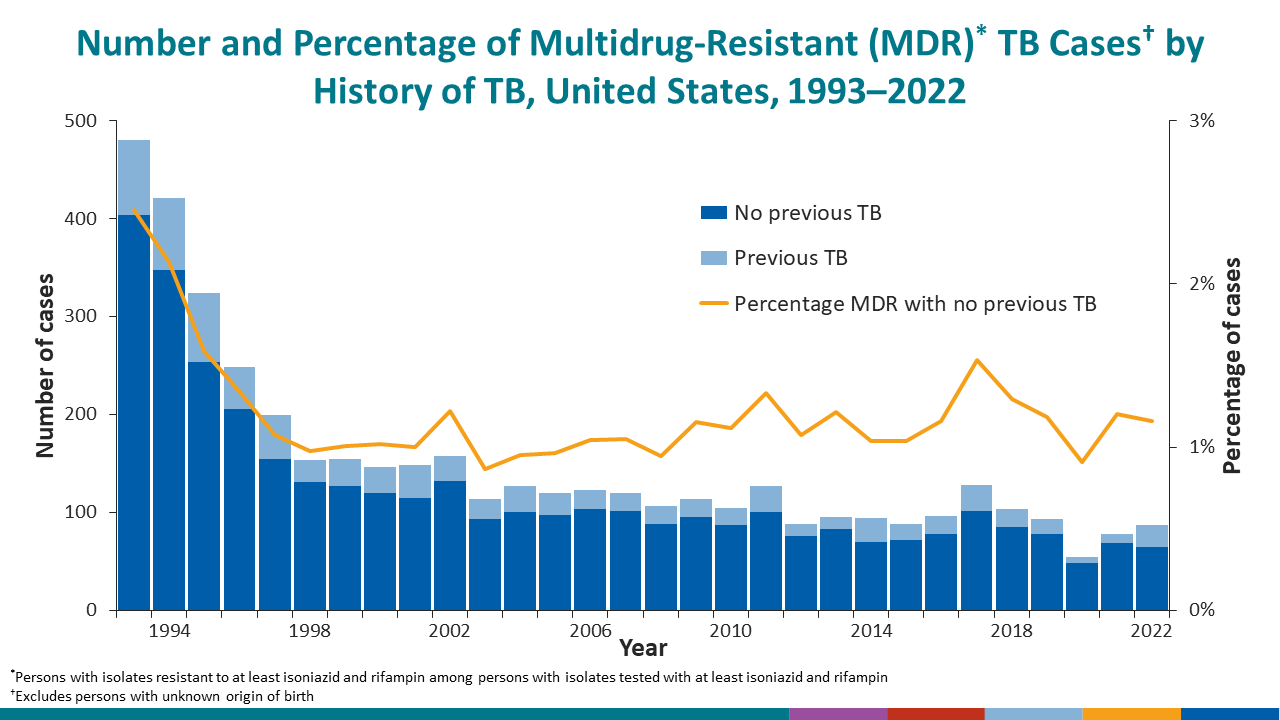
Table 13. Tuberculosis Cases and Percentages Among Non-U.S.–Born Persons1 by Drug Resistance and History of Previous TB Disease: United States, 1993–2022
See surveillance slides #42 and #43.
| Year | Total cases2 | Isoniazid (INH)-resistant3 | Multidrug-resistant (MDR)4 | Previous TB | No previous TB | ||||||||||
|---|---|---|---|---|---|---|---|---|---|---|---|---|---|---|---|
| Total cases | INH-resistant | MDR | Total cases | INH-resistant | MDR | ||||||||||
| No. | (%) | No. | (%) | No. | (%) | No. | (%) | No. | (%) | No. | (%) | ||||
| 2022 | 4,721 | 439 | (9.3) | 77 | (1.6) | 345 | 62 | (18.0) | 21 | (6.1) | 4,202 | 362 | (8.6) | 55 | (1.3) |
| 2021 | 4,474 | 448 | (10.0) | 69 | (1.5) | 182 | 30 | (16.5) | 9 | (4.9) | 4,242 | 412 | (9.7) | 60 | (1.4) |
| 2020 | 4,084 | 384 | (9.4) | 53 | (1.3) | 164 | 23 | (14.0) | 6 | (3.7) | 3,864 | 353 | (9.1) | 45 | (1.2) |
| 2019 | 5,008 | 538 | (10.7) | 80 | (1.6) | 213 | 33 | (15.5) | 14 | (6.6) | 4,760 | 500 | (10.5) | 66 | (1.4) |
| 2018 | 4,952 | 530 | (10.7) | 91 | (1.8) | 235 | 46 | (19.6) | 17 | (7.2) | 4,683 | 481 | (10.3) | 73 | (1.6) |
| 2017 | 4,981 | 526 | (10.6) | 110 | (2.2) | 221 | 52 | (23.5) | 25 | (11.3) | 4,736 | 470 | (9.9) | 84 | (1.8) |
| 2016 | 4,899 | 521 | (10.6) | 89 | (1.8) | 219 | 50 | (22.8) | 18 | (8.2) | 4,662 | 468 | (10.0) | 70 | (1.5) |
| 2015 | 5,001 | 526 | (10.5) | 75 | (1.5) | 218 | 44 | (20.2) | 13 | (6.0) | 4,762 | 482 | (10.1) | 62 | (1.3) |
| 2014 | 4,829 | 521 | (10.8) | 84 | (1.7) | 242 | 58 | (24.0) | 24 | (9.9) | 4,558 | 459 | (10.1) | 60 | (1.3) |
| 2013 | 4,797 | 532 | (11.1) | 87 | (1.8) | 202 | 40 | (19.8) | 10 | (5.0) | 4,563 | 490 | (10.7) | 76 | (1.7) |
| 2012 | 4,812 | 531 | (11.0) | 75 | (1.6) | 229 | 47 | (20.5) | 12 | (5.2) | 4,555 | 484 | (10.6) | 63 | (1.4) |
| 2011 | 5,074 | 570 | (11.2) | 109 | (2.1) | 208 | 50 | (24.0) | 26 | (12.5) | 4,842 | 514 | (10.6) | 83 | (1.7) |
| 2010 | 5,142 | 512 | (10.0) | 89 | (1.7) | 229 | 50 | (21.8) | 14 | (6.1) | 4,858 | 457 | (9.4) | 73 | (1.5) |
| 2009 | 5,417 | 560 | (10.3) | 102 | (1.9) | 226 | 46 | (20.4) | 18 | (8.0) | 5,124 | 507 | (9.9) | 83 | (1.6) |
| 2008 | 6,014 | 635 | (10.6) | 83 | (1.4) | 262 | 44 | (16.8) | 16 | (6.1) | 5,653 | 585 | (10.3) | 67 | (1.2) |
| 2007 | 6,121 | 615 | (10.0) | 102 | (1.7) | 288 | 57 | (19.8) | 16 | (5.6) | 5,766 | 549 | (9.5) | 83 | (1.4) |
| 2006 | 6,110 | 659 | (10.8) | 104 | (1.7) | 289 | 57 | (19.7) | 19 | (6.6) | 5,774 | 597 | (10.3) | 84 | (1.5) |
| 2005 | 5,962 | 625 | (10.5) | 101 | (1.7) | 267 | 52 | (19.5) | 21 | (7.9) | 5,653 | 567 | (10.0) | 77 | (1.4) |
| 2004 | 6,115 | 643 | (10.5) | 98 | (1.6) | 264 | 49 | (18.6) | 23 | (8.7) | 5,796 | 588 | (10.1) | 74 | (1.3) |
| 2003 | 6,206 | 669 | (10.8) | 92 | (1.5) | 271 | 49 | (18.1) | 19 | (7.0) | 5,882 | 607 | (10.3) | 70 | (1.2) |
| 2002 | 6,069 | 683 | (11.3) | 120 | (2.0) | 265 | 57 | (21.5) | 23 | (8.7) | 5,731 | 622 | (10.9) | 97 | (1.7) |
| 2001 | 6,289 | 625 | (9.9) | 110 | (1.7) | 302 | 59 | (19.5) | 26 | (8.6) | 5,918 | 559 | (9.4) | 81 | (1.4) |
| 2000 | 5,976 | 684 | (11.4) | 104 | (1.7) | 272 | 62 | (22.8) | 24 | (8.8) | 5,668 | 617 | (10.9) | 80 | (1.4) |
| 1999 | 5,946 | 677 | (11.4) | 111 | (1.9) | 284 | 55 | (19.4) | 22 | (7.7) | 5,600 | 614 | (11.0) | 88 | (1.6) |
| 1998 | 6,004 | 711 | (11.8) | 93 | (1.5) | 262 | 60 | (22.9) | 17 | (6.5) | 5,698 | 644 | (11.3) | 76 | (1.3) |
| 1997 | 6,036 | 719 | (11.9) | 111 | (1.8) | 286 | 74 | (25.9) | 32 | (11.2) | 5,710 | 640 | (11.2) | 79 | (1.4) |
| 1996 | 6,026 | 717 | (11.9) | 124 | (2.1) | 304 | 74 | (24.3) | 22 | (7.2) | 5,684 | 637 | (11.2) | 102 | (1.8) |
| 1995 | 6,066 | 714 | (11.8) | 128 | (2.1) | 364 | 91 | (25.0) | 42 | (11.5) | 5,661 | 619 | (10.9) | 85 | (1.5) |
| 1994 | 5,685 | 732 | (12.9) | 149 | (2.6) | 338 | 93 | (27.5) | 38 | (11.2) | 5,297 | 634 | (12.0) | 110 | (2.1) |
| 1993 | 5,016 | 643 | (12.8) | 149 | (3.0) | 301 | 75 | (24.9) | 46 | (15.3) | 4,674 | 565 | (12.1) | 103 | (2.2) |
1Persons born in the United States, certain U.S. territories, or elsewhere to at least one U.S. citizen parent are categorized as U.S.-born. All other persons are categorized as non-U.S.–born.
2Persons with isolates tested with at least isoniazid and rifampin.
3Resistance to at least isoniazid.
4Resistance to at least isoniazid and rifampin.
Note:
Data for all years are updated through July 8, 2023.