Reported Tuberculosis in the United States, 2022
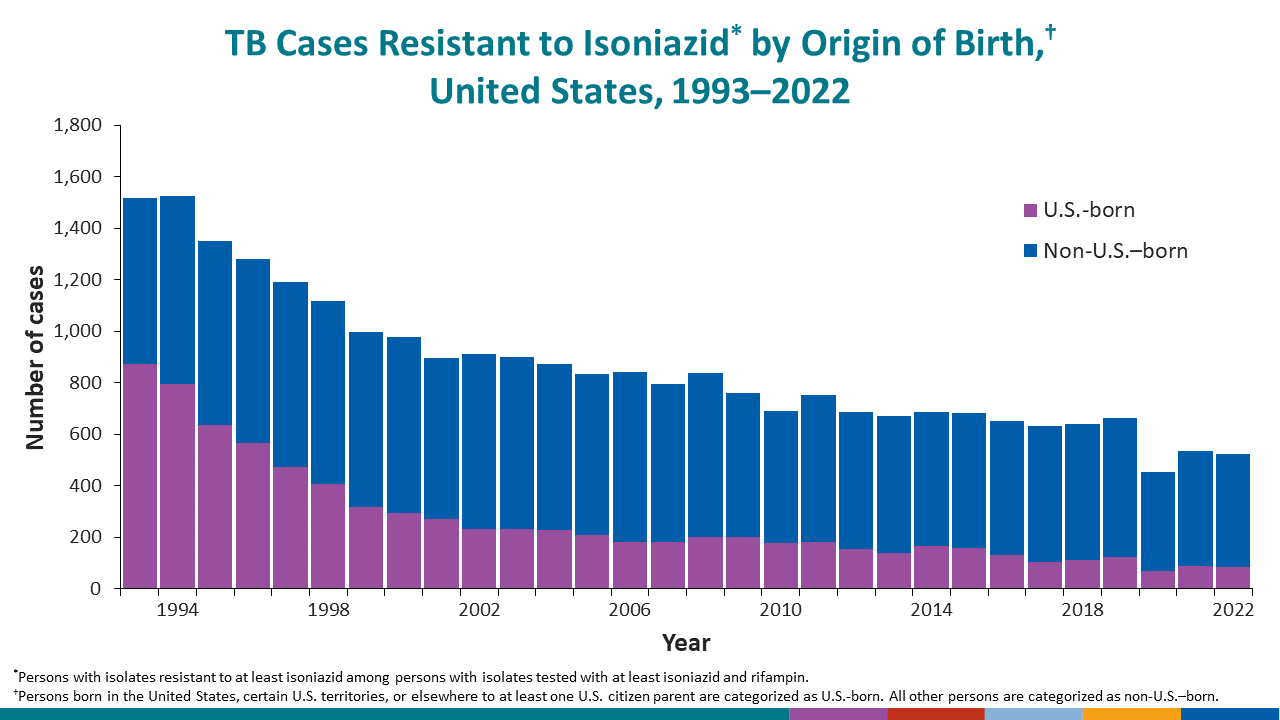
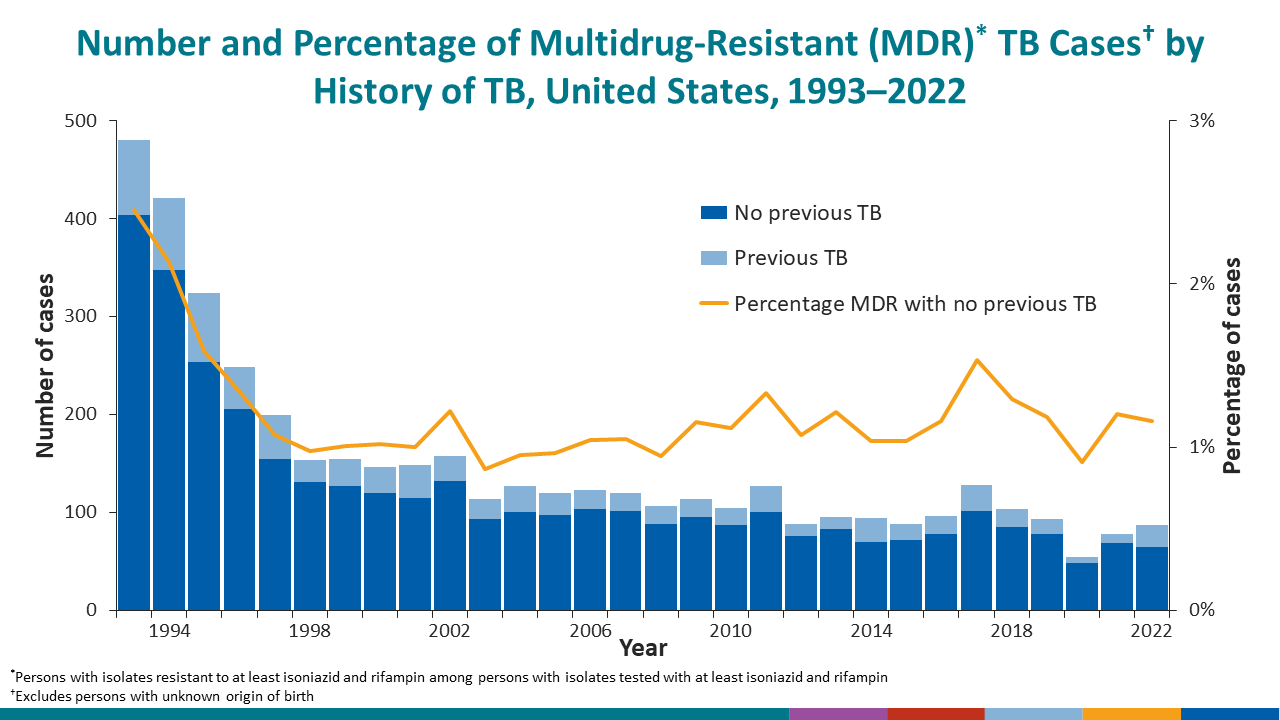
Table 12. Tuberculosis Cases and Percentages Among U.S.-Born Persons1 by Drug Resistance and History of Previous TB Disease: United States, 1993–2022
See surveillance slides #42 and #43.
| Year | Total cases2 | Isoniazid (INH)-resistant3 | Multidrug resistant (MDR)4 | Previous TB | No previous TB | ||||||||||
|---|---|---|---|---|---|---|---|---|---|---|---|---|---|---|---|
| Total cases | INH-resistant | MDR | Total cases | INH-resistant | MDR | ||||||||||
| No. | (%) | No. | (%) | No. | (%) | No. | (%) | No. | (%) | No. | (%) | ||||
| 2022 | 1,504 | 86 | (5.7) | 11 | (0.7) | 71 | 6 | (8.5) | 1 | (1.4) | 1,400 | 78 | (5.6) | 10 | (0.7) |
| 2021 | 1,565 | 88 | (5.6) | 9 | (0.6) | 39 | 0 | (0.0) | 0 | (0.0) | 1,507 | 85 | (5.6) | 9 | (0.6) |
| 2020 | 1,478 | 71 | (4.8) | 3 | (0.2) | 43 | 2 | (4.7) | 0 | (0.0) | 1,425 | 68 | (4.8) | 3 | (0.2) |
| 2019 | 1,897 | 124 | (6.5) | 13 | (0.7) | 59 | 4 | (6.8) | 1 | (1.7) | 1,826 | 119 | (6.5) | 12 | (0.7) |
| 2018 | 1,931 | 112 | (5.8) | 13 | (0.7) | 57 | 7 | (12.3) | 1 | (1.8) | 1,865 | 104 | (5.6) | 12 | (0.6) |
| 2017 | 1,906 | 106 | (5.6) | 19 | (1.0) | 58 | 3 | (5.2) | 2 | (3.4) | 1,845 | 103 | (5.6) | 17 | (0.9) |
| 2016 | 2,139 | 130 | (6.1) | 8 | (0.4) | 83 | 7 | (8.4) | 0 | (0.0) | 2,050 | 122 | (6.0) | 8 | (0.4) |
| 2015 | 2,298 | 158 | (6.9) | 13 | (0.6) | 101 | 7 | (6.9) | 3 | (3.0) | 2,192 | 150 | (6.8) | 10 | (0.5) |
| 2014 | 2,273 | 167 | (7.3) | 10 | (0.4) | 94 | 5 | (5.3) | 0 | (0.0) | 2,173 | 162 | (7.5) | 10 | (0.5) |
| 2013 | 2,373 | 140 | (5.9) | 9 | (0.4) | 98 | 8 | (8.2) | 2 | (2.0) | 2,261 | 129 | (5.7) | 7 | (0.3) |
| 2012 | 2,637 | 154 | (5.8) | 13 | (0.5) | 126 | 8 | (6.3) | 0 | (0.0) | 2,504 | 146 | (5.8) | 13 | (0.5) |
| 2011 | 2,831 | 182 | (6.4) | 18 | (0.6) | 136 | 10 | (7.4) | 1 | (0.7) | 2,681 | 171 | (6.4) | 17 | (0.6) |
| 2010 | 3,076 | 179 | (5.8) | 17 | (0.6) | 132 | 13 | (9.8) | 3 | (2.3) | 2,921 | 165 | (5.6) | 14 | (0.5) |
| 2009 | 3,228 | 201 | (6.2) | 13 | (0.4) | 116 | 6 | (5.2) | 1 | (0.9) | 3,086 | 192 | (6.2) | 12 | (0.4) |
| 2008 | 3,853 | 202 | (5.2) | 24 | (0.6) | 171 | 13 | (7.6) | 3 | (1.8) | 3,644 | 188 | (5.2) | 21 | (0.6) |
| 2007 | 4,075 | 181 | (4.4) | 22 | (0.5) | 206 | 14 | (6.8) | 3 | (1.5) | 3,846 | 163 | (4.2) | 18 | (0.5) |
| 2006 | 4,348 | 184 | (4.2) | 20 | (0.5) | 204 | 9 | (4.4) | 1 | (0.5) | 4,122 | 172 | (4.2) | 19 | (0.5) |
| 2005 | 4,662 | 210 | (4.5) | 23 | (0.5) | 240 | 18 | (7.5) | 2 | (0.8) | 4,394 | 188 | (4.3) | 20 | (0.5) |
| 2004 | 4,969 | 229 | (4.6) | 30 | (0.6) | 274 | 15 | (5.5) | 4 | (1.5) | 4,678 | 213 | (4.6) | 26 | (0.6) |
| 2003 | 5,142 | 231 | (4.5) | 26 | (0.5) | 253 | 16 | (6.3) | 2 | (0.8) | 4,846 | 213 | (4.4) | 23 | (0.5) |
| 2002 | 5,438 | 231 | (4.2) | 38 | (0.7) | 304 | 23 | (7.6) | 3 | (1.0) | 5,056 | 205 | (4.1) | 35 | (0.7) |
| 2001 | 5,960 | 271 | (4.5) | 41 | (0.7) | 325 | 28 | (8.6) | 7 | (2.2) | 5,565 | 240 | (4.3) | 34 | (0.6) |
| 2000 | 6,550 | 294 | (4.5) | 42 | (0.6) | 360 | 22 | (6.1) | 2 | (0.6) | 6,135 | 269 | (4.4) | 40 | (0.7) |
| 1999 | 7,476 | 319 | (4.3) | 46 | (0.6) | 382 | 25 | (6.5) | 6 | (1.6) | 7,007 | 284 | (4.1) | 39 | (0.6) |
| 1998 | 8,233 | 408 | (5.0) | 61 | (0.7) | 485 | 38 | (7.8) | 6 | (1.2) | 7,691 | 365 | (4.7) | 55 | (0.7) |
| 1997 | 9,183 | 472 | (5.1) | 89 | (1.0) | 455 | 35 | (7.7) | 12 | (2.6) | 8,696 | 435 | (5.0) | 76 | (0.9) |
| 1996 | 10,241 | 565 | (5.5) | 125 | (1.2) | 558 | 68 | (12.2) | 21 | (3.8) | 9,630 | 495 | (5.1) | 104 | (1.1) |
| 1995 | 10,992 | 637 | (5.8) | 199 | (1.8) | 592 | 77 | (13.0) | 28 | (4.7) | 10,332 | 554 | (5.4) | 169 | (1.6) |
| 1994 | 11,780 | 794 | (6.7) | 274 | (2.3) | 691 | 81 | (11.7) | 35 | (5.1) | 11,004 | 706 | (6.4) | 238 | (2.2) |
| 1993 | 12,530 | 873 | (7.0) | 331 | (2.6) | 668 | 83 | (12.4) | 30 | (4.5) | 11,802 | 788 | (6.7) | 301 | (2.6) |
1Persons born in the United States, certain U.S. territories, or elsewhere to at least one U.S. citizen parent are categorized as U.S.-born. All other persons are categorized as non-U.S.–born.
2Persons with isolates tested with at least isoniazid and rifiampin.
3Resistance to at least isoniazid.
4Resistance to at least isoniazid and rifampin.
Note:
Data for all years are updated through July 8, 2023.