National TB Performance Targets
Updated November 21, 2022

What are national TB performance targets?
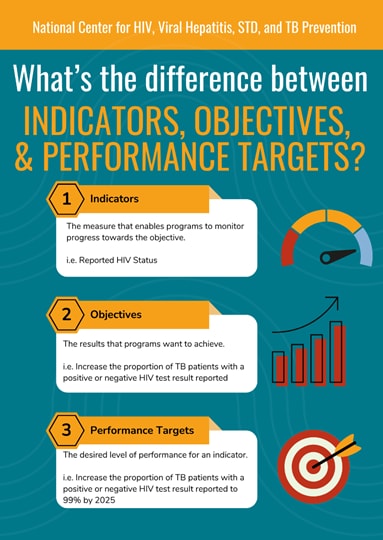
Every five years, CDC updates national performance targets for Tuberculosis (TB) programs in the United States (U.S.). These targets were developed to track U.S. TB program progress toward TB elimination. The 2025 National TB Program Objectives & Performance Targets table [PDF – 106 KB] lists all current objectives and targets.
National TB Performance targets are measurable and aspirational and are intended to be used by TB programs to assess their level of performance in achieving national program objectives. In short, they are longer-term goals to work toward.
Should all programs expect to achieve the National Performance Target by the target year?
Targets are set using historical data and do not consider program resources or local TB epidemiology. Programs should aim for steady progress to achieve targets. While TB programs should make efforts to reach targets, the targets are not annual TB program requirements. Achieving the National Performance Target is a marathon, not a sprint.
Regular performance monitoring and program evaluation can help TB programs document their progress. Programs can use the National TB Indicators Project (NTIP) as a tool to conduct routine program monitoring. NTIP provides information that is used to show how a program is performing over time and how a program is performing to reach a target. Monitoring and evaluation can help identify areas for improvement to assist TB programs in achieving the performance targets. Once a TB program identifies why it is performing well or where improvement is needed, changes can be made over time to move closer to the target. Additionally, program performance can be used to brief local leadership who may be able to provide additional input and needed resources.
How are targets calculated?
TB targets are calculated using national surveillance data from previous years. The target is set at a level that 10% of TB programs have already reached in the most recent reporting period with available data.
For 2025, the national TB performance targets for each national TB program objective were calculated using TB surveillance data reported to CDC from years 2010 to 2018. A quantile regression model was used to estimate the 90th percentile for each year. The fitted model was extrapolated to predict the estimated 90th percentile in the year 2018, which serves as the target for 2025. The 90th percentile values reflect the projected performance in 2018 of the top 10% of TB programs in the United States.
A quantile regression establishes a smooth trend over time, which is useful since the actual percentiles in any given year may not be representative of the overall trend. Therefore, a regression model is used to predict values (even for years that have actual data values). The predicted value is used as the future target.1 The model allows us to identify a level of performance that is a realistic target for TB programs to aim towards over the next five-year period. Although aspirational for some, at least 10% of programs have already reached this level of performance by the beginning of the five-year period, indicating that it is achievable.

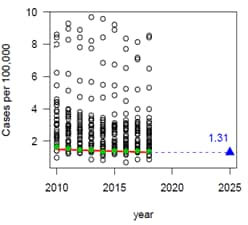
The following example shows the calculation of the 2025 national program target for reducing TB incidence to a rate of 1.31 per 100,000 persons or less.
- Annual TB incidence data for 2010-2018 for each of the 52 reporting areas (50 states, New York City, and Washington, D.C.) are graphed to the right using black (open) circles to represent a single reporting area.
- The green (colored/shaded in circles) represent the lowest 10th percentile of TB incidence in each year.
- The red (solid) line is the 10th percentile regression line and smooths the estimates over the entire period. The regression line is based on the value that represents the 10th percentile and considers the trend across all the years. The predicted value for 2018 is 1.31, which is used as the 2025 target.

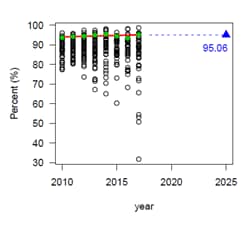
- Another example shows the calculation of the 2025 national performance target of 95% of TB patients completing treatment within 12 months.
- The graph at the right shows annual treatment completion data for the 52 reporting areas over 2010-2018. Notice a drop in the 10th percentile completion rate (the green circle) for 2017, but the red smoothed estimate is above it.
- The predicted value (the red, solid line) is 95.06% for 2018, which is used as the 2025 target.
Notes:
1More statistical detail: Reporting areas that have fewer than 150 cases over the entire baseline period (for example, 2010-2018) are excluded from all target calculations due to unreliable trends. Additionally, reporting areas with a non-U.S.-born population or U.S.-born non-Hispanic black or African American population less than an average of 100,000 persons per year in the most recent three-year period available are excluded in the statistical model for TB incidence rates for non-U.S.-born persons and U.S.-born non-Hispanic blacks or African Americans because the data would be too small to establish a reliable trend.