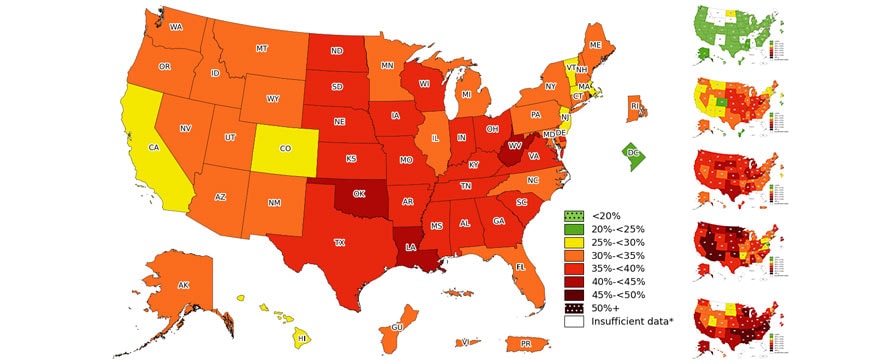
Table 13D
2011 Pediatric Nutrition Surveillance(1)
National
Summary of Trends in Breastfeeding
Children Aged Less Than 5 years (2)
| Summary of Trends in Breastfeeding (3) | ||||||
|---|---|---|---|---|---|---|
| Breastfeeding (4) | ||||||
| Year |
Number Included |
% |
Number Included |
% |
Number Included |
% |
| 2011 | 1,554,257 | 66.3 | 818,127 |
26.0 |
939,360 |
17.9 |
| 2010 | 1,689,615 | 63.2 | 908,604 |
25.1 |
1,069,942 |
16.9 |
| 2009 | 1,769,160 | 61.7 | 911,779 |
27.0 |
1,092,573 |
18.5 |
| 2008 | 1,776,095 | 61.7 | 887,500 |
26.6 |
1,092,493 |
18.7 |
| 2007 | 1,747,004 | 59.8 | 874,434 |
25.4 |
979,105 |
17.5 |
| 2006 | 1,577,832 | 60.1 | 790,341 |
25.2 |
875,205 |
18.1 |
| 2005 | 1,515,954 | 58.5 | 751,259 |
24.3 |
869,342 |
17.7 |
| 2004 | 1,466,352 | 56.1 | 730,949 |
23.4 |
816,328 |
17.5 |
| 2003 | 1,244,877 | 55.1 | 606,003 |
23.4 |
701,977 |
17.3 |
| 2002 | 1,014,091 | 52.5 | 546,600 |
20.7 |
582,948 |
12.3 |
| 2001 | 553,594 | 50.1 | 311,294 |
21.5 |
310,791 |
13.9 |
| 2000 | 905,154 | 48.0 | 504,089 |
19.7 |
478,170 |
12.3 |
| 1999 | 864,433 | 47.8 | 495,446 |
18.6 |
452,736 |
11.7 |
| 1998 | 877,246 | 47.8 | 490,802 |
18.1 |
475,699 |
11.8 |
| 1997 | 750,078 | 45.1 | 440,557 |
16.8 |
416,287 |
11.4 |
| 1996 | 796,109 | 43.7 | 479,281 |
15.6 |
461,059 |
10.1 |
| 1995 | 717,537 | 41.6 | 409,439 |
16.0 |
401,859 |
10.7 |
| 1994 | 692,196 | 39.2 | 379,703 |
14.7 |
363,662 |
10.1 |
| 1993 | 479,000 | 38.9 | 266,051 |
15.0 |
271,481 |
11.6 |
| 1992 | 374,892 | 36.3 | 243,882 |
15.1 |
230,718 |
10.7 |
| 1991 | 511,841 | 32.5 | 258,025 |
13.7 |
241,238 |
10.6 |
| 1990 | 403,472 | 38.1 | 204,682 |
13.1 |
175,847 |
9.8 |
| 1989 | 347,322 | 37.9 | 185,009 |
13.4 |
160,759 |
10.3 |
| 1988 | 324,476 | 37.0 | 179,168 |
12.8 |
144,450 |
9.7 |
| 1987 | 266,327 | 39.4 | 157,403 |
12.7 |
123,455 |
10.8 |
| 1986 | 218,391 | 42.6 | 144,971 |
14.1 |
102,730 |
10.8 |
| 1985 | 173,368 | 46.0 | 116,531 |
14.3 |
78,866 |
10.8 |
| 1984 | 137,267 | 42.7 | 89,165 |
12.1 |
61,384 |
8.1 |
| 1983 | 34,661 | 41.3 | 23,107 |
14.5 |
15,338 |
10.5 |
| 1982 | 9,242 | 35.5 | 5,759 |
17.1 |
4,282 |
9.9 |
| 1981 | 1,274 | 32.4 | 1,263 |
8.2 |
1,096 |
7.1 |
| 1980 | 1,081 | 28.0 | 1,053 |
9.0 |
842 |
4.5 |
| (1) Reporting period is January 1 through December 31. (2) Analyses based on one record per child. (3) Excludes records with unknown data or errors. (4) Infants born during the reporting period included in the Ever Breastfed analysis. Infants who turned 6 months of age during the reporting period by/on their date of visit included in the Breastfed At Least 6 Months analysis. Children who turned 12 months of age during the reporting period by/on their date of visit included in the Breastfed At Least 12 Months analysis. * Percentages are not calculated if < 100 records are available for analysis after exclusions. |
||||||