Maritime Industries: Aquaculture
Aquaculture

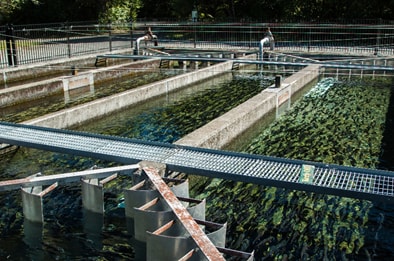
Fish swim in man-made ponds at a trout farm. Photo: JMasis, iStock/Getty Images Plus
The aquaculture industry is engaged in the raising and production of plants or animals in either a controlled farm environment or selected aquatic environments. Freshwater aquaculture produces species that are native to freshwater streams, lakes, and rivers. Freshwater aquaculture primarily takes place in ponds, tanks, and in land-based systems. Marine aquaculture (mariculture) refers to species that live in the ocean and can take place in the ocean or on land.
Workers in aquaculture may be exposed to a variety of hazards on the job. Aquaculture workers use not only waterborne vessels, but also tractors or other all-terrain vehicles which have their own unique hazards. Extreme temperatures, bacterial pathogens, heavy lifting, repetitive motions, noise, long hours and shift work, chemical exposures, hazardous machinery, and use of a variety of vehicles all contribute to the risk of injury or illness in these workers.
U.S. aquaculture production was 633 million pounds with a value of $1.5 billion in 2016.1 Freshwater production in the U.S. is primarily includes catfish, crawfish, trout. 1 Marine aquaculture (mariculture) in the U.S. primarily includes salmon, oysters, clams, shrimp, and mussels.1
In 2011–2017, there were an average of 6,627 workers employed in the aquaculture industry.2 These workers suffer fatal injuries at a rate of 18.9 per 100,000.3 Additionally, occupational injuries and illnesses occur in this worker population at a rate of 5,237 per 100,000. This is approximately twice the rate of injury/illness among all U.S. workers.4
- NOAA [2019]. Fisheries of the United States, 2017 report. Silver Spring, MD: National Oceanic and Atmospheric Administration, Fisheries, https://www.fisheries.noaa.gov/resource/document/fisheries-united-states-2017-reportexternal icon.
- BLS [2019]. NAICS 1125 Aquaculture, all U.S., private, 2011–2017. In Quarterly Census of Employment and Wages. Washington DC: U.S. Department of Labor, Bureau of Labor Statistics, https://data.bls.gov/cew/apps/data_views/data_views.htm#tab=TablesExternalexternal icon.
- BLS [2019]. NAICS 1125 Aquaculture, all U.S., private, 2011–2017. In Census of Fatal Occupational Injuries. Washington DC: U.S. Department of Labor, Bureau of Labor Statistics, https://www.bls.gov/data/#injuriesExternalexternal icon.
- BLS [2019]. Table 2. Numbers of nonfatal occupational injuries and illnesses by industry and case types, 2011–2017. In Survey of Occupational Injuries and Illnesses. Washington DC: U.S. Department of Labor, Bureau of Labor Statistics, https://www.bls.gov/iif/oshsum.htmExternalexternal icon.
