Purpose
- NIOSH researchers monitor workplace lead exposure trends through the Adult Blood Lead Epidemiology and Surveillance (ABLES) program.
- Use the interactive Tableau data visualizations below to analyze adult lead exposures by year, by state, and by industry.
About the data
CDC/NIOSH researchers assess workplace lead exposure trends across the United States using the state data compiled through the Adult Blood Lead Exposure Surveillance (ABLES) program. Among adults with known lead exposures and blood lead levels (BLLs) of 10 µg/dL or more, about 90% had occupational exposure.
The data from the visuals below are available in an Excel workbook. The visuals will be updated as new data become available.
More data visuals available using Worker Health Charts!
In addition to these dashboards, you can also examine lead exposure data using the Worker Health Charts tool.
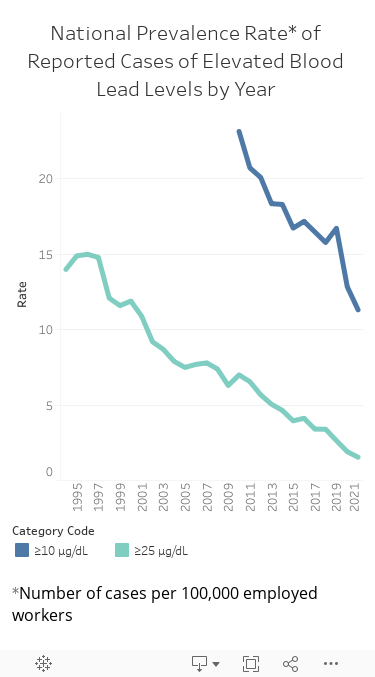
By year
Please note: In 2011, the case definition for elevated BLL was reduced from 25 µg/dL to 10 µg/dL. Therefore, data for 10 µg/dL was not collected until 2011.
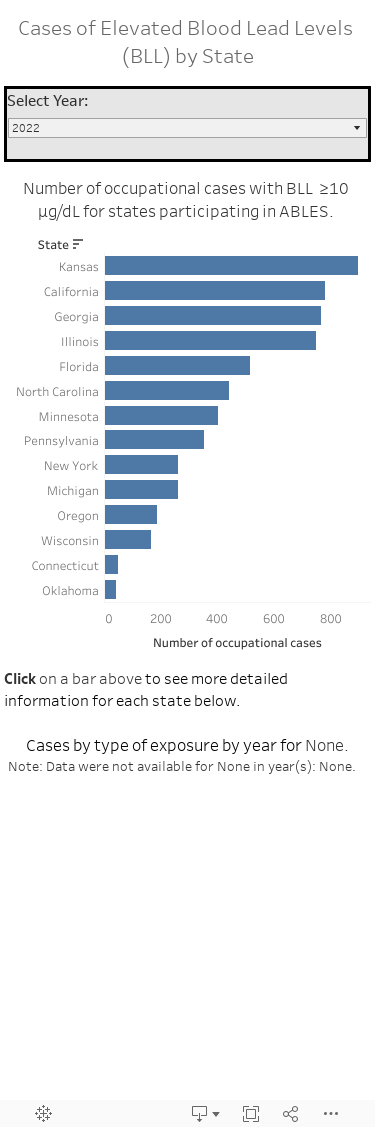
By state
When looking at the visual below, please note:
- Some states may be missing a year or two of data. In these cases, no data will display for that year.
- Some states don't have the resources needed to determine if a lead exposure is work-related or not work-related.
- States may be required to follow-up on cases to get complete exposure data.
- States who do not have enough resources to do these follow-ups have a higher number of unknown exposure cases.
Content Source:
National Institute for Occupational Safety and Health