Dental Care Utilization Among Adults Aged 18−64: United States, 2019 and 2020
NCHS Data Brief No. 435, April 2022
PDF Version (517 KB)
- Key findings
- Between 2019 and 2020, the percentage of adults aged 18–64 who had a dental visit in the past 12 months decreased.
- Between 2019 and 2020, the percentage of adults aged 18–64 who had a dental visit in the past 12 months decreased among all race and Hispanic-origin groups.
- Between 2019 and 2020, the percentage of adults who had a dental visit in the past 12 months decreased in all family income levels.
- Between 2019 and 2020, the percentage of adults who had a dental visit in the past 12 months decreased in all urban and rural areas.
- Summary
Data from the National Health Interview Survey
- From 2019 to 2020, the percentage of adults aged 18−64 who had a dental visit in the past 12 months declined overall (from 65.5% to 62.7%) and in both men (61.5% to 59.6%) and women (69.3% to 65.8%).
- Between 2019 and 2020, the percentage of adults who had a dental visit in the past 12 months decreased in all race and Hispanic-origin groups.
- For each family income level, the percentage of adults who had a dental visit in the past 12 months was lower in 2020 than in 2019.
- Among adults in large central, large fringe, and medium and small metropolitan areas, dental visits in the past 12 months declined between 2019 and 2020.
Oral health is an essential component of overall health and well-being (1,2). Along with good oral hygiene, an important factor of oral health is regular dental care (3). However, about 35% of adults aged 18 and over did not have a dental visit in 2019 (4), and predictors such as age, race, sex, and socioeconomic status were associated with delayed dental care among adults in the United States (5). In 2020, many dental practices limited their hours and services in response to the COVID-19 pandemic (6,7). This report uses data from the 2019 and 2020 National Health Interview Survey (NHIS) to describe recent changes in the prevalence of dental visits among adults aged 18–64.
Keywords: oral health, preventive care, National Health Interview Survey
Between 2019 and 2020, the percentage of adults aged 18–64 who had a dental visit in the past 12 months decreased.
- The percentage of adults who had a dental visit in the past 12 months decreased from 65.5% in 2019 to 62.7% in 2020 (Figure 1).
- The percentage of adults who had a dental visit decreased in both men (from 61.5% to 59.6%) and women (69.3% to 65.8%).
- In both 2019 and 2020, women were more likely than men to have had a dental visit.
Figure 1. Percentage of adults aged 18–64 with a dental visit in the past 12 months, by survey year and sex: United States, 2019 and 2020
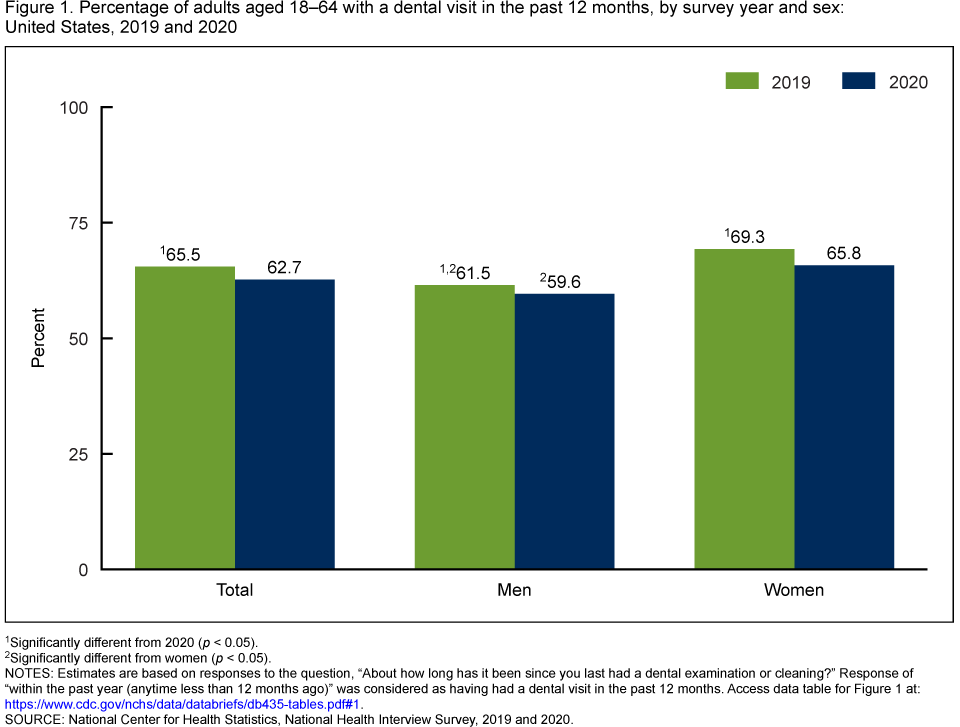
1Significantly different from 2020 (p < 0.05).
2Significantly different from women (p < 0.05).
NOTES: Estimates are based on responses to the question, “About how long has it been since you last had a dental examination or cleaning?” Response of “within the past year (anytime less than 12 months ago)” was considered as having had a dental visit in the past 12 months. Access data table for Figure 1.
SOURCE: National Center for Health Statistics, National Health Interview Survey, 2019 and 2020.
Between 2019 and 2020, the percentage of adults aged 18–64 who had a dental visit in the past 12 months decreased among all race and Hispanic-origin groups.
- From 2019 to 2020, the percentage of adults who had a dental visit in the past 12 months declined among Hispanic (from 58.6% to 55.3%), non-Hispanic White (68.3% to 66.6%), non-Hispanic Black (61.1% to 56.8%), non-Hispanic Asian (70.1% to 64.3%), and non-Hispanic other and multiple race (60.1% to 52.8%) adults (Figure 2).
- In 2019 and 2020, non-Hispanic White and non-Hispanic Asian adults were more likely to have had a dental visit than Hispanic, non-Hispanic Black, and non-Hispanic adults of other and multiple races.
Figure 2. Percentage of adults aged 18–64 with a dental visit in the past 12 months, by survey year and race and ethnicity: United States, 2019 and 2020

1Significantly different from 2020 (p < 0.05).
2Significantly different from non-Hispanic White adults for both 2019 and 2020 (p) < 0.05).
3Significantly different from non-Hispanic Asian adults for both 2019 and 2020 (p < 0.05).
4Significantly different from non-Hispanic Black adults for both 2019 and 2020 (p < 0.05).
5Significantly different from non-Hispanic other and multiple race adults for both 2019 and 2020 (p < 0.05).
NOTES: Estimates are based on responses to the question, “About how long has it been since you last had a dental examination or cleaning?” Response of “within the past year (anytime less than 12 months ago)” was considered as having had a dental visit in the past 12 months. Access data table for Figure 2.
SOURCE: National Center for Health Statistics, National Health Interview Survey, 2019 and 2020.
Between 2019 and 2020, the percentage of adults who had a dental visit in the past 12 months decreased in all family income levels.
- From 2019 to 2020, the percentage of adults aged 18–64 who had a dental visit in the past 12 months decreased among those with family income less than 100% of the federal poverty level (FPL) (from 49.8% to 45.7%), 100% to less than 200% of FPL (50.6% to 47.1%), 200% to less than or equal to 400% of FPL (62.9% to 59.1%), and greater than 400% of FPL (78.8% to 76.0%) (Figure 3).
- In both 2019 and 2020, the percentage of adults who had a dental visit was similar between those with family income less than 100% of FPL and 100% to less than 200% of FPL and then increased with increasing family income.
Figure 3. Percentage of adults aged 18–64 with a dental visit in the past 12 months, by survey year and family income as a percentage of the federal poverty level: United States, 2019 and 2020

1Significantly different from 2020 (p < 0.05).
2Significant quadratic trend by FPL for both 2019 and 2020 (p < 0.05).
NOTES: FPL is federal poverty level. Estimates are based on responses to the question, “About how long has it been since you last had a dental examination or cleaning?” Response of “within the past year (anytime less than 12 months ago)” was considered as having had a dental visit in the past 12 months. Access data table for Figure 3.
SOURCE: National Center for Health Statistics, National Health Interview Survey, 2019 and 2020.
Between 2019 and 2020, the percentage of adults who had a dental visit in the past 12 months decreased in all urban and rural areas.
- From 2019 to 2020, the percentage of adults aged 18–64 who had a dental visit in the past 12 months decreased among those residing in large central metropolitan (from 66.9% to 63.8%), large fringe metropolitan (68.8% to 65.5%), and medium and small metropolitan (64.7% to 62.3%) areas (Figure 4). The observed difference within nonmetropolitan areas, from 57.6% in 2019 to 55.5% in 2020, was not significant.
- In both 2019 and 2020, the percentage of adults who had a dental visit remained consistent between large central metropolitan areas and large fringe metropolitan areas and decreased as urbanization level decreased, from large fringe metropolitan areas to nonmetropolitan areas.
Figure 4. Percentage of adults aged 18–64 with a dental visit in the past 12 months, by survey year and urbanicity: United States, 2019 and 2020

1Significantly different from 2020 (p < 0.05).
2Estimates are based on responses to the question, “About how long has it been since you last had a dental examination or cleaning?” Response of “within the past year (anytime less than 12 months ago)” was considered as having had a dental visit in the past 12 months. Access data table for Figure 3.
SOURCE: National Center for Health Statistics, National Health Interview Survey, 2019 and 2020.
Summary
This report examined changes in dental care utilization among adults aged 18–64 from 2019 to 2020. The percentage of adults with a dental visit in the past 12 months decreased overall as well as by sex, race and ethnicity, and family income. Among adults, fewer dental visits were reported in 2020 than in 2019 across all family income levels. Also, a positive trend was observed between the percentage of adults who had a dental visit in the past 12 months and family income as a percentage of FPL in both years. Adults who reside in metropolitan areas were less likely to have had a dental visit in 2020 compared with 2019.
A previous study reported several predictors of unmet dental need among adults in the United States (5). Therefore, the decline in dental visits between 2019 and 2020 may be attributable to other factors in addition to the impact of the COVID-19 pandemic.
Definitions
Dental visit in the past 12 months: Estimates are based on responses to the question, “About how long has it been since you last had a dental examination or cleaning?” A response of “within the past year (anytime less than 12 months ago)” was considered as having had a dental visit in the past 12 months.
Family income as a percentage of FPL: Based on the federal poverty level, which was derived from the family’s income in the previous calendar year and family size using the U.S. Census Bureau’s poverty thresholds (8). The 2019 and 2020 NHIS imputed income files were used to create the poverty levels (9).
Race and ethnicity: Race and ethnicity were shown for five specific groups: Hispanic, non-Hispanic White, non-Hispanic Black, non-Hispanic Asian, and non-Hispanic other and multiple races. People categorized as Hispanic may be of any race or combination of races. People categorized as non-Hispanic White, non-Hispanic Black, and non-Hispanic Asian indicated one race only. Non-Hispanic other and multiple races (includes those who did not identify as White, Black, Asian, or Hispanic, or who identified as more than one race) are combined into one category.
Urbanicity: Urbanicity was categorized by collapsing the 2013 National Center for Health Statistics (NCHS) Urban-Rural classification scheme for counties (10) into four categories: large central metropolitan, large fringe metropolitan, medium and small metropolitan counties, and nonmetropolitan (counties in micropolitan statistical areas and nonmetropolitan counties).
Data source and methods
Data from the 2019 and 2020 NHIS were used for this analysis. NHIS is a nationally representative household survey of the U.S. civilian noninstitutionalized population. The survey is conducted continuously throughout the year by NCHS. Due to the COVID-19 pandemic, data collection procedures in 2020 were disrupted, and from April through June all interviews were conducted by telephone only, and from July through December interviews were attempted by telephone first, with follow-ups to complete interviews by personal visit. Information on dental visits was collected during the Sample Adult interview. For more information about NHIS, visit: https://www.cdc.gov/nchs/nhis.
Point estimates and the corresponding variances were calculated using SAS-callable SUDAAN software (11) to account for the complex sample design of NHIS. All estimates in this report met NCHS standards of reliability as specified in “National Center for Health Statistics Data Presentation Standards for Proportions” (12). Tests for trend were evaluated using orthogonal polynomials in logistic regression. Differences between percentages were evaluated using two-sided significance tests at the 0.05 level.
About the authors
Amy E. Cha and Robin A. Cohen are with the National Center for Health Statistics, Division of Health Interview Statistics.
References
- U.S. Department of Health and Human Services. Oral Health. 2021.
- National Center for Chronic Disease Prevention and Health Promotion. Adult oral health: Facts about adult oral health. 2020.
- National Center for Chronic Disease Prevention and Health Promotion. Oral health tips: What can adults do to maintain good oral health? 2021.
- National Center for Health Statistics. Percentage of having a dental exam or cleaning in the past 12 months for adults aged 18 and over, United States, 2019–2020. National Health Interview Survey. Generated interactively: January 18, 2022.
- Gaskin DJ, Zare H, McCleary R, Kanwar O, Davis AL. Predictors of unmet dental health needs in US adults in 2018: A cross-sectional analysis. JDR Clin Trans Res. 2021. DOI: https://doi.org/10.1177/23800844211035669
- American Dental Association. ADA recommending dentists postpone elective procedures. ADA News. 2020.
- American Dental Association. HPI poll examines impact of COVID-19 on dental practices. ADA News. 2020.
- United States Census Bureau. Poverty thresholds.
- National Center for Health Statistics. Multiple imputation of family income in 2019 National Health Interview Survey: Methods. 2020.
- Ingram DD, Franco SJ. 2013 NCHS urban-rural classification scheme for counties. National Center for Health Statistics. Vital Health Stat 2(166). 2014.
- RTI International. SUDAAN (Release 11.0.3) [computer software]. 2018.
- Parker JD, Talih M, Malec DJ, Beresovsky V, Carroll M, Gonzalez JF Jr, et al. National Center for Health Statistics data presentation standards for proportions. National Center for Health Statistics. Vital Health Stat 2(175). 2017.
Suggested citation
Cha AE, Cohen RA. Dental care utilization among adults aged 18−64: United States, 2019 and 2020. NCHS Data Brief, no 435. Hyattsville, MD: National Center for Health Statistics. 2022. DOI: https://dx.doi.org/10.15620/cdc:115597.
Copyright information
All material appearing in this report is in the public domain and may be reproduced or copied without permission; citation as to source, however, is appreciated.
National Center for Health Statistics
Brian C. Moyer, Ph.D., Director
Amy M. Branum, Ph.D., Associate Director for Science
Division of Health Interview Statistics
Stephen J. Blumberg, Ph.D., Director
Anjel Vahratian, Ph.D., M.P.H., Associate Director for Science