Contribution of Whole Grains to Total Grains Intake Among Adults Aged 20 and Over: United States, 2013–2016
- Key findings
- What was the contribution of whole grains to total grains intake among adults on a given day, and did the contribution differ by sex and age during 2013–2016?
- Did the contribution of whole grains to total grains intake among adults on a given day differ by race and Hispanic origin during 2013–2016?
- Did the contribution of whole grains to total grains intake among adults on a given day differ by family income level during 2013–2016?
- Did the contribution of whole grains to total grains intake among adults on a given day change over time from 2005–2006 to 2015–2016?
- Summary
- Definitions
- Data source and methods
- About the authors
- References
- Suggested citation
PDF Version (481 KB)
Namanjeet Ahluwalia, Ph.D., D.Sc., Kirsten A. Herrick, M.Sc., Ph.D., Ana L. Terry, M.S., R.D., and Jeffery P. Hughes, M.P.H.
Key findings
Data from the National Health and Nutrition Examination Survey
- During 2013–2016, whole grains accounted for 15.8% of total grains intake among adults on a given day. This percentage increased with age from 12.9% among adults aged 20–39 to 19.7% for adults 60 and over.
- Overall, the contribution of whole grains to total grains intake was lower among men (14.8%) than women (16.7%).
- The contribution of whole grains to total grains intake was lowest among Hispanic adults (11.1%) compared with non-Hispanic white (16.5%), non-Hispanic black (13.7%), and non-Hispanic Asian (18.3%) adults.
- The contribution of whole grains to total grains intake on a given day increased with increasing family income.
- From 2005–2006 to 2015–2016, the contribution of whole grains to total grains intake increased for adults overall, and for men and women.
Total grains intake comes from whole grains and refined grains. Whole grains contain the entire grain kernel (bran, germ, and endosperm) (1). A higher intake of whole grains is linked with a lower risk of cardiovascular disease, cancer, and mortality (2). The “2015–2020 Dietary Guidelines for Americans” recommend that at least one-half of total grains intake be from whole grains (3). This report provides estimates of the percentage of total grains intake consumed from whole grains sources, for adults aged 20 and over who reported consumption of grains (98.6%) on a given day during 2013–2016.
Keywords: diet, National Health and Nutrition Examination Survey (NHANES)
What was the contribution of whole grains to total grains intake among adults on a given day, and did the contribution differ by sex and age during 2013–2016?
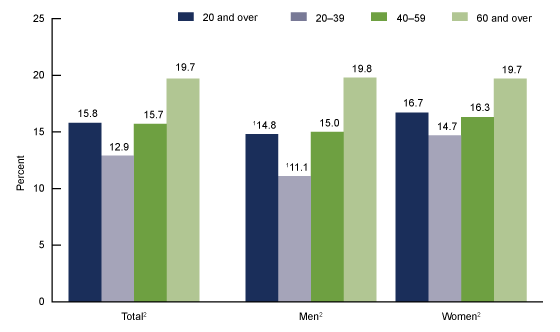
In 2013–2016, 15.8% of total grains intake for adults on a given day was whole grains. The percentage increased with age for men and women (Figure 1).
The contribution of whole grains to total grains intake increased from 12.9% among adults aged 20–39 to 19.7% for adults aged 60 and over.
Whole grains contributed to a lower percentage of total grains intake among men (14.8%) compared with women (16.7%). Similarly, among adults aged 20–39, the percentage of total grains consumed as whole grains was lower among men (11.1%) than among women (14.7%).
Figure 1. Contribution of whole grains to total grains intake among adults aged 20 and over on a given day, by sex and age: United States, 2013–2016
1Significantly different from women of the same age group.
2Significant increasing linear trend with age.
NOTES: Age-adjusted estimates for adults aged 20 and over, using the direct method and the 2000 projected U.S. population using the age groups 20–39, 40–59, and 60 and over, are 15.5% for total, 14.6% for men, and 16.4% for women. Access data table for Figure 1.
SOURCE: NCHS, National Health and Nutrition Examination Survey, 2013–2016.
Did the contribution of whole grains to total grains intake among adults on a given day differ by race and Hispanic origin during 2013–2016?
Whole grains contributed to a lower percentage of total grains intake among Hispanic adults (11.1%) on a given day compared with non-Hispanic white (16.5%), non-Hispanic black (13.7%), and non-Hispanic Asian (18.3%) adults (Figure 2). The contribution of whole grains to total grains intake was also lower among non-Hispanic black adults compared with non-Hispanic white and non-Hispanic Asian adults.
The same patterns were noted for women, with contribution of whole grains to total grains intake being the lowest among Hispanic women (12.1%) compared with non-Hispanic white (17.4%), non-Hispanic black (14.3%), and non-Hispanic Asian (18.6%) women. The contribution of whole grains to total grains intake among non-Hispanic black women was also lower than non-Hispanic white and non-Hispanic Asian women.
Among men, a similar pattern was noted except that the observed difference in the percent contribution of whole grains to total grains intake between non-Hispanic black (12.9%) and Hispanic (10.0%) men was not significant. Whole grains contribution to total grains intake among Hispanic men was lower than among non-Hispanic white (15.7%) and non-Hispanic Asian (18.1%) men, and lower for non-Hispanic black men compared with non-Hispanic white and non-Hispanic Asian men.
Within each race and Hispanic-origin group, no differences were observed between men and women.
Figure 2. Age-adjusted contribution of whole grains to total grains intake among adults aged 20 and over on a given day, by sex and race and Hispanic origin: United States, 2013–2016
1Significantly different from non-Hispanic black adults.
2Significantly different from Hispanic adults.
3Significantly different from non-Hispanic Asian adults.
NOTES: Estimates were age adjusted by the direct method to the 2000 U.S. population using the age groups 20–39, 40–59, and 60 and over. Access data table for Figure 2.
SOURCE: NCHS, National Health and Nutrition Examination Survey, 2013–2016.
Did the contribution of whole grains to total grains intake among adults on a given day differ by family income level during 2013–2016?
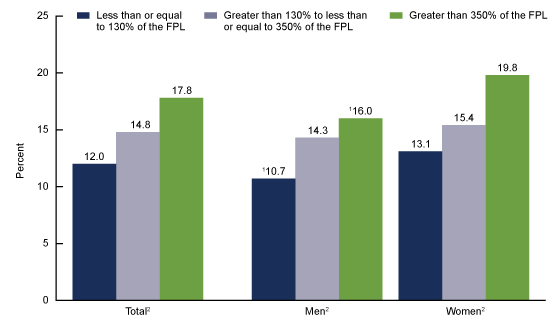
The contribution of whole grains to total grains intake on a given day increased with increasing family income (Figure 3). Overall, whole grains accounted for 12.0%, 14.8%, and 17.8% of total grains intake for those with family incomes less than or equal to 130% of the federal poverty level (FPL), greater than 130% to less than or equal to 350% of the FPL, and greater than 350% of the FPL, respectively. A similar pattern occurred among both men and women.
Within the lowest and highest income levels, the percent contribution was lower among men compared with women: 10.7% compared with 13.1% among adults with family income less than or equal to 130% of the FPL, and 16.0% compared with 19.8% among adults with family income greater than 350% of the FPL.
Figure 3. Age-adjusted contribution of whole grains to total grains intake among adults aged 20 and over on a given day, by sex and family income level: United States, 2013–2016
1Significantly different from women of the same family income level.
2Significant increasing linear trend.
NOTES: FPL is federal poverty level. Estimates were age adjusted by the direct method to the 2000 U.S. population using the age groups 20–39, 40–59, and 60 and over. Significant increasing linear trend by family income level. Access data table for Figure 3.
SOURCE: NCHS, National Health and Nutrition Examination Survey, 2013–2016.
Did the contribution of whole grains to total grains intake among adults on a given day change over time from 2005–2006 to 2015–2016?
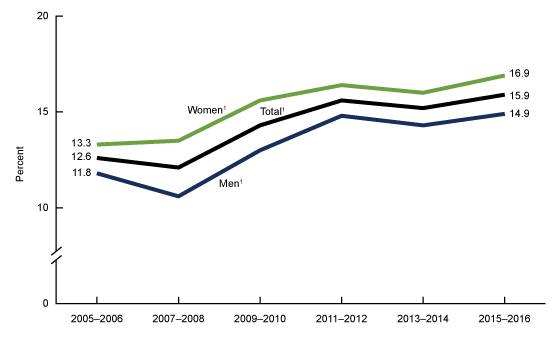
A linear increasing trend in the contribution of whole grains to total grains intake occurred from 2005–2006 to 2015–2016 (Figure 4). This percentage increased from 12.6% (2005–2006) to 15.9% (2015–2016) among adults overall. A similar increasing pattern over time was noted for both men and women.
Figure 4. Age-adjusted trends in the contribution of whole grains to total grains intake among adults aged 20 and over on a given day, by sex: United States, 2005–2006 through 2015–2016
1Significant increasing linear trend from 2005–2006 through 2015–2016.
NOTES: Estimates were age adjusted by the direct method to the 2000 U.S. population using the age groups 20–39, 40–59, and 60 and over. Women were significantly different from men at all time points except 2015–2016. Access data table for Figure 4.
SOURCE: NCHS, National Health and Nutrition Examination Survey, 2005–2016.
SOURCE: National Hospital Ambulatory Medical Care Survey, 2016.
Summary
During 2013–2016, whole grains contributed 15.8% of total grains intake on a given day among adults overall. This percentage increased with age and income, and was lower among Hispanic adults (11.1%) compared with all other race and Hispanic-origin groups. The contribution of whole grains to total grains intake was higher among women (16.7%) compared with men (14.8%). These findings are consistent with previously published tables showing intake of total, whole, and refined grains in the United States (4).
Furthermore, trends over time from 2005–2006 to 2015–2016 showed an increase in the contribution of whole grains to total grains intake for adults overall and for men and women. However, the magnitude of this increase was small. Whole grains contain greater amounts of fiber, vitamins, minerals, and phytochemicals compared with refined grains (1–3). Higher intake of whole grains, as part of a healthy eating pattern, may contribute to the maintenance of good health and has been shown to lower inflammation and provide cardiovascular benefits (2,3).
Definitions
Whole grains: Includes barley, brown rice, buckwheat, bulgur (cracked wheat), millet, oats, popcorn, quinoa, dark rye, whole-grain cornmeal, whole-grain cracked wheat, wild rice, and grain-based products made with 100% whole grains or their flours as defined in the Food Patterns Equivalents Database (FPED) (1). Data on total grains (ounce equivalent) and whole grains (ounce equivalent) were obtained from the FPEDs (1). The percentage of grains consumed as whole grains was computed for each participant who reported any grain intake as the ratio of whole grains consumed (ounce equivalent) to total grains consumed (ounce equivalent) multiplied by 100.
Federal poverty level: Based on the income-to-poverty ratio, a measure of the annual total family income divided by the poverty guidelines, adjusted for family size and inflation.
Data source and methods
Data for this report are from the National Health and Nutrition Examination Survey (NHANES), a cross-sectional survey (5) conducted by the National Center for Health Statistics designed to monitor the health and nutritional status of the civilian noninstitutionalized U.S. population. It consists of home interviews followed by standardized physical examinations conducted in mobile examination centers (MECs).
Dietary information was obtained via an in-person dietary recall with trained interviewers at the MEC for the 24-hour period on the preceding day (midnight to midnight) (6). Foods and beverages reported during the recall were categorized into 37 USDA Food Patterns components in the FPED (1). Total and whole grains intake data based on FPEDs available since 2005–2006 were used for these analyses. Limitations, such as underreporting associated with 24-hour recalls, have been well-characterized (7,8) but do not diminish the utility of the dietary data in describing population estimates (8,9). Whole grains intake, expressed as a percentage of total grains intake, partially adjusts for misreporting (10).
The NHANES sample is selected through a complex, multistage probability design. During 2013–2016, non-Hispanic black, non-Hispanic Asian, and Hispanic persons were oversampled; for more information, visit the NHANES website. Race and Hispanic-origin-specific estimates reflect individuals reporting only one race; those reporting more than one race are included in the total but are not reported separately. Study sample included adults aged 20 and over with complete and reliable dietary intake data, from 2005–2006 to 2015–2016 cycles. Adults who did not consume any grains were excluded from these analyses (less than 1.4%).
Day 1 dietary weights were used to account for the days of the week, and differential probabilities of selection, nonresponse, and noncoverage to obtain nationally representative estimates. Taylor series linearization was used to compute variance estimates. Differences between groups were tested using a univariate t statistic. Tests for trends by age, family income level, and trends over time were evaluated using orthogonal polynomials to determine linear trends. The significance level for statistical testing was set at p < 0.05. All differences reported are statistically significant unless otherwise indicated. Statistical analyses were conducted using SAS System for Windows version 9.4 (SAS Institute, Inc., Cary, N.C.) and SUDAAN version 11.0 (RTI International, Research Triangle Park, N.C.). Estimates were age adjusted using the direct method to the 2000 projected U.S. population using the age groups 20–39, 40–59, and 60 and over.
About the authors
Namanjeet Ahluwalia, Kirsten A. Herrick, Ana L. Terry, and Jeffery P. Hughes are with the National Center for Health Statistics, Division of Health and Nutrition Examination Surveys.
References
- U.S. Department of Agriculture. Food Patterns Equivalents Database 2015–2016: Methodology and user guide. 2018.
- Aune D, Keum N, Giovannucci E, Fadnes LT, Boffetta P, Greenwood DC, et al. Whole grain consumption and risk of cardiovascular disease, cancer, and all cause and cause specific mortality: Systematic review and dose-response meta-analysis of prospective studies. BMJ 353:i2716. 2016.
- U.S. Department of Health and Human Services, U.S. Department of Agriculture. 2015–2020 Dietary Guidelines for Americans, 8th ed. 2015.
- U.S. Department of Agriculture. Food Patterns Equivalents Database data tables. 2015–2016.
- Johnson CL, Dohrmann SM, Burt VL, Mohadjer LK. National Health and Nutrition Examination Survey: Sample design, 2011–2014. National Center for Health Statistics. Vital Health Stat 2(162). 2014.
- National Center for Health Statistics. National Health and Nutrition Examination Survey interviewer procedures manual. 2016.
- Subar AF, Freedman LS, Tooze JA, Kirkpatrick SI, Boushey C, Neuhouser ML, et al. Addressing current criticism regarding the value of self-report dietary data. J Nutr 145(12):2639–45. 2015.
- Ahluwalia N, Dwyer J, Terry A, Moshfegh A, Johnson C. Update on NHANES dietary data: Focus on collection, release, analytical considerations, and uses to inform public policy. Adv Nutr 7(1):121–34. 2016.
- Hébert JR, Hurley TG, Steck SE, Miller DR, Tabung FK, Peterson KE, et al. Considering the value of dietary assessment data in informing nutrition-related health policy. Adv Nutr 5(4):447–55. 2014.
- Willett W. Nutritional epidemiology, 3rd ed. New York: Oxford University Press. 2013.
Suggested citation
Ahluwalia N, Herrick KA, Terry AL, Hughes JP. Contribution of whole grains to total grains intake among adults aged 20 and over: United States, 2013–2016. NCHS Data Brief, no 341. Hyattsville, MD: National Center for Health Statistics. 2019.
Copyright information
All material appearing in this report is in the public domain and may be reproduced or copied without permission; citation as to source, however, is appreciated.
National Center for Health Statistics
Jennifer H. Madans, Ph.D., Acting Director
Amy M. Branum, Ph.D., Acting Associate Director for Science
Division of Health and Nutrition Examination Surveys
Kathryn S. Porter, M.D., M.S., Director
Ryne Paulose-Ram, M.A., Ph.D., Associate Director for Science


