Trends in Infant Mortality in the United States, 2005–2014
- Key findings
- Infant mortality rates have declined over the past decade.
- Infant mortality rates among Hispanic subgroups declined from 2005–2007 to 2012–2014.
- Infant mortality rates declined in most states from 2005–2007 to 2012–2014.
- From 2005 through 2014, infant mortality rates declined for four of the five leading causes of infant death.
- Summary
- Definitions
- Data sources and methods
- About the authors
- References
- Suggested citation
NCHS Data Brief No. 279, March 2017
PDF Version (408 KB)
T.J. Mathews, M.S., and Anne K. Driscoll, Ph.D.
Key findings
Data from the National Vital Statistics System
- In 2014, infant mortality rates for the United States reached new lows for Hispanic, non-Hispanic white, non-Hispanic black, and Asian or Pacific Islander populations.
- From 2005 through 2014, declines in infant mortality rates were observed for all race and Hispanic-origin subgroups except among American Indian or Alaska Native persons. The largest declines were among infants of Asian or Pacific Islander (21%) and non-Hispanic black (20%) women.
- Declines were observed from 2005–2007 to 2012–2014 for all Hispanic subgroups. The largest declines occurred among infants of Cuban (19%) and Puerto Rican (17%) women.
- From 2005 through 2014, the infant mortality rate for sudden infant death syndrome declined 29%, which was the largest decline observed among the top five leading causes of infant death.
Infant mortality is considered a basic measure of public health for countries around the world (1–3). Over the past decade, the overall infant mortality rate in the United States has improved, declining 15% from 6.86 infant deaths per 1,000 live births in 2005—a recent high—to 5.82 in 2014 (4). Over the years, many efforts have been made to understand and lower infant mortality (4,5). This report examines the 2014 linked birth/infant death data from the National Vital Statistics System (NVSS) to describe trends in infant mortality in the United States by race and Hispanic origin, state, and leading causes of infant deaths from 2005 through 2014.
Keywords: infant death, births, infant health, National Vital Statistics System
Infant mortality rates have declined over the past decade.
- From 2013 to 2014, only infants of non-Hispanic white women had a decline in the infant mortality rate (3%). Declines among other race and Hispanic-origin groups were not statistically significant (Figure 1).
- From 2005 through 2014, the rate declined 21% for infants of Asian or Pacific Islander (API) women (from 4.89 to 3.86 per 1,000) and 20% for infants of non-Hispanic black women (from 13.63 to 10.93).
- Infant mortality rates declined 15% for infants of non-Hispanic white women (from 5.76 to 4.89) and 11% for infants of Hispanic women (from 5.62 to 5.01).
- From 2005 through 2014, infants of both non-Hispanic black and American Indian or Alaska Native (AIAN) women had the highest mortality rates (10.93 and 7.59, respectively, in 2014).
Figure 1. Infant mortality rates, by race and Hispanic origin of mother: United States, 2005–2014
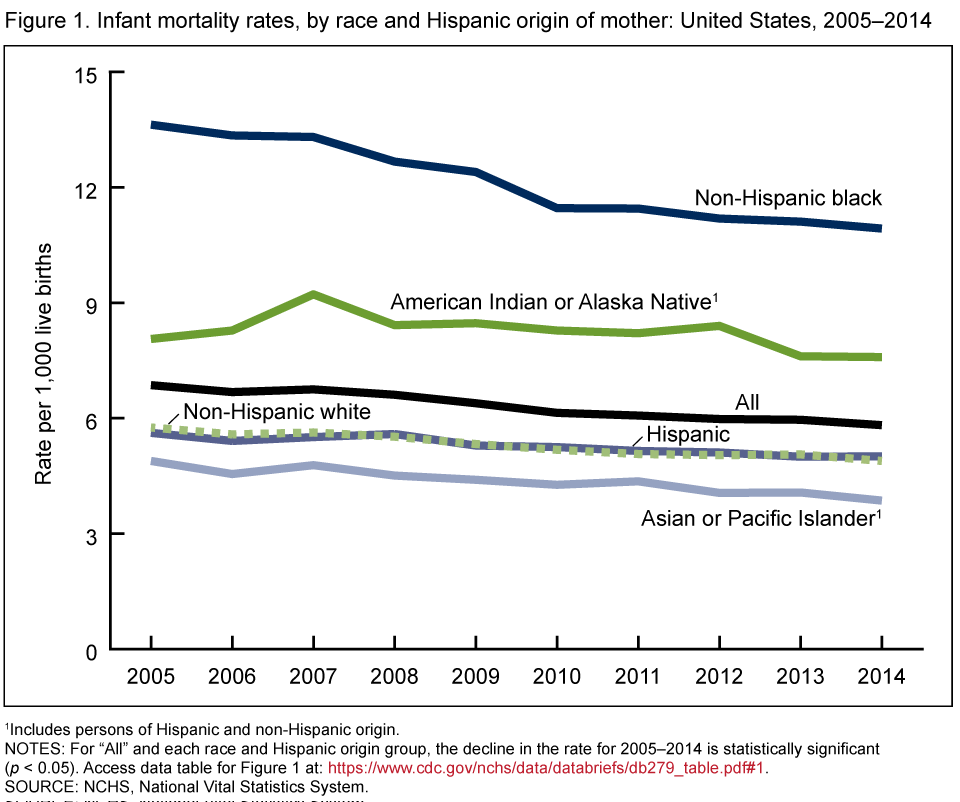
1Includes persons of Hispanic and non-Hispanic origin.
NOTES: For “Total” and each race and Hispanic-origin group, the decline in the rate for 2005–2014 is statistically significant (p < 0.05).
Access data table for Figure 1.
SOURCE: NCHS, National Vital Statistics System.
Infant mortality rates among Hispanic subgroups declined from 2005–2007 to 2012–2014.
- The largest declines in the infant mortality rates among Hispanic subgroups from 2005–2007 to 2012–2014 were observed among infants of Cuban (19%) and Puerto Rican (17%) women (Figure 2).
- From 2005–2007 to 2012–2014, the infant mortality rate declined 9% for infants of Mexican women (from 5.43 to 4.92 per 1,000) and 8% for Central and South American women (from 4.59 to 4.23).
- For both 2005–2007 and 2012–2014, infants of Puerto Rican women had the highest infant mortality rate among the Hispanic subgroups. The mortality rate for this subgroup was 47% higher than among infants of Mexican women (the subgroup with the second highest rates) for 2005–2007 and 36% higher for 2012–2014.
Figure 2. Infant mortality rates, by Hispanic-origin subgroup of mother: United States, 2005–2007 to 2012–2014
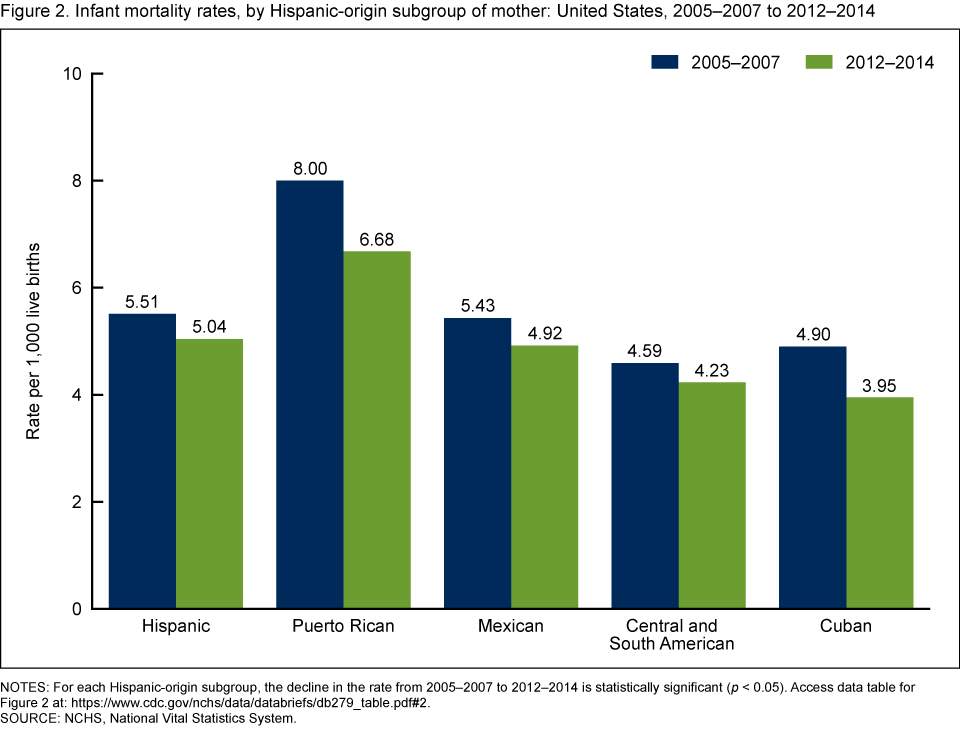
NOTES: For each Hispanic-origin subgroup, the decline in the rate from 2005–2007 to 2012–2014 is statistically significant (p < 0.05).
Access data table for Figure 2.
SOURCE: NCHS, National Vital Statistics System.
Infant mortality rates declined in most states from 2005–2007 to 2012–2014.
- From 2005–2007 to 2012–2014, infant mortality rates declined in a total of 33 states and the District of Columbia (D.C.). There was no significant change in the remaining 17 states (Figure 3).
- Eleven states and D.C. had declines in infant mortality rates of at least 16.0%. Declines of more than 20.0% were observed in Connecticut, South Carolina, Colorado, and D.C.
- Thirteen states had declines between 12.0% and 15.9%, and an additional nine states had declines of less than 12.0%.
Figure 3. Percent change in infant mortality rate, by state: United States, 2005–2007 to 2012–2014
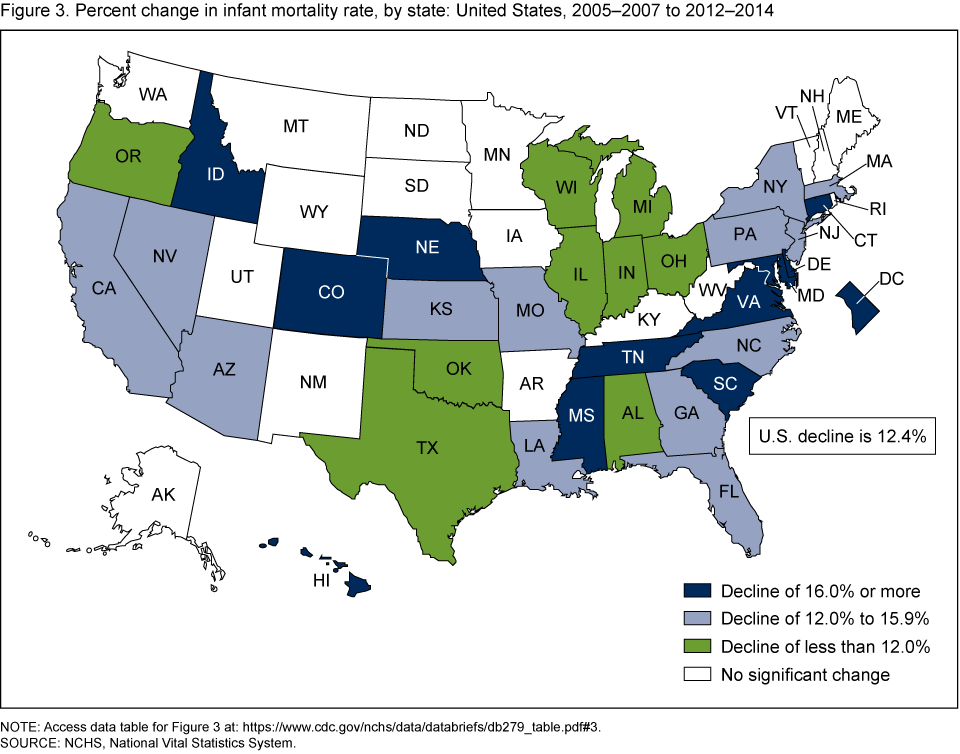
NOTE: Access data table for Figure 3.
SOURCE: NCHS, National Vital Statistics System.
From 2005 through 2014, infant mortality rates declined for four of the five leading causes of infant death.
- Congenital malformations was the leading cause of infant death in both 2005 and 2014. The infant mortality rate for congenital malformations declined 11% during this time (from 134.6 to 119.2 per 100,000) (Figure 4).
- The second leading cause of infant death (infant deaths due to short gestation and low birthweight) declined 8%, from 113.5 in 2005 to 104.6 in 2014.
- The infant mortality rate for sudden infant death syndrome had the largest decline of 29%, from 54.0 in 2005 to 38.6 in 2014.
- The rate for maternal complications declined 7%, from 42.7 in 2005 to 39.6 in 2014.
- The rate for unintentional injuries increased 11%, from 26.2 in 2005 to 29.2 in 2014.
- None of the infant mortality rates for any of the five leading causes of infant death changed significantly from 2013 to 2014.
Figure 4. Infant mortality rates for the five leading causes of infant death: United States, 2005, 2013, and 2014
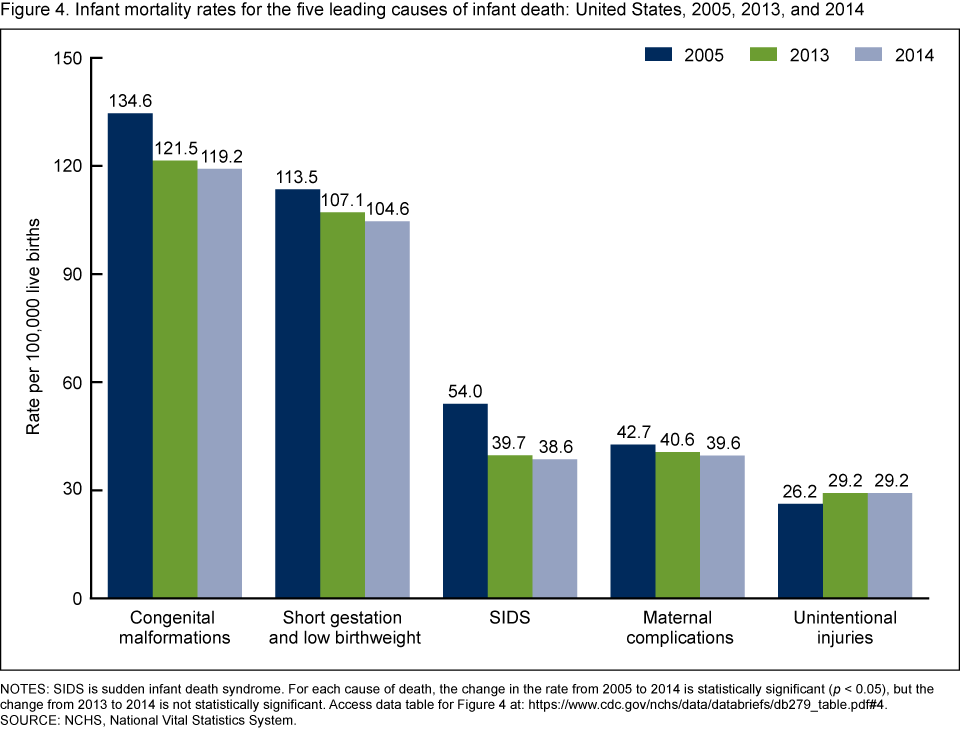
NOTES: SIDS is sudden infant death syndrome. For each cause of death, the change in the rate from 2005 to 2014 is statistically significant (p < 0.05), but the change from 2013 to 2014 is not statistically significant.
Access data table for Figure 4.
SOURCE: NCHS, National Vital Statistics System.
Summary
From 2005 through 2014, infant mortality declined for all major racial and ethnic groups except among infants of AIAN women. Across all of these years, differences persisted among population subgroups. For 2005–2014, the highest infant mortality rates were observed among infants of non-Hispanic black women, and the lowest rates were observed among infants of API women. Among infants of Hispanic women, infants of Puerto Rican women had the highest infant mortality rates. Declines in infant mortality rates were observed in two-thirds of all U.S. states and D.C. From 2005 through 2014, infant mortality rates declined for four of the five leading causes of death, but there were no significant changes in the rates by cause of death in the past year.
Definitions
Infant mortality rate: Number of infant (aged under 1 year) deaths per 1,000 live births.
Leading cause of infant death: Ranked according to the number of infant deaths assigned to rankable causes (6).
Data sources and methods
This report contains data from the period linked birth/infant death data set, which is part of NVSS (7). The period linked birth/infant death data set includes all infant deaths under 1 year of age reported on death certificates and all live births reported from birth certificates (7). The period linked birth/infant death data set is the primary data set for analyzing infant mortality trends and patterns in the United States, and it is the only source for examining race and Hispanic-origin infant mortality and for examining factors related to birth (4,7). For general trend comparisons, 2005, the most recent year in which the infant mortality rate peaked, is used as the starting point. For analysis on Hispanic subgroups and U.S. states, 3 years have been combined for two periods, 2005–2007 and 2012–2014, to allow for statistically robust comparisons over time. Causes of death are classified according to the 10th revision of the International Statistical Classification of Diseases and Related Health Problems (8). Linked birth/infant death data sets are available from: https://www.cdc.gov/nchs/data_access/vitalstatsonline.htm.
References to increases or decreases in rates indicate that differences are statistically significant at the 0.05 level (7).
About the authors
T.J. Mathews and Anne K. Driscoll are with the National Center for Health Statistics, Division of Vital Statistics.
References
- MacDorman MF, Mathews TJ, Mohangoo AD, Zeitlin J. International comparisons of infant mortality and related factors: United States and Europe, 2010. National vital statistics reports; vol 63 no 5. Hyattsville, MD: National Center for Health Statistics. 2014.
- Singh GK, Kogan MD. Persistent socioeconomic disparities in infant, neonatal, and postneonatal mortality rates in the United States, 1969–2001. Pediatr 119(4). 2007.
- Jacob JA. US infant mortality rate declines but still exceeds other developed countries. JAMA 315(5):451–2. 2016.
- Kochanek KD, Murphy SL, Xu JQ, Tejada-Vera B. Deaths: Final data for 2014. National vital statistics reports; vol 65 no 4. Hyattsville, MD: National Center for Health Statistics. 2016.
- Mississippi State Department of Health. Perinatal health: Improving birth outcomes in Mississippi. 2015.
- Heron M. Deaths: Leading causes for 2014. National vital statistics reports; vol 65 no 5. Hyattsville, MD: National Center for Health Statistics. 2016.
- Mathews TJ, MacDorman MF, Thoma ME. Infant mortality statistics from the 2013 period linked birth/infant death data set. National vital statistics reports; vol 64 no 9. Hyattsville, MD: National Center for Health Statistics. 2015.
- World Health Organization. International statistical classification of diseases and related health problems, tenth revision. 2008 ed. Geneva, Switzerland. 2009.
Suggested citation
Mathews TJ, Driscoll AK. Trends in infant mortality in the United States, 2005–2014. NCHS data brief, no 279. Hyattsville, MD: National Center for Health Statistics. 2017.
Copyright information
All material appearing in this report is in the public domain and may be reproduced or copied without permission; citation as to source, however, is appreciated.
National Center for Health Statistics
Charles J. Rothwell, M.S., M.B.A., Director
Jennifer H. Madans, Ph.D., Associate Director for Science
Division of Vital Statistics
Delton Atkinson, M.P.H., M.P.H., P.M.P., Director
Hanyu Ni, Ph.D., M.P.H., Associate Director for Science