Use of Medication Prescribed for Emotional or Behavioral Difficulties Among Children Aged 6–17 Years in the United States, 2011–2012
- Key findings
- Use of prescribed medication during the past 6 months for emotional or behavioral difficulties varied by sex, age, and race and Hispanic origin among children aged 6–17 years.
- Children insured by Medicaid or the Children's Health Insurance Program were more likely to use prescribed medication for emotional or behavioral difficulties than privately insured or uninsured children.
- Use of prescribed medication during the past 6 months for emotional or behavioral difficulties varied by poverty level.
- More than one-half of children who used prescribed medication for emotional or behavioral difficulties had a parent report that this medication helped the child
- Summary
- Definitions
- Data source and methods
- About the authors
- References
- Suggested citation
NCHS Data Brief No. 148, April 2014
PDF Version (467 KB)
LaJeana D. Howie, M.P.H., C.H.E.S.; Patricia N. Pastor, Ph.D.; and Susan L. Lukacs, D.O., M.S.P.H.
Key findings
Data from the National Health Interview Survey, 2011-2012
- Seven and one-half percent of children aged 6–17 years used prescribed medication during the past 6 months for emotional or behavioral difficulties.
- A higher percentage of children insured by Medicaid or the Children’s Health Insurance Program used prescribed medication for emotional or behavioral difficulties than children with private health insurance or no health insurance.
- A higher percentage of children in families having income below 100% of the poverty level used prescribed medication for emotional or behavioral difficulties than children in families at 100% to less than 200% of the poverty level.
- More than one-half of children who used prescribed medication for emotional or behavioral difficulties had a parent report that this medication helped the child “a lot.”
Mental health problems are common chronic conditions in children (1–3). Medication is often prescribed to treat the symptoms of these conditions (4–7). Few population-based studies have examined the use of prescription medication to treat mental health problems among younger as well as older school-aged children (8–10). This report describes the sociodemographic characteristics of children aged 6–17 years prescribed medication or taking medication during the past 6 months for emotional or behavioral difficulties, and describes parental reports of the perceived benefit of this medication.
Keywords: prescription medication, mental health treatment
Use of prescribed medication during the past 6 months for emotional or behavioral difficulties varied by sex, age, and race and Hispanic origin among children aged 6–17 years.
Figure 1. Percentage of children aged 6–17 years prescribed medication during the past 6 months for emotional or behavioral difficulties, by sex and age group, and race and Hispanic origin United States, 2011–2012

1Females aged 6–17 years significantly different from males aged 6–17 years. Females aged 6–11 years significantly different from males aged 6–11 years, and females aged 12–17 years significantly different from males aged 12–17 years.
2Females aged 6–11 years significantly different from females aged 12–17 years.
3Non-Hispanic white children significantly different from non-Hispanic black and Hispanic children.
4Non-Hispanic black children significantly different from Hispanic children.
NOTE: Parents were asked, “During the past 6 months, was the [sample child] prescribed medication or taking prescription medication for difficulties with emotions, concentration, behavior, or being able to get along with others?”
SOURCE: CDC/NCHS, National Health Interview Survey.
Among all children aged 6–17 years, 7.5% used prescribed medication during the past 6 months for emotional or behavioral difficulties. A higher percentage of males (9.7%) used prescribed medication for emotional or behavioral difficulties compared with females (5.2%), and males had a higher percentage than females in each age group. While older females had a higher percentage (6.3%) than younger females (4.0%), there was no difference by age group for males. The percentage of children who used prescribed medication for emotional or behavioral difficulties was highest for non-Hispanic white (9.2%) children, followed by non-Hispanic black (7.4%) children, and Hispanic (4.5%) children (Figure 1).
Children insured by Medicaid or the Children’s Health Insurance Program were more likely to use prescribed medication for emotional or behavioral difficulties than privately insured or uninsured children.
Among children aged 6–17 years, a higher percentage of children insured by Medicaid or the Children’s Health Insurance Program (CHIP) (9.9%) used prescribed medication for emotional or behavioral difficulties compared with children who were privately insured (6.7%) and uninsured (2.7%). Uninsured children had the lowest percentage of children using prescribed medication for emotional or behavioral difficulties compared with children with Medicaid or CHIP, private insurance, or TRICARE or other insurance (Figure 2).
Figure 2. Percentage of children aged 6–17 years prescribed medication during the past 6 months for emotional or behavioral difficulties, by health insurance status: United States, 2011–2012
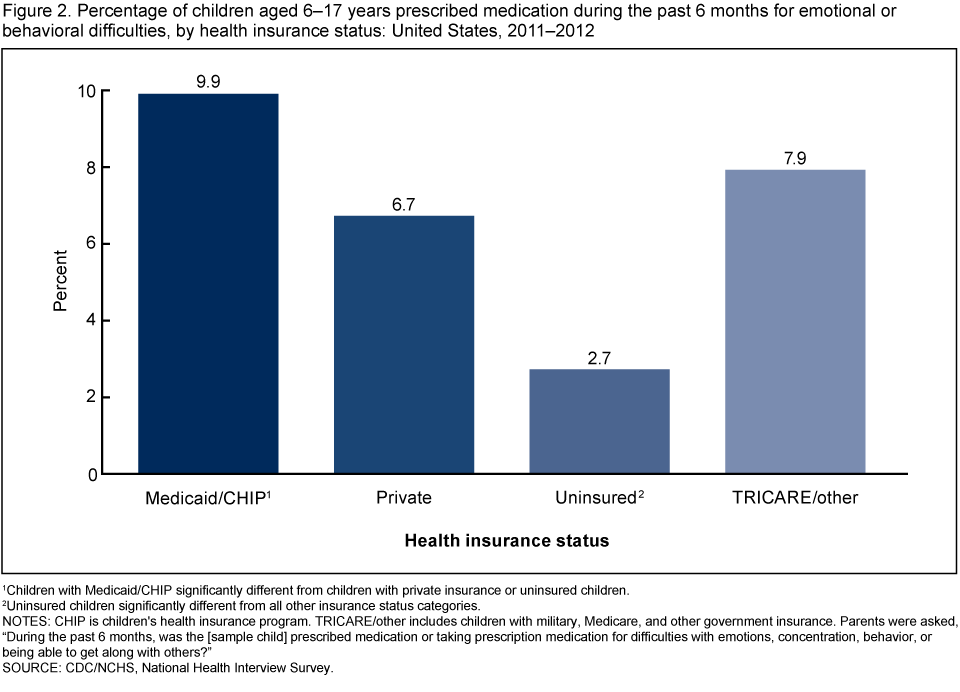
1Children with Medicaid/CHIP significantly different from children with private insurance or uninsured children.
2Uninsured children significantly different from all other insurance status categories.
NOTES: CHIP is children’s health insurance program. TRICARE/other includes children with military, Medicare, and other government insurance. Parents were asked, “During the past 6 months, was the [sample child] prescribed medication or taking prescription medication for difficulties with emotions, concentration, behavior, or being able to get along with others?”
SOURCE: CDC/NCHS, National Health Interview Survey.
Use of prescribed medication during the past 6 months for emotional or behavioral difficulties varied by poverty level.
Among children aged 6–17 years, a higher percentage of children in families having income below 100% of the poverty level (9.2%) used prescribed medication for emotional or behavioral difficulties compared with children in families having income at 100% to less than 200% of the poverty level (6.6%). The observed differences between children in families having income below 100% of the poverty level and children in families having income at or above 200% of the poverty level were not statistically significant (Figure 3).
Figure 3. Percentage of children aged 6–17 years prescribed medication during the past 6 months for emotional or behavioral difficulties, by poverty status: United States, 2011–2012
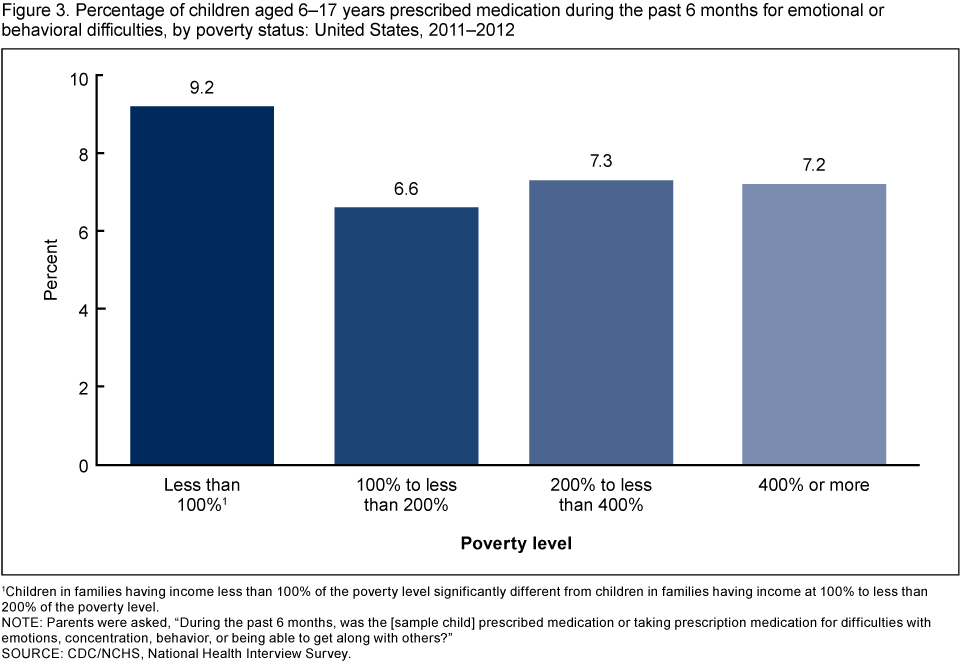
1Children in families having income less than 100% of the poverty level significantly different from children in families having income at 100% to less than 200% of the poverty level.
NOTES: Parents were asked, “During the past 6 months, was the [sample child] prescribed medication or taking prescription medication for difficulties with emotions, concentration, behavior, or being able to get along with others?”
SOURCE: CDC/NCHS, National Health Interview Survey.
More than one-half of children who used prescribed medication for emotional or behavioral difficulties had a parent report that this medication helped the child “a lot.”
Among children aged 6–17 years who used medication prescribed for emotional or behavioral difficulties, more than one-half (55.1%) had a parent report that the medication helped the child “a lot,” 26.0% were helped “some,” and 18.9% were not helped (“not at all” or helped “a little”). The percentage of children who were helped “a lot” by the medication did not vary between older and younger children, but it was lower for females (49.9%) compared with males (57.8%) and lower for children in families having income below 100% of the poverty level (43.0%) compared with children in families having income at 100% or more of the poverty level (59.2%) (Figure 4).
Figure 4. Percentage of children whose parents reported perceived benefit of medication for emotional or behavioral difficulties by age group, sex, and poverty status among children aged 6–17 years prescribed medication during the past 6 months: United States, 2011–2012
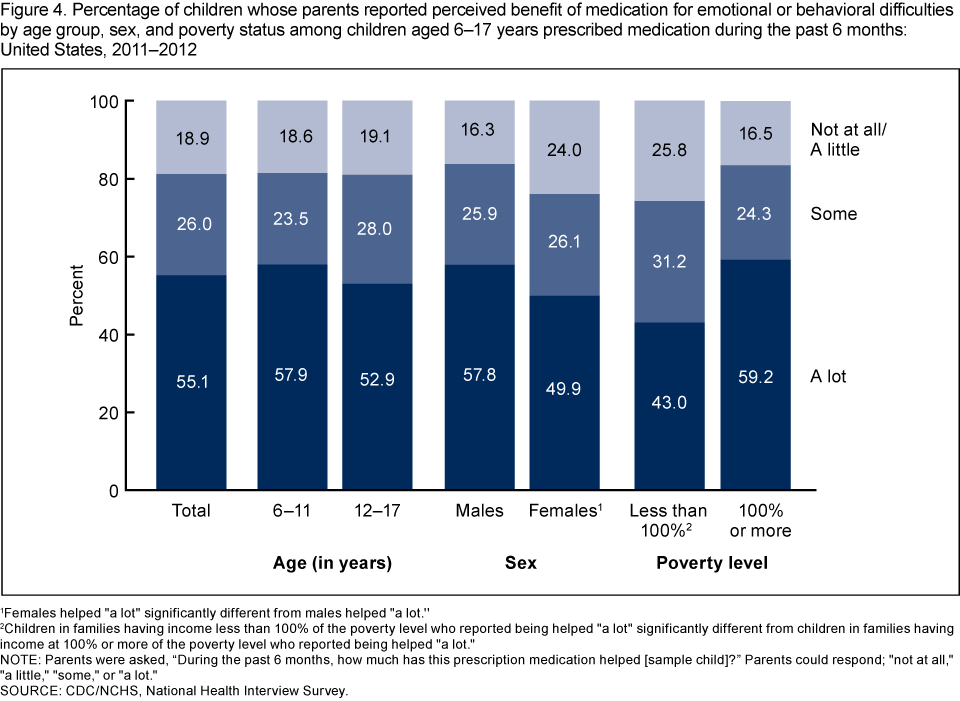
1Females helped “a lot” significantly different from males helped “a lot.”
2Children in families having income less than 100% of the poverty level who reported being helped “a lot” significantly different from children in families having income at 100% or more of the poverty level who reported being helped “a lot.”
NOTES: Parents were asked, “During the past 6 months, how much has this prescription medication helped [sample child]?” Parents could respond: “not at all,” “a little,” “some,” or “a lot.”
SOURCE: CDC/NCHS, National Health Interview Survey.
Summary
Among children aged 6–17 years, 7.5% used prescribed medication for emotional or behavioral difficulties in 2011–2012. Males and non-Hispanic white children were more likely to use prescribed medication than females and children of other racial and ethnic groups. Among females, the percentage of children who used prescribed medication for emotional or behavioral difficulties was higher for older females compared with younger females. Among males, there was no difference between younger and older males. The percentage of children who used prescribed medication for emotional or behavioral difficulties varied by health insurance status and poverty status. A higher percentage of children with Medicaid or CHIP coverage used prescribed medication compared with children who had private insurance or were uninsured. A lower percentage of uninsured children used prescribed medication for emotional or behavioral difficulties than either privately or publicly insured children. A higher percentage of children living in poverty used prescribed medication than children in families having income at 100% to less than 200% of the poverty level. There were also differences among children in the parent’s perception of the benefit of medication for emotional or behavioral difficulties. Overall, a little more than one-half (55.1%) of the children had a parent report that the medication had helped the child “a lot,” 26.0% were helped “some,” and 18.9% were not helped (“not at all” or helped “a little”). While there were no significant differences in the percentages of children who were helped “a lot” by medication by age group, there were differences by sex and poverty status. A higher percentage of males and children in families having income at 100% or more of the poverty level were reported by parents to have been helped “a lot” compared with females and children in families having income below 100% of the poverty level. Over the past 2 decades, the use of medication to treat mental health problems has increased substantially among all school-aged children and in most subgroups of children (5,7,11). Data collected by national health surveys play a key role in monitoring and understanding the factors associated with the expanded use of medication for the emotional and behavioral problems of children.
Definitions
Emotional or behavioral difficulties: Difficulties with emotions, concentration, behavior, or being able to get along with others.
Medication prescribed for emotional or behavioral difficulties: Estimate based on an affirmative response to the question, “During the past 6 months, was [sample child] prescribed medication or taking medication for difficulties with emotions, concentration, behavior, or being able to get along with others?”
Perceived benefit of medication: Parents were asked, “During the past 6 months, how much has this prescription medication helped [sample child]?” Parents could respond: “not at all,” “a little,” “some,” or “a lot.”
Poverty status or percentage of poverty level: Based on family income, family size, the number of children in the family, and, for families with two or fewer adults, on the age of the adults in the family. The poverty level is based on a set of income thresholds that vary by family size and composition. Families or individuals with income below their appropriate thresholds are classified as below the poverty level. These thresholds are updated annually by the U.S. Census Bureau to reflect changes in the Consumer Price Index for all urban consumers (12). Estimates by poverty status from NHIS are based on both reported and imputed family income (13).
Health insurance: Respondents were asked about the sample child’s health care coverage at the time of interview. Respondents reported whether the child was covered by private health insurance (obtained through the employer or workplace, purchased directly, or purchased through a local or community program), Medicare, Medicaid, CHIP, Indian Health Service (IHS), military insurance (including TRICARE), a state-sponsored health plan, another government program, or any single-service plan. This information was used to form four mutually exclusive categories: 1) children with private health insurance (which may include children who also have public coverage like Medicare); 2) children with Medicaid or CHIP; 3) children with TRICARE or other military, Medicare, or other government insurance; and 4) children who are uninsured. Children who only had IHS or a single-service plan were considered to be uninsured.
Data source and methods
NHIS data were used to estimate the percentage of children who were prescribed medication for emotional and behavioral difficulties during the past 6 months. NHIS data are collected continuously throughout the year for the Centers for Disease Control and Prevention’s (CDC) National Center for Health Statistics (NCHS) by interviewers from the U.S. Census Bureau. NHIS collects information about the health and health care of the civilian noninstitutionalized U.S. population. Interviews are conducted in respondents’ homes, but follow-ups to complete interviews may be conducted over the telephone. The Sample Child component collects detailed data on health conditions for a randomly selected child in households with at least one child. All of the data in the Sample Child component are obtained from a proxy respondent; no information is from medical records. A responsible adult, usually a parent, responds to the survey questions as proxy for the sample child. For further information about NHIS and the questionnaire, visit the NHIS website.
NHIS is designed to yield a sample that is representative of the civilian noninstitutionalized population of the United States, and the survey uses weighting to produce national estimates. Data weighting procedures are described in more detail elsewhere (14). Point estimates and estimates of corresponding variances for the estimates were calculated using SUDAAN software (15) to account for the complex sample design of NHIS. The Taylor series linearization method was chosen for variance estimation.
Differences between percentages were evaluated using two-sided significance tests at the 0.05 level. Terms such as “higher” and “lower” indicate statistically significant differences. Terms such as “no difference” indicate that the statistics being compared were not significantly different. All estimates shown in this report have a relative standard error less than or equal to 30%.
About the authors
LaJeana D. Howie, Patricia N. Pastor, and Susan L. Lukacs are with CDC/NCHS, Office of Analysis and Epidemiology.
References
- Merikangas KR, He JP, Brody D, Fisher PW, Bourdon K, Koretz DS. Prevalence and treatment of mental disorders among US children in 2001–2004 NHANES. Pediatrics 125(1):75–81. 2010.
- Pastor PN, Reuben CA, Duran CR. Identifying emotional and behavioral problems in children aged 4–17 years: United States, 2001–2007. National health statistics reports; no 48. Hyattsville, MD: National Center for Health Statistics. 2012.
- Federal Interagency Forum on Child and Family Statistics. America’s children: Key national indicators of well-being, 2013. Washington, DC: U.S. Government Printing Office. 2013.
- Froehlich TE, Lanphear BP, Epstein JN, Barbaresi WJ, Katusic SK, Kahn RS. Prevalence, recognition, and treatment of attention-deficit/hyperactivity disorder in a national sample of US children. Arch Pediatr Adolesc Med 161(9):857–64. 2007.
- Zuvekas SH, Vitiello B. Stimulant medication use in children: A 12-year perspective. Am J Psychiatry 169(2):160-6. 2012.
- American Academy of Pediatrics, Subcommittee on Attention-Deficit/Hyperactivity Disorder, Steering Committee on Quality Improvement and Management. ADHD: Clinical practice guideline for the diagnosis, evaluation, and treatment of attention-deficit/hyperactivity disorder in children and adolescents. Pediatrics 128(5):1007–22. 2011.
- Jonas BS, Gu Q, Albertorio-Diaz JR. Psychotropic medication use among adolescents: United States, 2005–2010. NCHS data brief, no 135. Hyattsville, MD: National Center for Health Statistics. 2013.
- Zito JM, Safer DJ, DosReis S, Gardner JF, Magder L, Soeken K, et al. Psychotropic practice patterns for youth: A 10-year perspective. Arch Pediatr Adolesc Med 157(1):17–25. 2003.
- Zito JM, Safer DJ, dosReis S, Gardner JF, Boles M, Lynch F. Trends in the prescribing of psychotropic medications to preschoolers. JAMA 283(8):1025–30. 2000.
- Olfson M, He JP, Merikangas KR. Psychotropic medication treatment of adolescents: Results from the National Comorbidity Survey-Adolescent Supplement. J Am Acad Child Adolesc Psychiatry 52(4):378–88. 2013.
- U.S. Department of Health and Human Services. Mental health: A report of the Surgeon General. Rockville, MD: U.S. Department of Health and Human Services, Substance Abuse and Mental Health Services Administration, Center for Mental Health Services, National Institutes of Health, National Institute of Mental Health. 1999.
- U.S. Census Bureau. Poverty 2012. Washington, DC.
- Schenker N, Raghunathan TE, Chiu P-L, et al. Multiple imputation of family income and personal earnings in the National Health Interview Survey: Methods and examples. Hyattsville, MD: National Center for Health Statistics. 2008.
- Botman SL, Moore TF, Moriarity CL, Parsons VL. Design and estimation for the National Health Interview Survey, 1995–2004. National Center for Health Statistics. Vital Health Stat 2(130). 2000.
- RTI International. SUDAAN (Release 9.1) [computer software]. 2004.
Suggested citation
Howie LD, Pastor PN, Lukacs SL. Use of medication prescribed for emotional or behavioral difficulties among children aged 6–17 years in the United States, 2011–2012. NCHS data brief, no 148. Hyattsville, MD: National Center for Health Statistics. 2014.
Copyright information
All material appearing in this report is in the public domain and may be reproduced or copied without permission; citation as to source, however, is appreciated.
National Center for Health Statistics
Charles J. Rothwell, M.S., M.B.A., Director
Jennifer H. Madans, Ph.D., Associate Director for Science
Division of Health Care Statistics
Jane F. Gentleman, Ph.D., Director