Pregnancy Rates for U.S. Women Continue to Drop
Please note: Minor modifications have been made to the numbers and rates in this report due to corrections of calculation errors in abortion numbers by age from the Guttmacher Institute. The total number of abortions and the overall findings in this report have not changed.
- Key findings
- Pregnancy rates were highest for women in their 20s.
- The U.S. pregnancy rate fell to a 12-year low in 2009, and the abortion rate was the lowest recorded during the 1976–2009 period.
- Pregnancy, birth, and abortion rates for teenagers reached historic lows in 2009.
- Teen pregnancy rates continued to fall and reached record lows in 2009 for the three major race and Hispanic origin groups.
- Pregnancy rates fell equally for married and unmarried women since 1990; large differences in pregnancy outcomes persist.
- Summary
- Definitions
- Data sources and methods
- About the authors
- References
- Suggested citation
NCHS Data Brief No. 136, December 2013
PDF Version (436 KB)
Sally C. Curtin, M.A., Joyce C. Abma, Ph.D., and Stephanie J. Ventura, M.A., National Center for Health Statistics; and Stanley K. Henshaw, Ph.D., Guttmacher Institute
Key findings
- The pregnancy rate for U.S. women in 2009 was 102.1 per 1,000 women aged 15–44, the lowest level in 12 years; only the 1997 rate of 101.6 has been lower in the last 30 years.
- Rates for women under age 30 fell during 1990–2009, while rates for women aged 30 and over increased.
- Rates for teenagers reached historic lows in 2009, including rates for the three major race and Hispanic origin groups.
- Pregnancy rates have declined about 10% each for married and unmarried women since 1990.
- The birth rate for married women was 72% higher than the rate for unmarried women; the abortion rate for unmarried women was almost five times higher than the rate for married women.
Pregnancy rates for women in the United States continued to decline in 2009, reaching the lowest level in 12 years (102.1 per 1,000 women aged 15–44). This level is 12% below the 1990 peak (115.8) (1,2). The estimated number of pregnancies dropped to 6,369,000 (4,131,000 live births, 1,152,000 induced abortions, and 1,087,000 fetal losses). The drop in birth rates since 2007 has been well documented. However, it is important to examine the other outcomes of pregnancy to understand the full scope of current reproductive trends. The data in this report provide a comprehensive picture of pregnancies and pregnancy outcomes. Data on pregnancy outcomes by age, race and Hispanic origin, and marital status are presented using data from the National Vital Statistics System, the Abortion Surveillance System and Guttmacher Institute, and the National Survey of Family Growth (NSFG).
Keywords: National Vital Statistics System, birth rates, abortion rates, pregnancy outcomes
Pregnancy rates were highest for women in their 20s.
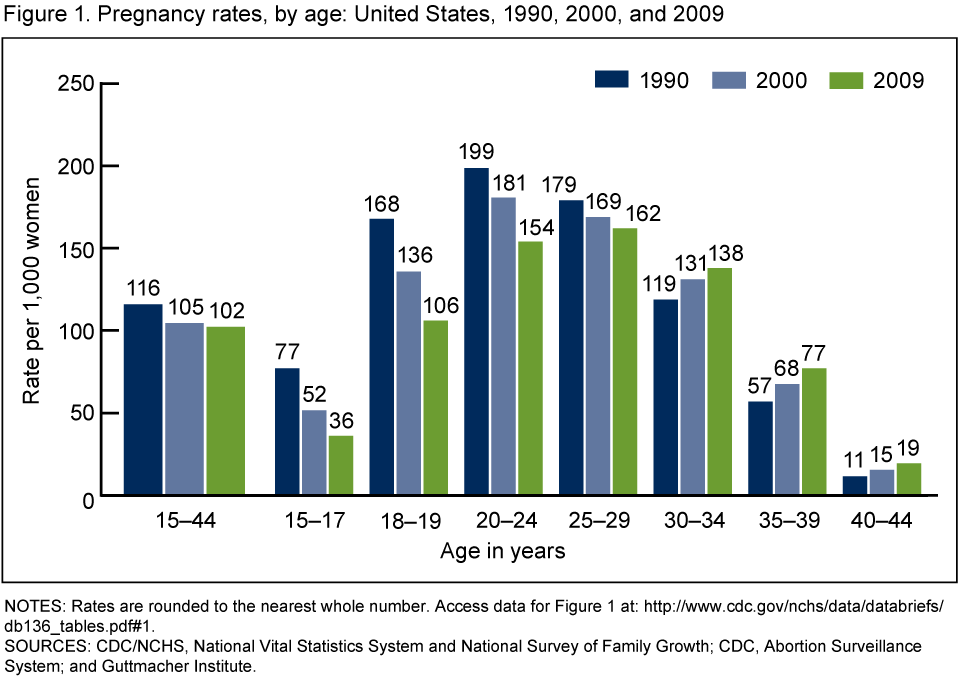
- The overall number and rate of pregnancy were highest for women aged 25–29 in 2009, followed by women aged 20–24 (Figure 1 and Table). This is a change from 1990 and 2000, when rates for women aged 20–24 were the highest of all groups (2).
- Pregnancy rates in 2009 for older teenagers aged 18–19 (106 per 1,000) were nearly three times the rates for younger teenagers aged 15–17 (36 per 1,000).
- Pregnancy rates for women under age 30 declined consistently across all three time points, whereas rates for women aged 30 and over increased consistently.
- The largest declines in the pregnancy rates from 1990 to 2009 among women aged 15–44 were for teenagers aged 15–17 (down 53%) and 18–19 (down 37%).
Figure 1. Pregnancy rates, by age: United States, 1990, 2000, and 2009
NOTES: Rates are rounded to the nearest whole number. Access data for Figure 1 [PDF – 320 KB].
SOURCES: CDC/NCHS, National Vital Statistics System and National Survey of Family Growth; CDC, Abortion Surveillance System; and Guttmacher Institute.
| Age in years | |||||||||||
|---|---|---|---|---|---|---|---|---|---|---|---|
| Pregnancy outcome and race and Hispanic origin | 15–19 | ||||||||||
| Total | Under 15 | Total | 15–17 | 18–19 | 20–24 | 25–29 | 30–34 | 35–39 | 40 and over | ||
| All pregnancies1 | 6,369 | 12 | 705 | 231 | 474 | 1,608 | 1,696 | 1,353 | 793 | 203 | |
| Live births | 4,131 | 5 | 410 | 124 | 286 | 1,006 | 1,167 | 955 | 474 | 114 | |
| Induced abortions | 1,152 | 5 | 176 | 60 | 116 | 376 | 284 | 173 | 101 | 37 | |
| Fetal losses2 | 1,087 | 2 | 120 | 47 | 73 | 226 | 245 | 224 | 217 | 52 | |
| Non-Hispanic white | |||||||||||
| All pregnancies | 3,207 | 3 | 267 | 75 | 192 | 738 | 900 | 746 | 440 | 113 | |
| Live births | 2,232 | 1 | 161 | 40 | 121 | 495 | 663 | 570 | 276 | 66 | |
| Induced abortions | 383 | 1 | 60 | 20 | 41 | 130 | 86 | 52 | 38 | 16 | |
| Fetal losses2 | 591 | 0 | 46 | 15 | 31 | 113 | 150 | 125 | 126 | 30 | |
| Non-Hispanic black | |||||||||||
| All pregnancies | 1,253 | 5 | 199 | 69 | 130 | 390 | 308 | 209 | 112 | 30 | |
| Live births | 615 | 2 | 99 | 32 | 67 | 196 | 155 | 100 | 51 | 13 | |
| Induced abortions | 445 | 3 | 70 | 25 | 45 | 146 | 115 | 68 | 34 | 9 | |
| Fetal losses2 | 192 | 1 | 29 | 12 | 17 | 48 | 39 | 40 | 28 | 7 | |
| Hispanic3 | |||||||||||
| All pregnancies | 1,474 | 4 | 214 | 79 | 136 | 408 | 374 | 277 | 156 | 39 | |
| Live births | 1,000 | 2 | 136 | 48 | 88 | 275 | 271 | 196 | 97 | 23 | |
| Induced abortions | 252 | 1 | 37 | 13 | 25 | 82 | 64 | 39 | 21 | 7 | |
| Fetal losses2 | 222 | 1 | 41 | 18 | 23 | 52 | 39 | 42 | 38 | 9 | |
1Includes races other than white and black and origin not stated.
2Spontaneous fetal losses from recognized pregnancies of all gestational periods, as estimated from reports from women in the 1995, 2002, and 2006–2010 National Surveys of Family Growth. The rate of fetal loss depends on the degree to which losses at very early gestations are detected. See references 1 and 2 for more information.
3Includes all persons of Hispanic origin of any race.
NOTES: Due to rounding, numbers may not add to totals. Due to sample size limitations in any given year, fetal loss numbers for teenagers are based on the 1988, 1995, 2002, and 2006–2010 National Surveys of Family Growth. For information on sources and methods of estimation, see references 1 and 2.
The U.S. pregnancy rate fell to a 12-year low in 2009, and the abortion rate was the lowest recorded during the 1976–2009 period.
- The pregnancy rate for U.S. women peaked in 1990 at 115.8 per 1,000 women aged 15–44. The rate for 2009 (102.1) is 12% lower than in 1990 (Figure 2).
- Since 1976, birth rates also peaked in 1990 (70.9 per 1,000), dropping about 7% by 2009. This rate has continued to fall through 2012, to 63.0 (3).
- The abortion rate was the lowest recorded during the 1976–2009 period and has dropped almost continuously since 1980. The abortion rate in 2009 (18.5) was 32% lower than in 1990 (27.4).
Figure 2. Pregnancy, birth, and abortion rates for women aged 15–44: United States, 1976–2009, and birth rate, 2010–2012

1Data not available for 2010–2012.
NOTE: Access data for Figure 2 [PDF – 320 KB], and see reference 1 for more information.
SOURCES: CDC/NCHS, National Vital Statistics System and National Survey of Family Growth; CDC, Abortion Surveillance System; and Guttmacher Institute.
Pregnancy, birth, and abortion rates for teenagers reached historic lows in 2009.
- The pregnancy rate for U.S. teenagers fell steadily from 1990–2009, except for a brief increase in 2006–2007 (Figure 3).
- The teen birth rate in 2009 (37.9 per 1,000) was 39% lower than the 1991 peak (61.8) and has continued to fall through 2012, reaching a record low (29.4).
- The 2009 abortion rate for teenagers (16.3 per 1,000) was less than one-half the rate in 1991 (37.4) and 1990 (40.3).
Figure 3. Pregnancy, birth, and abortion rates for teenagers aged 15–19: United States, 1976–2009, and birth rate, 2010–2012

1Data not available for 2010–2012.
NOTE: Access data for Figure 3 [PDF – 320 KB], and see reference 1 for more information.
SOURCES: CDC/NCHS, National Vital Statistics System and National Survey of Family Growth; CDC, Abortion Surveillance System; and Guttmacher Institute.
Teen pregnancy rates continued to fall and reached record lows in 2009 for the three major race and Hispanic origin groups.
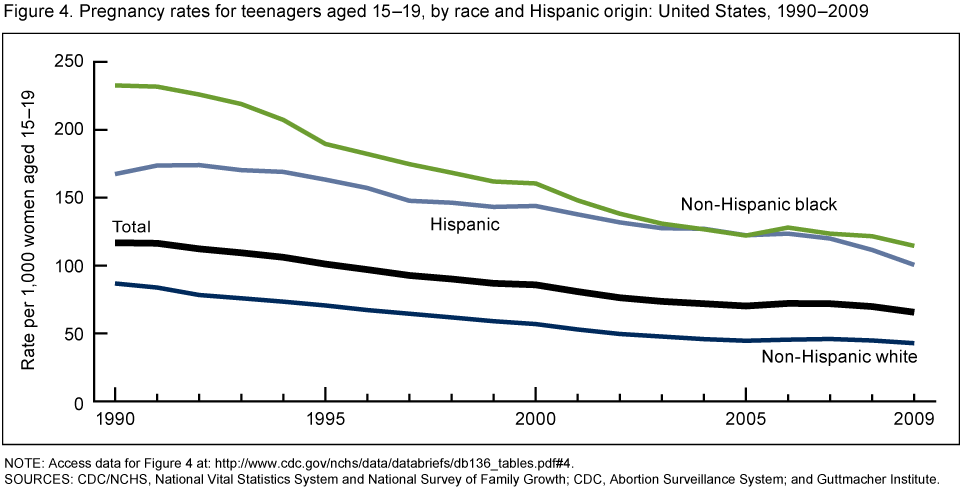
- From 1990 to 2009, rates fell 51% for non-Hispanic white and non-Hispanic black teenagers and 40% for Hispanic teenagers (Figure 4).
- Non-Hispanic black and Hispanic teen pregnancy rates were at least twice those of non-Hispanic white teenagers during the entire period.
- The non-Hispanic black teen pregnancy rate was 39% higher than the Hispanic teen rate in 1990 (232.7 compared with 167.4). The difference disappeared by the mid-2000s, and then reappeared in 2006.
Figure 4. Pregnancy rates for teenagers aged 15–19, by race and Hispanic origin: United States, 1990–2009
NOTE: Access data for Figure 4 [PDF – 320 KB].
SOURCES: CDC/NCHS, National Vital Statistics System and National Survey of Family Growth; CDC, Abortion Surveillance System; and Guttmacher Institute.
Pregnancy rates fell equally for married and unmarried women since 1990; large differences in pregnancy outcomes persist.
- Among women aged 15–44, the pregnancy rate for married women in 2009 was 24% higher than the rate for unmarried women (Figure 5). Rates for both of these groups have declined 10% since 1990.
- Most of the decline in the pregnancy rate for married women (7%) was between 1990 and 2000. The 2009 pregnancy rate was 3% lower than the rate in 2000.
- The pregnancy rate for unmarried women decreased 12% between 1990 and 2000 but then increased 2% from 2000 to 2009.
- Pregnancy rates by outcome of pregnancy differ between married and unmarried women throughout the period 1990–2009. The birth rate for married women was 72% higher in 2009 than the rate for unmarried women (85.6 compared with 49.9), while the abortion rate for unmarried women was almost five times greater than the rate for married women (28.9 compared with 6.1).
Figure 5. Pregnancy rates, by outcome and marital status: United States, 1990, 2000, and 2009

NOTE: Access data for Figure 5 [PDF – 320 KB].
SOURCES: CDC/NCHS, National Vital Statistics System and National Survey of Family Growth; CDC, Abortion Surveillance System; and Guttmacher Institute.
Summary
After a brief increase in 2006 and 2007, the ongoing declines in the number and rate of pregnancies continued in 2009, with the overall rate reaching the lowest level in 12 years. Between 1990 and 2009, rates declined for women under age 30 and increased for women aged 30 and over. The most sustained changes in pregnancy rates have been the steep declines in teen pregnancy rates, with rates falling for all pregnancy outcomes and for all age and Hispanic origin and race groups. Pregnancy rates have declined for married and unmarried women, but large differences by marital status remain in pregnancy rates by outcome of pregnancy.
The recent trends and variations in pregnancy, birth, and abortion rates among U.S. women have been associated with a variety of demographic, social, and economic factors, and related program and policy efforts. It has been suggested that the declining economy, beginning in 2007, has likely played a role in the decreased rates for women under age 40 (4). For teenagers, evidence shows that trends in the behavioral determinants of pregnancy are consistent with the declines in their pregnancy rates. For example, the latest NSFG data show a continuation of a long-term downward trend in the percentage of teenagers who are sexually experienced, and a long-term upward trend in the use of contraception at first sex (5). The degree to which pregnancies are unintended or unplanned also contributes to understanding the rates, not only for teenagers, but for women of all ages (6). Nearly all abortions are a result of unintended pregnancy (7). Thus, differences in outcomes across groups such as married and unmarried women are closely related to differences in unintended pregnancies among these groups (6,7).
The most recent birth data for 2012 show continued declines in birth and fertility rates for women under age 30 and for most race and Hispanic origin groups (3). However, these data suggest that the declines have slowed. More current data on abortions will help determine whether pregnancy rates have leveled off as well.
Definitions
Pregnancy rate: The number of pregnancies (including births, induced abortions, and fetal losses) per 1,000 women in a specified age or race and Hispanic origin group.
Birth rate: The number of births per 1,000 women in a specified age or race and Hispanic origin group.
Abortion rate: The number of induced abortions per 1,000 women in a specified age or race and Hispanic origin group.
Fetal loss rate: The number of fetal losses per 1,000 women in a specified age or race and Hispanic origin group.
Data sources and methods
Statistics for live births are based on complete counts of births provided by every state to the Centers for Disease Control and Prevention’s (CDC) National Center for Health Statistics, through the Vital Statistics Cooperative Program of the National Vital Statistics System (8). This report includes birth data through 2012, although most of the data discussed are for 2009.
Estimates of induced abortions are from abortion surveillance information collected from most states by CDC’s National Center for Chronic Disease Prevention and Health Promotion; these estimates are adjusted to national totals by the Guttmacher Institute (9–11). The demographic information on the women who obtain abortions in CDC’s abortion surveillance reporting area is then applied to the Guttmacher Institute’s national totals, to arrive at national estimates of abortions by these characteristics. Additional information is available elsewhere (1,2).
Estimates of fetal losses are derived from the pregnancy history data collected by NSFG (12). The NSFG data used for these estimates are from the surveys conducted in 1995, 2002, and 2006–2010, and for teenagers, data from the 1988 survey are included as well. These four cycles were combined to provide statistical reliability because of small numbers of pregnancies in some age-race-Hispanic origin groups in the NSFG samples. Procedures for fetal loss estimates for years prior to 1990 are described elsewhere (1,2). The fetal loss figures are estimates, and variations reflect, in part, the extent to which pregnancies are recognized, especially at very early gestation periods. Despite this limitation of the NSFG data, they still have advantages over vital statistics data, as fetal losses are underreported in vital statistics, and national data for fetal losses prior to 20 weeks of gestation are not available (13). For more information, see Technical Notes in reference 2.
The population denominators used for all rates in this report are consistent with the 2000 and 2010 censuses (14).
About the authors
Sally Curtin, Joyce Abma, and Stephanie Ventura are with the National Center for Health Statistics, and Stanley Henshaw is with the Guttmacher Institute.
References
- Ventura SJ, Mosher WD, Curtin SC, et al. Trends in pregnancies and pregnancy rates by outcome: Estimates for the United States, 1976–96 [PDF – 348 KB]. National Center for Health Statistics. Vital Health Stat 21(56). 2000.
- Ventura SJ, Curtin SC, Abma JC, Henshaw SK. Estimated pregnancy rates and rates of pregnancy outcomes for the United States, 1990–2008 [PDF – 463 KB]. National vital statistics reports; vol 60 no 7. Hyattsville, MD: National Center for Health Statistics. 2012.
- Hamilton BE, Martin JA, Ventura SJ. Births: Preliminary data for 2012 [PDF – 362 KB]. National vital statistics reports; vol 62 no 3. Hyattsville, MD: National Center for Health Statistics. 2013.
- Livingston G. In a down economy, fewer births. Pew Research Center Social & Demographic Trends. Washington, DC: Pew Research Center. 2011.
- Martinez G, Copen CE, Abma JC. Teenagers in the United States: Sexual activity, contraceptive use, and childbearing, 2006–2010 National Survey of Family Growth [PDF – 723 KB]. National Center for Health Statistics. Vital Health Stat 23(31). 2011.
- Mosher WD, Jones J, Abma JC. Intended and unintended births in the United States: 1982–2010 [PDF – 404 KB]. National health statistics reports; no 55. Hyattsville, MD: National Center for Health Statistics. 2012.
- Finer LB, Henshaw SK. Abortion incidence and services in the United States in 2000. Perspect Sex Reprod Health 35(1):6–15. 2003.
- Martin JA, Hamilton BE, Ventura SJ, et al. Births: Final data for 2011 [PDF – 1.63 MB]. National vital statistics reports; vol 62 no 1. Hyattsville, MD: National Center for Health Statistics. 2013.
- Pazol K, Creanga AA, Zane SB, Burley KD, Jamieson DJ. Abortion surveillance—United States, 2009. MMWR Surveill Summ 61(8). 2012.
- Jones RK, Kooistra K. Abortion incidence and access to services in the United States, 2008. Perspect Sexual Reprod Health 43(1):41–50. 2011.
- Henshaw SK. Unpublished tabulations. Guttmacher Institute. 2000 and 2011–2013.
- Lepkowski JM, Mosher WD, Davis KE, Van Hoewyk J. The 2006–2010 National Survey of Family Growth: Sample design and analysis of a continuous survey. National Center for Health Statistics. Vital Health Stat 2(150) [PDF – 597 KB]. 2010.
- MacDorman MF, Kirmeyer SE, Wilson EC. Fetal and perinatal mortality, United States, 2006 [PDF – 433 KB]. National vital statistics reports; vol 60 no 8. Hyattsville, MD: National Center for Health Statistics. 2012.
- National Center for Health Statistics. U.S. census populations with bridged race categories. Downloadable data files and documentation [Accessed June 17, 2013].
Suggested citation
Curtin SC, Abma JC, Ventura SJ, Henshaw SK. Pregnancy rates for U.S. women continue to drop. NCHS data brief, no 136. Hyattsville, MD: National Center for Health Statistics. 2013.
Copyright information
All material appearing in this report is in the public domain and may be reproduced or copied without permission; citation as to source, however, is appreciated.
National Center for Health Statistics
Charles J. Rothwell, M.S., Acting Director
Jennifer H. Madans, Ph.D., Associate Director for Science
Division of Vital Statistics
Delton Atkinson, M.P.H., M.P.H., P.M.P., Acting Director