Prevalence of Underweight Among Adults Aged 20 Years and Over: United States, 2007–2008
Cheryl D. Fryar, M.S.P.H., and Cynthia L. Ogden, Ph.D., Division of Health and Nutrition Examination Surveys
PDF Version (82 KB)
Poor nutrition or underlying health conditions in adults can result in underweight. Results from the 2007-2008 National Health and Nutrition Examination Survey (NHANES), using measured heights and weights, indicate that an estimated 1.6% of U.S. adults aged 20 years and over are underweight (Table 1). Body mass index (BMI)–expressed as weight in kilograms divided by height in meters squared (kg/m2)–is commonly used to classify underweight (defined as BMI less than 18.5) among adults aged 20 and over.
A statistically significant decrease in the prevalence of underweight between 1988-1994 and 2007-2008 was found only among persons aged 60 and over. The prevalence in this age group was 2.3% in 1988-1994 and 1.1% in 2007-2008. Surveys prior to 1988 did not include individuals older than 74, consequently Table 2 contains age-adjusted prevalence estimates for adults aged 20-74 for all survey periods back to 1960. The prevalence of persons aged 20-74 who were underweight has decreased significantly over the past decades, from an estimated 4% in the early 1960s to 1.6% in 2007-2008. The decrease in underweight prevalence was significant for all age groups.
Between 2003-2006 and 2007-2008, there were no significant changes in the prevalence of underweight.
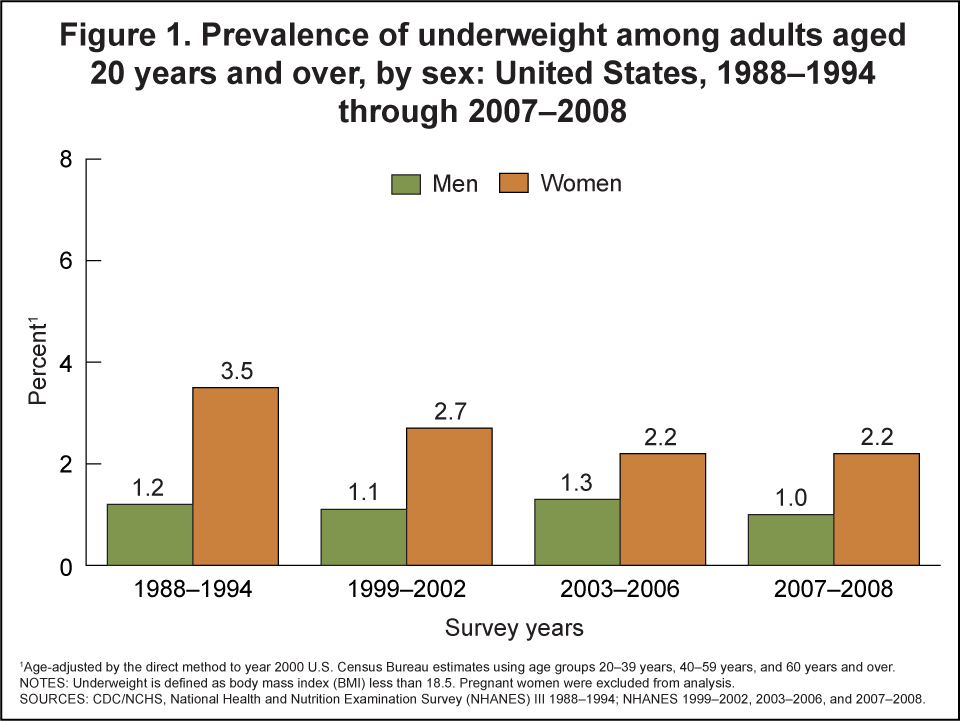
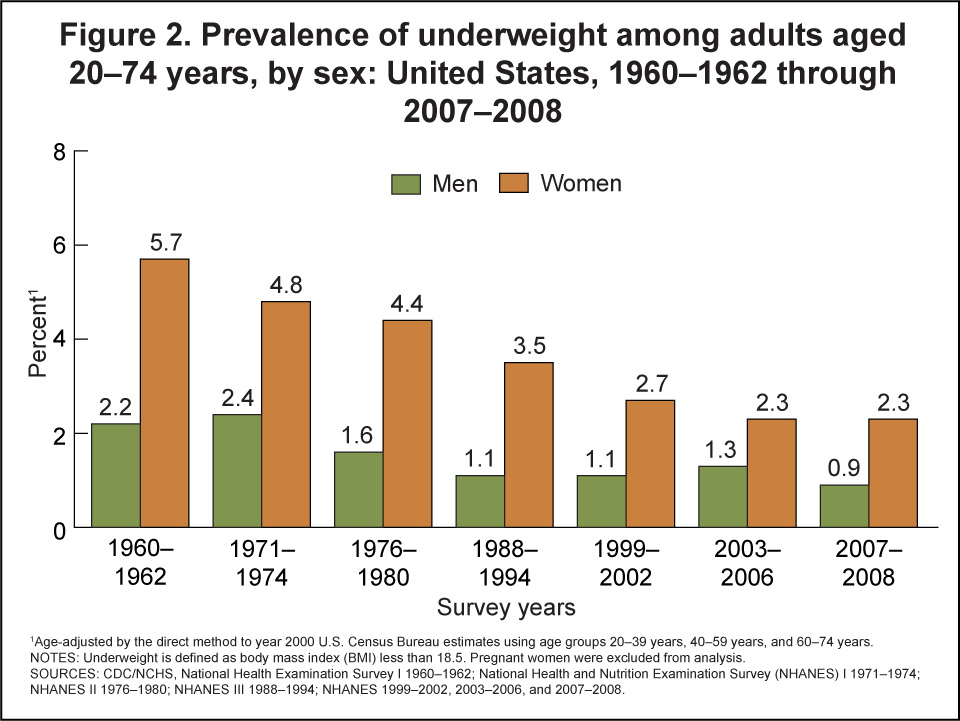
Significant gender differences were seen in underweight prevalence among U.S. adults. Women were more likely to be underweight than men at all survey time periods (Figure 1: ages 20 years and over; Figure 2: ages 20-74 years).
Between 1960-1962 and 2007-2008, there were significant decreasing trends in the prevalence of underweight among both men and women aged 20-74. The prevalence of underweight decreased from 5.7% to 2.3% in women and from 2.2% to 0.9% in men (Figure 2 and Table 2 ).
NHANES uses a stratified multistage probability sample of the U.S. civilian noninstitutionalized population. A household interview and a physical examination are conducted for each survey participant. During the physical examination, performed in a mobile examination center, height and weight are measured as part of a more comprehensive set of body measurements. These measurements are taken by trained health technicians, using standardized measuring procedures and equipment. Observations for pregnant women and for persons missing a valid height or weight measurement were not included in the data analysis.
Figures
Tables
Table 1. Prevalence of underweight among adults aged 20 years and over, by age and sex: United States, selected years 1988-1994 through 2007-2008
| Characteristic | NHANES III 1988-1994 |
NHANES 1999-2002 |
NHANES 2003-2006 | NHANES 2007-2008 |
|---|---|---|---|---|
| Sample (n) | 16,235 | 8,530 | 8,787 | 5,550 |
| Total1 | 2.4 | 1.9 | 1.8 | 1.6 |
| Age | ||||
| 20-39 years | 3.0 | 2.8 | 2.6 | 1.9 |
| 40-59 years | 1.7 | 1.1 | 1.2 | *1.5 |
| 60 years and over | 2.3 | 1.6 | 1.2 | 1.1 |
| Sex1 | ||||
| Male | 1.2 | 1.1 | 1.3 | 1.0 |
| Female | 3.5 | 2.7 | 2.2 | 2.2 |
*Estimates preceded by an asterisk have a relative standard error greater than 30% and less than or equal to 40% and should be used with caution because they do not meet standards of reliability or precision.
1Age-adjusted by the direct method to the year 2000 U.S. Census Bureau estimates using the age groups 20-39 years, 40-59 years, and 60 years and over.
NOTES: Underweight is defined as body mass index (BMI) less than 18.5. Pregnant women were excluded from analysis.
SOURCES: CDC/NCHS, National Health and Nutrition Examination Survey (NHANES) III 1988-1994; NHANES 1999-2002, 2003-2006, and 2007-2008.
Table 2. Prevalence of underweight among adults aged 20-74 years, by age and sex: United States, selected years 1960-1962 through 2007-2008
| Characteristic | NHES I 1960-1962 |
NHANES I 1971-1974 |
NHANES II 1976-1980 |
NHANES III 1988-1994 |
NHANES 1999-2002 |
NHANES 2003-2006 |
NHANES 2007-2008 |
|---|---|---|---|---|---|---|---|
| Sample (n) | 6,126 | 12,911 | 11,765 | 14,319 | 7,519 | 7,591 | 4,876 |
| Total1 | 4.0 | 3.6 | 3.0 | 2.3 | 1.9 | 1.8 | 1.6 |
| Age | |||||||
| 20-39 years | 5.7 | 4.9 | 4.2 | 3.0 | 2.8 | 2.6 | 1.9 |
| 40-59 years | 2.3 | 2.2 | 1.9 | 1.7 | 1.1 | 1.2 | *1.5 |
| 60-74 years | 3.7 | 3.8 | 2.7 | 1.9 | 1.3 | 0.9 | 0.9 |
| Sex1 | |||||||
| Male | 2.2 | 2.4 | 1.6 | 1.1 | 1.1 | 1.3 | 0.9 |
| Female | 5.7 | 4.8 | 4.4 | 3.5 | 2.7 | 2.3 | 2.3 |
*Estimates preceded by an asterisk have a relative standard error greater than 30% and less than or equal to 40% and should be used with caution because they do not meet the standards of reliability or precision.
1Age-adjusted by the direct method to the year 2000 U.S. Census Bureau estimates using the age groups 20-39 years, 40-59 years, and 60-74 years.
NOTES: Underweight is defined as body mass index (BMI) less than 18.5. Pregnant women were excluded from analysis. NHES I and NHANES I and II did not include individuals over age 74 years, thus trend estimates are based on ages 20-74.
SOURCES: National Health Examination Survey (NHES) I 1960-1962; National Health and Nutrition Examination Survey (NHANES) I 1971-1974; NHANES II 1976-1980; NHANES III 1988-1994; NHANES 1999-2002, 2003-2006, and 2007-2008.