Suicide Rates for Females and Males by Race and Ethnicity: United States, 1999 and 2014
by Sally C. Curtin, M.A., and Margaret Warner, Ph.D., Division of Vital Statistics; and Holly Hedegaard, M.D., M.S.P.H., Office of Analysis and Epidemiology
The age-adjusted suicide rate in the United States was 24% higher in 2014 than in 1999, and increases were observed for both females and males in all age groups under 75 (1). This NCHS Health E-Stat provides supplemental data on the frequency and rate of suicide among females and males by Hispanic origin and race for 1999 and 2014.
For females, age-adjusted suicide rates increased between 1999 and 2014 for all racial and ethnic groups except non-Hispanic Asian or Pacific Islanders (API), with the largest percentage increases for non-Hispanic American Indian or Alaska Native (AIAN) females (89%) and non-Hispanic white females (60%) (Figure 1, Table). Suicide rates for non-Hispanic white females increased for all age groups under age 75. The suicide rate for non-Hispanic white females aged 45–64 in 2014 (12.6 per 100,000) was 80% higher compared with 1999 (7.0) and was three to four times higher than for females in other racial and ethnic groups. Suicide rates for non-Hispanic black and Hispanic females also increased for those aged 45–64. Although much lower than for other ages, the suicide rate in 2014 for non-Hispanic white females aged 10–14 years (1.7 per 100,000) more than tripled from 1999 (0.5).
For males, age-adjusted suicide rates increased between 1999 and 2014 by 38% for non-Hispanic AIAN males and by 28% for non-Hispanic white males (Figure 2, Table). In 2014, the suicide rate for non-Hispanic AIAN males aged 25–44 was the highest among all racial and ethnic groups (48.0 per 100,000) and was 60% higher than in 1999 (30.0). Non-Hispanic white males had higher suicide rates in 2014 than in 1999 for all age groups under 75 years, with the greatest percentage increase for those aged 45–64 (59%) and 10–14 (57%). In contrast, non-Hispanic black males were the only racial and ethnic group of either sex to have a lower suicide rate in 2014 (9.7 per 100,000 standard population) compared with 1999 (10.5), an 8% decline.
Deaths for all causes for non-Hispanic AIAN, non-Hispanic API, and Hispanic persons have been shown to be misclassified to other racial and ethnic groups, resulting in underreporting of these deaths by about 28%, 7%, and 5%, respectively (2,3). Despite this underestimation, these groups are included in this report so that all major Hispanic-origin and race groups are presented. Although the extent and direction of misclassification of suicide deaths is unknown, numbers and rates for these racial and ethnic groups are most likely underreported. Even so, non-Hispanic AIAN persons had among the highest age-adjusted suicide rates in 2014 (along with non-Hispanic white persons) and the highest suicide rates for females and males aged 15–24 and 25–44. A study linking self-reported Hispanic origin and race on censuses and surveys to entries on death certificates is in progress and will provide more current estimates of racial and ethnic misclassification on death certificates. In addition, NCHS, with funding from the Office of Minority Health, U.S. Department of Health and Human Services, is developing Web-based training aimed at improving the reporting of race and Hispanic origin on death certificates.
Data source and methods
Data are from the 1999 and 2014 National Vital Statistics Systems’ Multiple Cause of Death files, which are compiled from data provided through the Vital Statistics Cooperative Program (4). Deaths were classified using the International Statistical Classification of Diseases and Related Health Problems, Tenth Revision (ICD–10) (5). Suicide deaths were identified with ICD–10 underlying cause of death codes U03, X60–X84, and Y87.0.
Differences in rates were tested by z test for statistical significance, and all differences discussed were significant at the 0.05 level. Age-adjusted death rates were calculated using the direct method and the 2000 standard population (3). Demographic information comes from death certificates. Population data for 1999 and 2014 are July 1 bridged-race estimates from the Vintage 2014 postcensal series.
References
- Curtin SC, Warner M, Hedegaard H. Increase in suicide in the United States, 1999–2014. NCHS data brief, no 241. Hyattsville, MD: National Center for Health Statistics. 2016.
- Arias E, Schauman WS, Eschbach K, et al. The validity of race and Hispanic origin reporting on death certificates in the United States [PDF – 368 KB]. National Center for Health Statistics. Vital Health Stat 2(148). 2008.
- Kochanek KD, Murphy SL, Xu JQ. Deaths: Final data for 2011. National vital statistics reports; vol 63 no 3. Hyattsville, MD: National Center for Health Statistics. 2015.
- National Center for Health Statistics. About underlying cause of death, 1999–2014. 2016. Available from: CDC WONDER online database.
- WHO. International statistical classification of diseases and related health problems, tenth revision (ICD–10). 2008 ed. Geneva, Switzerland. 2009.
Suggested citation: Curtin SC, Warner M, Hedegaard H. Suicide rates for females and males by race and ethnicity: United States, 1999 and 2014. NCHS Health E-Stat. National Center for Health Statistics. April 2016.
Figures
Figure 1. Age-adjusted suicide rates for females, by race and Hispanic origin: United States, 1999 and 2014
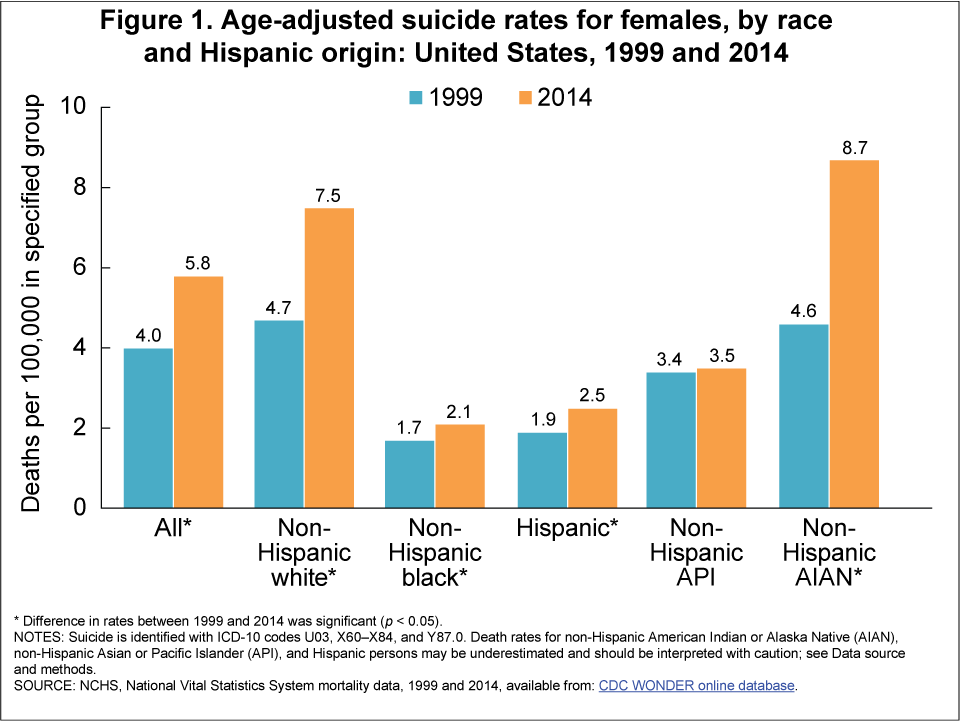
* Difference in rates between 1999 and 2014 was significant (p < 0.05).
NOTES: Suicide is identified with ICD-10 codes U03, X60–X84, and Y87.0. Death rates for non-Hispanic American Indian or Alaska Native (AIAN), non-Hispanic Asian or Pacific Islander (API), and Hispanic persons may be underestimated and should be interpreted with caution; see Data source and methods.
SOURCE: CDC/NCHS, National Vital Statistics System mortality data, 1999 and 2014, available from: CDC WONDER online database.
Figure 2. Age-adjusted suicide rates for males, by race and Hispanic origin: United States, 1999 and 2014
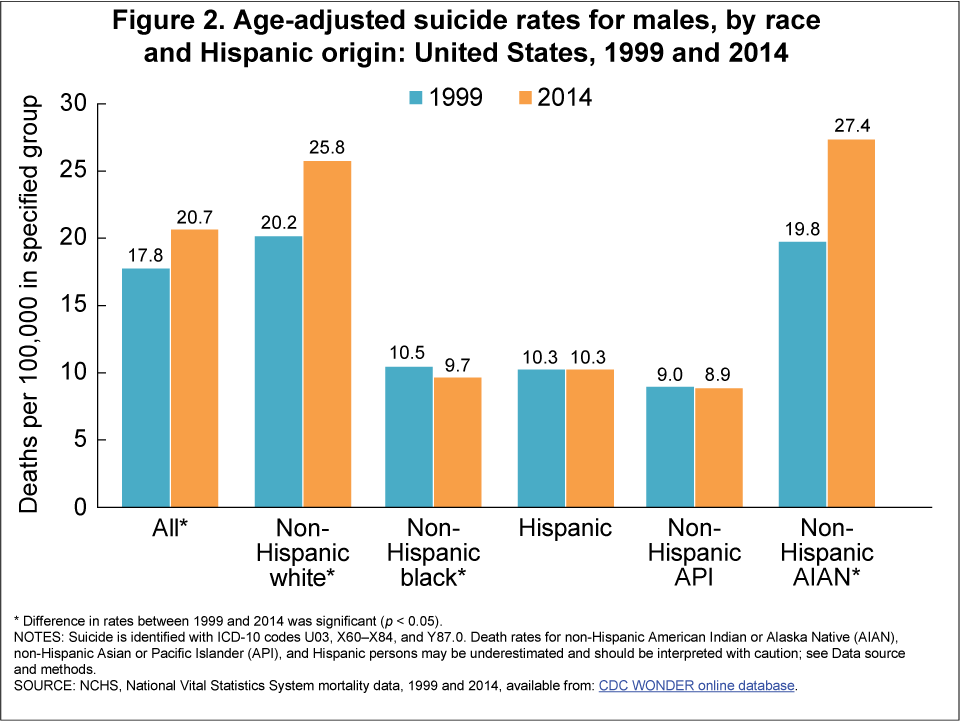
* Difference in rates between 1999 and 2014 was significant (p < 0.05).
NOTES: Suicide is identified with ICD-10 codes U03, X60–X84, and Y87.0. Death rates for non-Hispanic American Indian or Alaska Native (AIAN), non-Hispanic Asian or Pacific Islander (API), and Hispanic persons may be underestimated and should be interpreted with caution; see Data source and methods.
SOURCE: CDC/NCHS, National Vital Statistics System mortality data, 1999 and 2014, available from: CDC WONDER online database.
Table
Table. Number of deaths, death rates by age, and age-adjusted death rates for suicide, by Hispanic origin and race and sex: United States, 1999 and 2014
[Rates per 100,000 population estimated as of July 1]
| Hispanic origin and race and age (years) | Female | Male | ||||||||
|---|---|---|---|---|---|---|---|---|---|---|
| 1999 | 2014 | Percent change in rate, 1999–2014 | 1999 | 2014 | Percent change in rate, 1999–2014 | |||||
| Number | Rate | Number | Rate | Number | Rate | Number | Rate | |||
| All races1 | ||||||||||
| All ages2 | 5,741 | 4.0 | 9,660 | 5.8 | †45 | 23,458 | 17.8 | 33,113 | 20.7 | †16 |
| 10–14 | 50 | 0.5 | 150 | 1.5 | †200 | 192 | 1.9 | 275 | 2.6 | †37 |
| 15–24 | 575 | 3.0 | 990 | 4.6 | †53 | 3,326 | 16.8 | 4,089 | 18.2 | †8 |
| 25–44 | 2,359 | 5.5 | 3,018 | 7.2 | †31 | 9,213 | 21.6 | 10,257 | 24.3 | †13 |
| 45–64 | 1,868 | 6.0 | 4,195 | 9.8 | †63 | 6,109 | 20.8 | 12,099 | 29.7 | †43 |
| 65–74 | 420 | 4.1 | 828 | 5.9 | †44 | 2,051 | 24.7 | 3,282 | 26.6 | †8 |
| 75 and over | 469 | 4.5 | 477 | 4.0 | †-11 | 2,549 | 42.4 | 3,106 | 38.8 | †-8 |
| Not stated | – | * | 1 | * | * | 16 | * | 3 | * | * |
| Non-Hispanic white3 | ||||||||||
| All ages2 | 4,914 | 4.7 | 8,030 | 7.5 | †60 | 19,620 | 20.2 | 27,368 | 25.8 | †28 |
| 10–14 | 33 | 0.5 | 94 | 1.7 | †240 | 140 | 2.1 | 190 | 3.3 | †57 |
| 15–24 | 414 | 3.4 | 653 | 5.4 | †59 | 2,416 | 19.2 | 2,842 | 22.4 | †17 |
| 25–44 | 1,981 | 6.8 | 2,401 | 9.8 | †44 | 7,415 | 25.2 | 7,867 | 31.7 | †26 |
| 45–64 | 1,678 | 7.0 | 3,715 | 12.6 | †80 | 5,389 | >23.4 | 10,617 | 37.1 | †59 |
| 65–74 | 380 | 4.6 | 745 | 6.9 | †50 | 1,869 | 27.0 | 2,983 | 30.7 | †14 |
| 75 and over | 428 | 4.8 | 421 | 4.5 | -6 | 2,384 | 45.7 | 2,865 | 44.0 | -4 |
| Not stated | – | * | 1 | * | * | 6 | * | 3 | * | * |
| Non-Hispanic black3 | ||||||||||
| All ages2 | 294 | 1.7 | 455 | 2.1 | †24 | 1,630 | 10.5 | 1,871 | 9.7 | †-8 |
| 10–14 | 7 | * | 14 | * | * | 22 | 1.4 | 39 | 2.5 | †79 |
| 15–24 | 55 | 2.0 | 91 | 2.7 | 35 | 408 | 14.8 | 426 | 12.3 | †-17 |
| 25–44 | 142 | 2.5 | 174 | 3.0 | 20 | 785 | 15.5 | 806 | 15.0 | -3 |
| 45–64 | 64 | 1.9 | 143 | 2.7 | †42 | 278 | 9.8 | 454 | 9.8 | 0 |
| 65–74 | 16 | * | 22 | 1.6 | * | 78 | 11.7 | 82 | 7.7 | †-34 |
| 75 and over | 10 | * | 10 | * | * | 57 | 14.1 | 63 | 11.0 | -22 |
| Not stated | – | * | – | * | * | 2 | * | – | * | * |
| Non-Hispanic Asian or Pacific Islander3,4 | ||||||||||
| All ages2 | 188 | 3.4 | 350 | 3.5 | 3 | 457 | 9.0 | 804 | 8.9 | -1 |
| 10–14 | 1 | * | 4 | * | * | 6 | * | 6 | * | * |
| 15–24 | 35 | 4.1 | 53 | 4.3 | 5 | 82 | 9.5 | 163 | 12.8 | †35 |
| 25–44 | 76 | 3.8 | 130 | 4.1 | 8 | 203 | 10.8 | 285 | 9.9 | -8 |
| 45–64 | 46 | 3.9 | 104 | 4.3 | 10 | 118 | 11.5 | 251 | 12.2 | 6 |
| 65–74 | 14 | * | 30 | 4.6 | * | 22 | 10.1 | 58 | 10.9 | 8 |
| 75 and over | 16 | * | 29 | 6.3 | * | 25 | 19.4 | 41 | 12.7 | -35 |
| Not stated | – | * | – | * | * | 1 | * | – | * | * |
| Non-Hispanic American Indian or Alaska Native3,5 | ||||||||||
| All ages2 | 54 | 4.6 | 118 | 8.7 | †89 | 222 | 19.8 | 348 | 27.4 | †38 |
| 10–14 | – | * | 7 | * | * | 2 | * | 4 | * | * |
| 15–24 | 13 | * | 34 | 15.6 | * | 77 | 39.1 | 86 | 38.2 | -2 |
| 25–44 | 29 | 8.2 | 56 | 15.7 | †91 | 102 | 30.0 | 168 | 48.0 | †60 |
| 45–64 | 12 | * | 19 | * | * | 30 | 14.9 | 70 | 22.7 | †52 |
| 65–74 | – | * | – | * | * | 9 | * | 11 | * | * |
| 75 and over | – | * | – | * | * | 2 | * | 9 | * | * |
| Not stated | – | * | – | * | * | – | * | – | * | * |
| Hispanic6 | ||||||||||
| All ages2 | 265 | 1.9 | 662 | 2.5 | †32 | 1,430 | 10.3 | 2,582 | 10.3 | 0 |
| 10–14 | 9 | * | 31 | 1.3 | * | 21 | 1.4 | 35 | 1.4 | 0 |
| 15–24 | 53 | 1.8 | 157 | 3.4 | †89 | 338 | 9.9 | 562 | 11.5 | †16 |
| 25–44 | 121 | 2.3 | 247 | 3.0 | †30 | 671 | 11.3 | 1,101 | 12.6 | †12 |
| 45–64 | 59 | 2.5 | 185 | 3.5 | †40 | 263 | 11.8 | 640 | 12.4 | 5 |
| 65–74 | 10 | * | 28 | 2.4 | * | 63 | 13.8 | 127 | 13.2 | -4 |
| 75 and over | 13 | * | 14 | * | * | 72 | 30.2 | 117 | 20.6 | †-32 |
| Not stated | – | * | – | * | * | 2 | * | – | * | * |
† Difference in rates between 1999 and 2014 was significant at p < 0.05.
– Quantity zero. Missing values for age were not distributed prior to calculating rates.
* Figure does not meet standards of reliability or precision; based on fewer than 20 cases in the numerator.
1Includes Hispanic origin not stated.
2Age-adjusted using the direct method and the standard 2000 population.
3Race categories are consistent with the 1977 Office of Management and Budget (OMB) standards. In 2014, multiple-race data were reported by 46 states and the District of Columbia; see Technical Notes. The multiple-race data for these reporting areas were bridged to the single-race categories of the 1977 OMB standards for comparability with other reporting areas.
4Includes Aleuts and Eskimos.
5Includes Chinese, Filipino, Hawaiian, Japanese, and other Asian or Pacific Islander persons.
6Persons of Hispanic origin may be of any race.
NOTE: Suicide deaths are identified with underlying cause-of-death codes U03, X60–X84, and Y87.0 from the International Statistical Classification of Diseases and Related Health Problems, Tenth Revision.
SOURCE: National Vital Statistics System, Mortality, 1999 and 2014.