Trends in Spina Bifida and Anencephalus in the United States, 1991-2006
by T.J. Mathews, M.S., Division of Vital Statistics
PDF Version (78 KB)
In 1992, the U.S. Public Health Service recommended that women of childbearing age increase consumption of the vitamin folic acid to reduce spina bifida and anencephalus. In 1996, the U.S. Food and Drug Administration authorized that all enriched cereal grain products be fortified with folic acid. Optional fortification started in March 1996 and mandatory fortification in January 1998. Results from the National Health and Nutrition Examination Survey (NHANES) for 1999–2000 show that public health actions have been effective in increasing folate status among women of childbearing age. However, results from 2005–2006 NHANES show that folate status among women of childbearing age has only fluctuated slightly since 1999–2000 (Blood folate levels: The latest NHANES results).
Birth certificate data in the United States have been available for selected birth defects since 1989 from the National Vital Statistics System, a component of the Centers for Disease Control and Prevention (CDC), National Center for Health Statistics (NCHS). This Health E-Stat provides a 16-year trend for two neural tube defects, spina bifida and anencephalus.
After a significant increase in the spina bifida rate from 1992 to 1995, a significant decline occurred from 1995 to 1999. The rate continued an overall decrease from 2000 (20.85) to 2006 (17.99). The 2006 rate was nearly the same as that for 2005, the lowest ever reported (17.96).
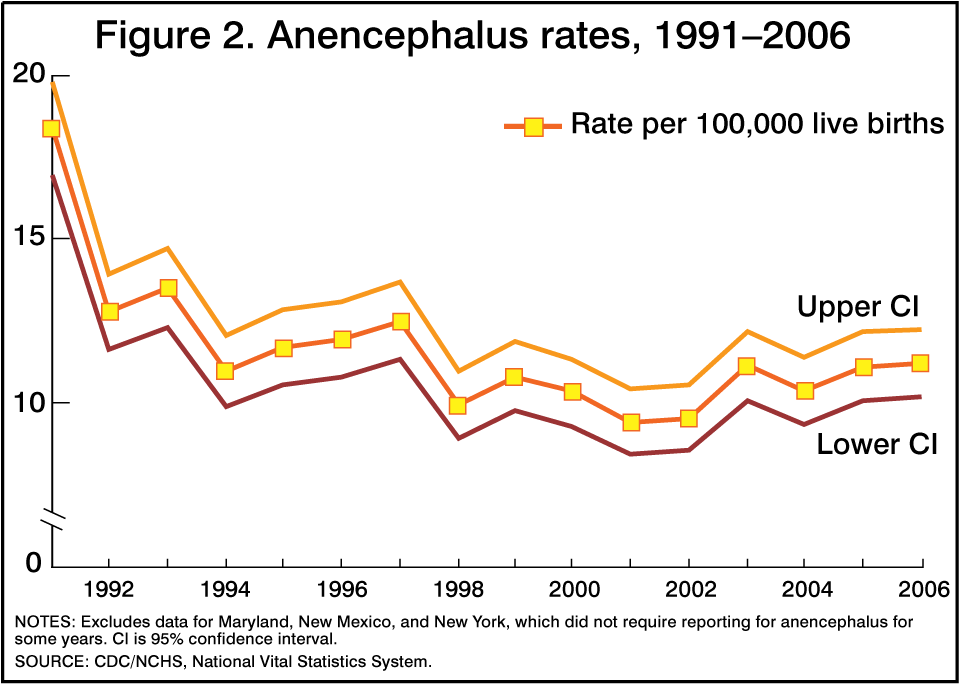
After a decline in the early part of the decade, the anencephalus rate was stable during the mid-1990s (1994–1997). The rate was also stable, but generally lower than in earlier years, during 1998–2002 (9.97 for the period). The rate for 2003–2006 (10.96) was higher than for the 1998–2002 period.
Birth certificate data for 1991–2006 are final. For further information about the birth data file, see Births: Final Data for 2006 [PDF – 2.2 MB]. The numbers and rates for all years exclude data for Maryland, New Mexico, and New York, which in various years had either incomplete reporting or did not report these neural tube defects. Both spina bifida and anencephalus are considered underreported on the birth certificate. CDC is continuing to monitor and analyze neural tube defect occurrence data.
References
- McDowell MA, Lacher DA, Pfeiffer CM, Mulinare J, Picciano MF, Rader JI, et al. Blood folate levels: The latest NHANES results. NCHS data brief, no 6. Hyattsville, MD: National Center for Health Statistics. 2008.
- Martin JA, Hamilton BE, Sutton PD, Ventura SJ, Menacker F, et al. Births: Final data for 2006. National vital statistics reports; vol 57 no 7. Hyattsville, MD: National Center for Health Statistics. 2009.
- Schenker N, Gentleman JF. On judging the significance of differences by examining the overlap between confidence intervals. The American Statistician 55:182–6. 2001.
Figures

Tables
| Spina bifida cases | Total live births | Rate | 95% confidence intervals for rate | ||
|---|---|---|---|---|---|
| 2006 | 700 | 3,890,949 | 17.99 | 16.66 | 19.32 |
| 2005 | 698 | 3,887,109 | 17.96 | 16.62 | 19.29 |
| 2004 | 755 | 3,860,720 | 19.56 | 18.16 | 20.95 |
| 2003 | 702 | 3,715,577 | 18.89 | 17.50 | 20.29 |
| 2002 | 734 | 3,645,770 | 20.13 | 18.68 | 21.59 |
| 2001 | 730 | 3,640,555 | 20.05 | 18.60 | 21.51 |
| 2000 | 759 | 3,640,376 | 20.85 | 19.37 | 22.33 |
| 1999 | 732 | 3,533,565 | 20.72 | 19.22 | 22.22 |
| 1998 | 790 | 3,519,240 | 22.45 | 20.88 | 24.01 |
| 1997 | 857 | 3,469,667 | 24.70 | 23.05 | 26.35 |
| 1996 | 917 | 3,478,723 | 26.36 | 24.65 | 28.07 |
| 1995 | 975 | 3,484,539 | 27.98 | 26.22 | 29.74 |
| 1994 | 900 | 3,527,482 | 25.51 | 23.85 | 27.18 |
| 1993 | 896 | 3,562,723 | 25.15 | 23.50 | 26.80 |
| 1992 | 816 | 3,572,890 | 22.84 | 21.27 | 24.41 |
| 1991 | 887 | 3,564,453 | 24.88 | 23.25 | 26.52 |
NOTE: Excludes data for Maryland, New Mexico, and New York, which did not require reporting for spina bifida for some years.
SOURCE: CDC/NCHS, National Vital Statistics System.
| Anencephalus cases | Total live births | Rate | 95% confidence intervals for rate | ||
|---|---|---|---|---|---|
| 2006 | 436 | 3,890,949 | 11.21 | 10.15 | 12.26 |
| 2005 | 432 | 3,887,109 | 11.11 | 10.07 | 12.16 |
| 2004 | 401 | 3,860,720 | 10.39 | 9.37 | 11.40 |
| 2003 | 441 | 3,715,577 | 11.14 | 10.07 | 12.22 |
| 2002 | 348 | 3,645,770 | 9.55 | 8.54 | 10.55 |
| 2001 | 343 | 3,640,555 | 9.42 | 8.42 | 10.42 |
| 2000 | 376 | 3,640,376 | 10.33 | 9.28 | 11.37 |
| 1999 | 382 | 3,533,565 | 10.81 | 9.73 | 11.89 |
| 1998 | 349 | 3,519,240 | 9.92 | 8.88 | 10.96 |
| 1997 | 434 | 3,469,667 | 12.51 | 11.33 | 13.69 |
| 1996 | 416 | 3,478,723 | 11.96 | 10.81 | 13.11 |
| 1995 | 408 | 3,484,539 | 11.71 | 10.57 | 12.84 |
| 1994 | 387 | 3,527,482 | 10.97 | 9.88 | 12.06 |
| 1993 | 481 | 3,562,723 | 13.50 | 12.29 | 14.71 |
| 1992 | 457 | 3,572,890 | 12.79 | 11.62 | 13.96 |
| 1991 | 655 | 3,564,453 | 18.38 | 16.97 | 19.78 |
NOTE: Excludes data for Maryland, New Mexico, and New York, which did not require reporting for anencephalus for some years.
SOURCE: CDC/NCHS, National Vital Statistics System.