Prevalence of Overweight, Obesity, and Extreme Obesity Among Adults: United States, Trends 1960–1962 Through 2007–2008
by Cynthia L. Ogden, Ph.D., and Margaret D. Carroll, M.S.P.H., Division of Health and Nutrition Examination Surveys
PDF Version (203 KB)
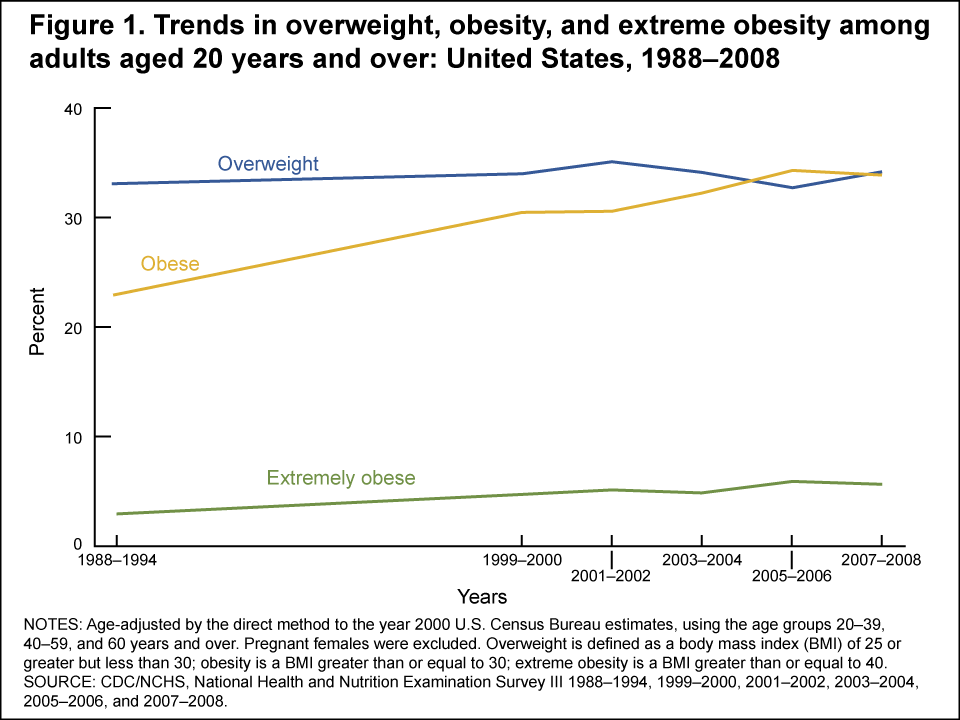
Results from the 2007–2008 National Health and Nutrition Examination Survey (NHANES), using measured heights and weights, indicate that an estimated 34.2% of U.S. adults aged 20 years and over are overweight, 33.8% are obese, and 5.7% are extremely obese, as shown in Table 1. Body mass index (BMI), expressed as weight in kilograms divided by height in meters squared (kg/m2), is commonly used to classify overweight (BMI 25.0–29.9), obesity (BMI greater than or equal to 30.0), and extreme obesity (BMI greater than or equal to 40.0).
One of the national health objectives for 2010 is to reduce the prevalence of obesity among adults to less than 15%. The NHANES 2007–2008 data for adults aged 20 and over suggest an increase in obesity between the late 1980s and today in the United States, with the estimated age-adjusted prevalence moving upward from a previous level of 23% in NHANES III (1988–1994) to approximately 34% in 2007–2008. Among women, however, there was no significant change between 1999–2000 and 2007–2008. Among men, there was a significant linear increase between 1999–2000 and 2007–2008, but no change between 2003–2004 and 2007–2008. Trends in obesity and overweight prevalence since 1988–1994 are shown in Table 1 and Figure 1.
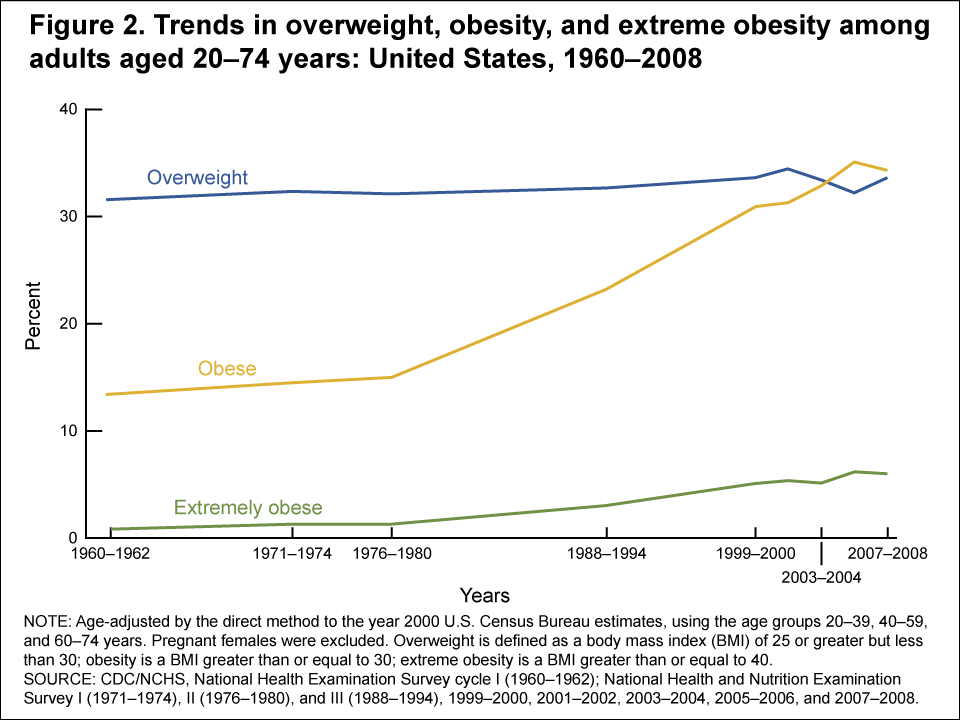
It is possible to examine trends since 1960 among adults aged 20–74. These estimates are shown in Table 2 and Figure 2. Although the prevalence of obesity among adults aged 20–74 more than doubled between 1976–1980 and 2007–2008, the prevalence of overweight remained stable during the same period (Table 2 ).
Racial and ethnic disparities in adult obesity
There are significant racial and ethnic disparities in obesity prevalence among U.S. adults. Table 3 shows the estimates in obesity prevalence by race/ethnicity for men and women since NHANES III (1988–1994).
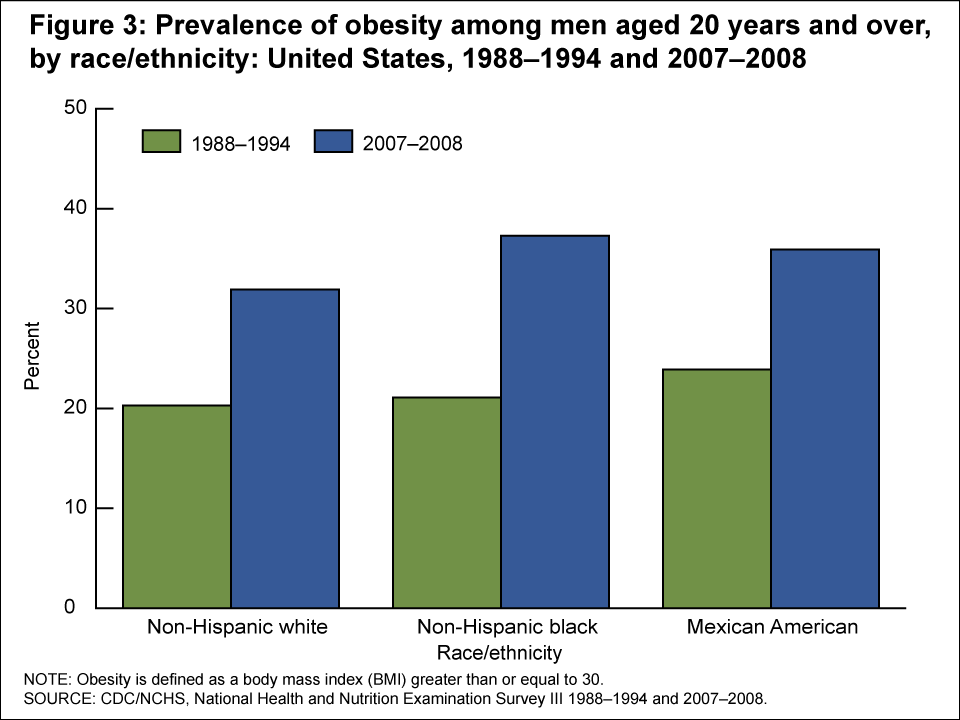
In 2007–2008 and 1988–1994, there were no significant differences between racial and ethnic groups in the prevalence of obesity among men.
Between 1988–1994 and 2007–2008, the prevalence of obesity among men increased (Figure 3):
- From 20.3% to 31.9% among non-Hispanic white men.
- From 21.1% to 37.3% among non-Hispanic black men.
- From 23.9% to 35.9% among Mexican-American men.
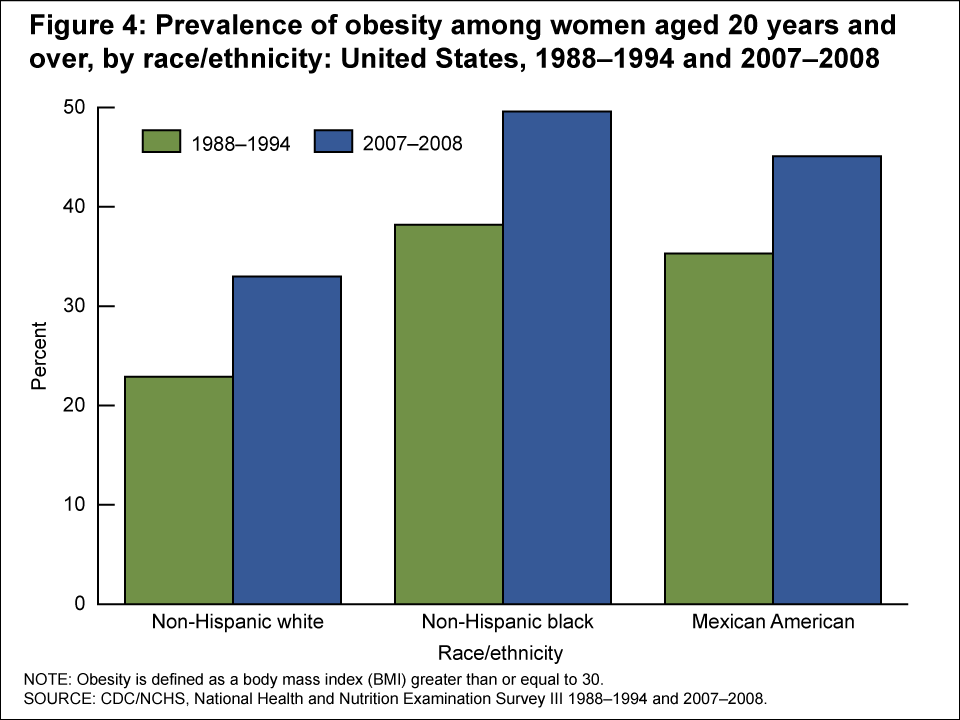
Among women in 2007–2008, non-Hispanic black women (49.6%) were significantly more likely to be obese than non-Hispanic white women (33.0%). Similarly, Mexican-American women (45.1%) were more likely to be obese than non-Hispanic white women (33.0%). Similar disparities existed in 1988–1994 (22.9% of non-Hispanic white women, 38.3% of non-Hispanic black women, and 35.3% of Mexican-American women were obese).
Between 1988–1994 and 2007–2008, the prevalence of obesity among women increased (Figure 4):
- From 22.9% to 33.0% among non-Hispanic white women.
- From 38.2% to 49.6% among non-Hispanic black women.
- From 35.3% to 45.1% among Mexican-American women.
NHANES used a stratified, multistage probability sample of the civilian noninstitutionalized U.S. population. A household interview and a physical examination were conducted for each survey participant. During the physical examination, conducted in a mobile examination center, height and weight were measured as part of a comprehensive set of body measurements. These measurements were taken by trained health technicians, using standardized measuring procedures and equipment. Observations for pregnant women and for persons missing a valid height or weight measurement were not included in the data analysis.
Figures
Tables
Table 1. Age-adjusted prevalence of overweight, obesity, and extreme obesity among U.S. adults aged 20 and over
| Sample size and weight status | NHANES 1988-1994 |
NHANES 1999-2000 |
NHANES 2001-2002 |
NHANES 2003-2004 |
NHANES 2005-2006 |
NHANES 2007-2008 |
|---|---|---|---|---|---|---|
| Sample (n) | 16,679 | 4,117 | 4,413 | 4,431 | 4,356 | 5,555 |
| Overweight (25 ≤ BMI < 30) |
33.1 | 34.0 | 35.1 | 34.1 | 32.7 | 34.2 |
| Obese (BMI ≥ 30) |
22.9 | 30.5 | 30.6 | 32.2 | 34.3 | 33.8 |
| Extremely obese (BMI ≥ 40) | 2.9 | 4.7 | 5.1 | 4.8 | 5.9 | 5.7 |
NOTES: NHANES is National Health and Nutrition Examination Survey; BMI is body mass index. Age-adjusted by the direct method to the year 2000 U.S. Census Bureau estimates using the age groups 20-39, 40-59, and 60 years and over. Crude estimates (not age adjusted) for 2007-2008 are 34.4% overweight, 33.9% obese, and 5.7% extremely obese. Pregnant females were excluded from the analysis.
Table 2. Age-adjusted prevalence of overweight, obesity, and extreme obesity among U.S. adults aged 20-74
| Sample size and weight status | NHES I 1960-1962 |
NHANES I 1971-1974 |
NHANES II 1976-1980 |
NHANES III 1988-1994 |
NHANES 1999-2000 |
NHANES 2001-2002 |
NHANES 2003-2004 |
NHANES 2005-2006 |
NHANES 2007-2008 |
|---|---|---|---|---|---|---|---|---|---|
| Sample (n) | 6,126 | 12,911 | 11,765 | 14,468 | 3,603 | 3,916 | 3,756 | 3,835 | 4,881 |
| Overweight (25 ≤ BMI < 30) |
31.5 | 32.3 | 32.1 | 32.7 | 33.6 | 34.4 | 33.4 | 32.2 | 33.6 |
| Obese (BMI ≥ 30) |
13.4 | 14.5 | 15.0 | 23.2 | 30.9 | 31.3 | 32.9 | 35.1 | 34.3 |
| Extremely obese (BMI ≥ 40) |
0.9 | 1.3 | 1.4 | 3.0 | 5.0 | 5.4 | 5.1 | 6.2 | 6.0 |
NOTES: NHES is National Health Examination Survey; NHANES is National Health and Nutrition Examination Survey; BMI is body mass index. Age-adjusted by the direct method to the year 2000 U.S. Census Bureau estimates using the age groups 20-39, 40-59, and 60-74 years. NHES included adults aged 18-79, and NHANES I and II did not include individuals over age 74, so trend estimates are based on ages 20-74. Pregnant females were excluded from the analysis.
Table 3. Prevalence of obesity among U.S. adults aged 20 and over, by sex and race/ethnicity, for selected years 1988-1994 through 2007-2008
| Characteristic | NHANES 1988-1994 | NHANES 1999-2000 |
NHANES 2001-2002 | NHANES 2003-2004 | NHANES 2005-2006 | NHANES 2007-2008 |
|---|---|---|---|---|---|---|
| Men, All | 20.2 | 27.5 | 27.8 | 31.1 | 33.3 | 32.2 |
| Men, Non-Hispanic white | 20.3 | 27.3 | 29.1 | 31.1 | 33.1 | 31.9 |
| Men, Non-Hispanic black | 21.1 | 28.1 | 27.9 | 34.0 | 37.2 | 37.3 |
| Men, Mexican American | 23.9 | 28.9 | 25.9 | 31.6 | 27.0 | 35.9 |
| Women1, All | 25.4 | 33.4 | 33.3 | 33.2 | 35.3 | 35.5 |
| Women1, Non-Hispanic white | 22.9 | 30.1 | 31.3 | 30.2 | 32.9 | 33.0 |
| Women1, Non-Hispanic black | 38.2 | 49.7 | 48.3 | 53.9 | 52.9 | 49.6 |
| Women1, Mexican American | 35.3 | 39.7 | 37.0 | 42.3 | 42.1 | 45.1 |
1 Excludes pregnant females.
NOTES: NHANES is National Health and Nutrition Examination Survey. Age-adjusted by the direct method to the year 2000 U.S. Census Bureau estimates using the age groups 20-39, 40-59, and 60 years and over. Obesity is defined as having a body mass index (BMI) greater than or equal to 30.
For more detailed estimates see
- Flegal KM, Carroll MD, Ogden CL, Johnson CL. Prevalence and trends in obesity among U.S. adults, 1999–2000. JAMA 288(14):1723–7. 2002.
- Ogden CL, Carroll MD, Curtin LR, McDowell MA, Tabak CJ, Flegal KM. Prevalence of overweight and obesity in the United States, 1999–2004. JAMA 295(13):1549–55. 2006.
- Ogden CL, Carroll MD, McDowell MA, Flegal KM. Obesity among adults in the United States—No statistically significant change since 2003–2004 [PDF – 366 KB]. NCHS data brief no 1. Hyattsville, MD: National Center for Health Statistics. 2007.
- Flegal KM, Carroll MD, Ogden CL, Curtin LR. Prevalence and trends in obesity among U.S. adults, 1999–2008. JAMA 303(3):235–41. 2010.