Deaths: Final Data for 2003
by Donna L. Hoyert, Ph.D.; Melonie Heron, Ph.D.; Sherry L. Murphy, B.S.; and Hsiang-Ching Kung, Ph.D., Division of Vital Statistics
This report from the Centers for Disease Control and Prevention’s (CDC) National Center for Health Statistics (NCHS) provides selected key findings for the 2003 final mortality data for the United States and signals the release of the final national mortality data for 2003. The findings come from information reported on death certificates completed by funeral directors, attending physicians, medical examiners, and coroners.
Generally, mortality patterns in 2003 were consistent with long-term trends. A report that includes a more complete analysis of the final data is in press. Key findings, illustrated in Tables 1–4 [PDF – 42 KB] and Figures 1–3, show:
Mortality experience in 2003
- In 2003, a total of 2,448,288 deaths occurred in the United States (Tables 1 and 2).
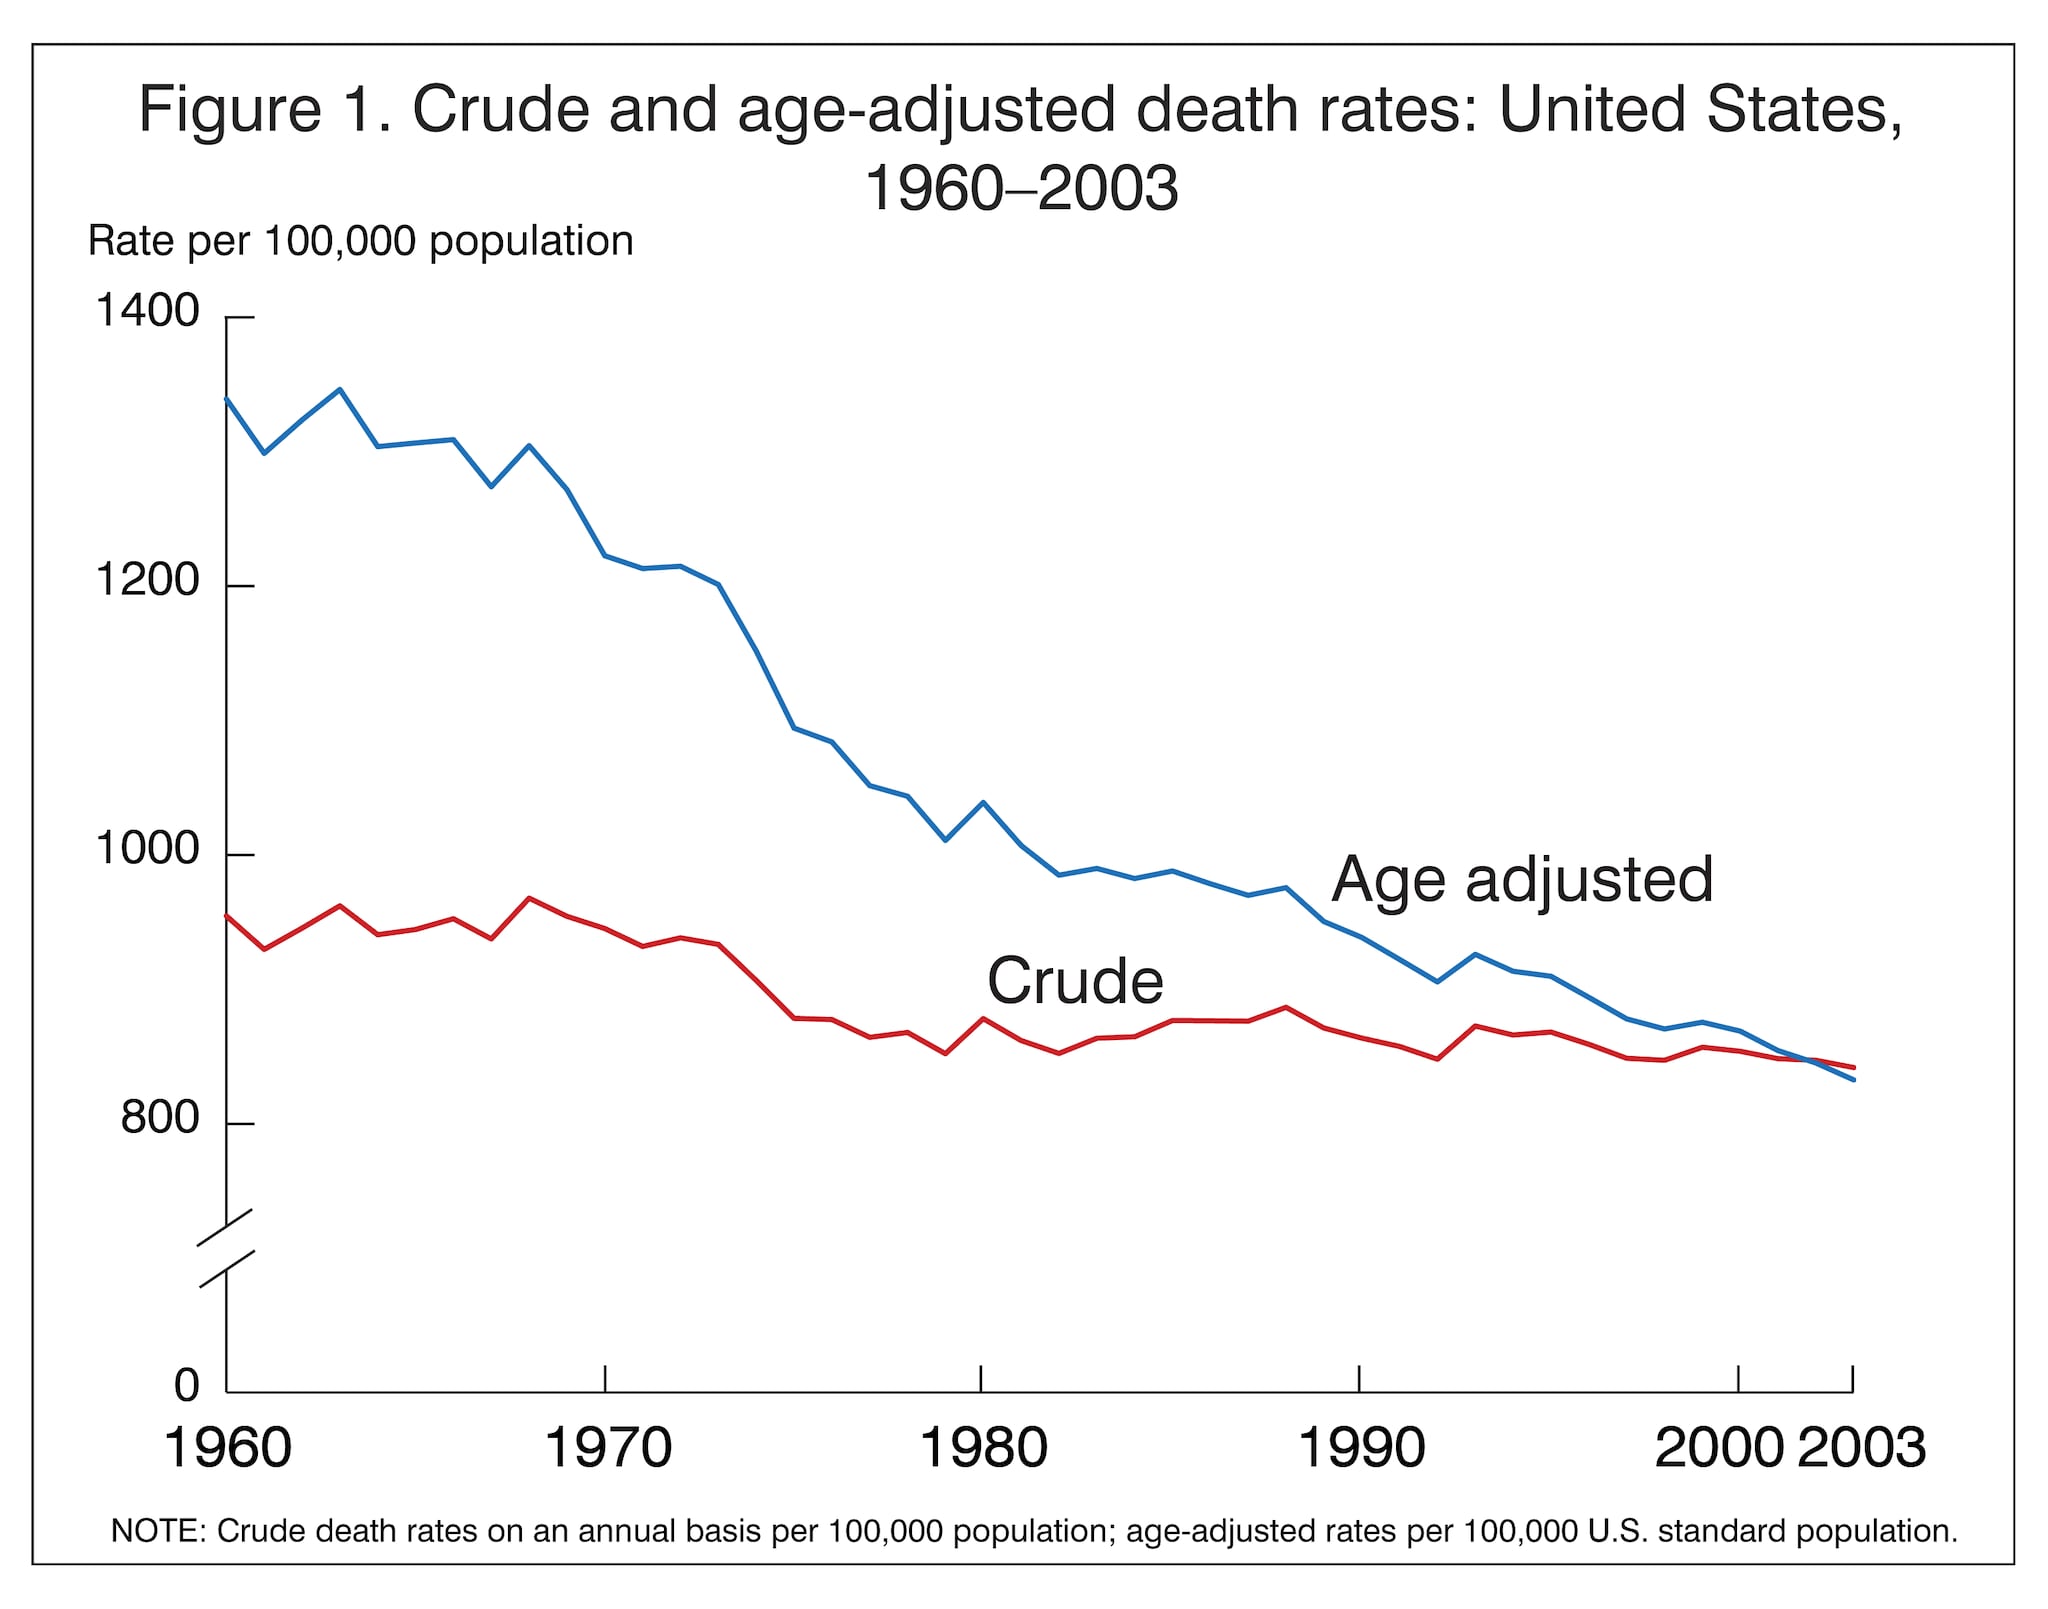
- The age-adjusted death rate (Tables 1 and 2), which takes the aging of the population into account, was 832.7 deaths per 100,000 U.S. standard population.
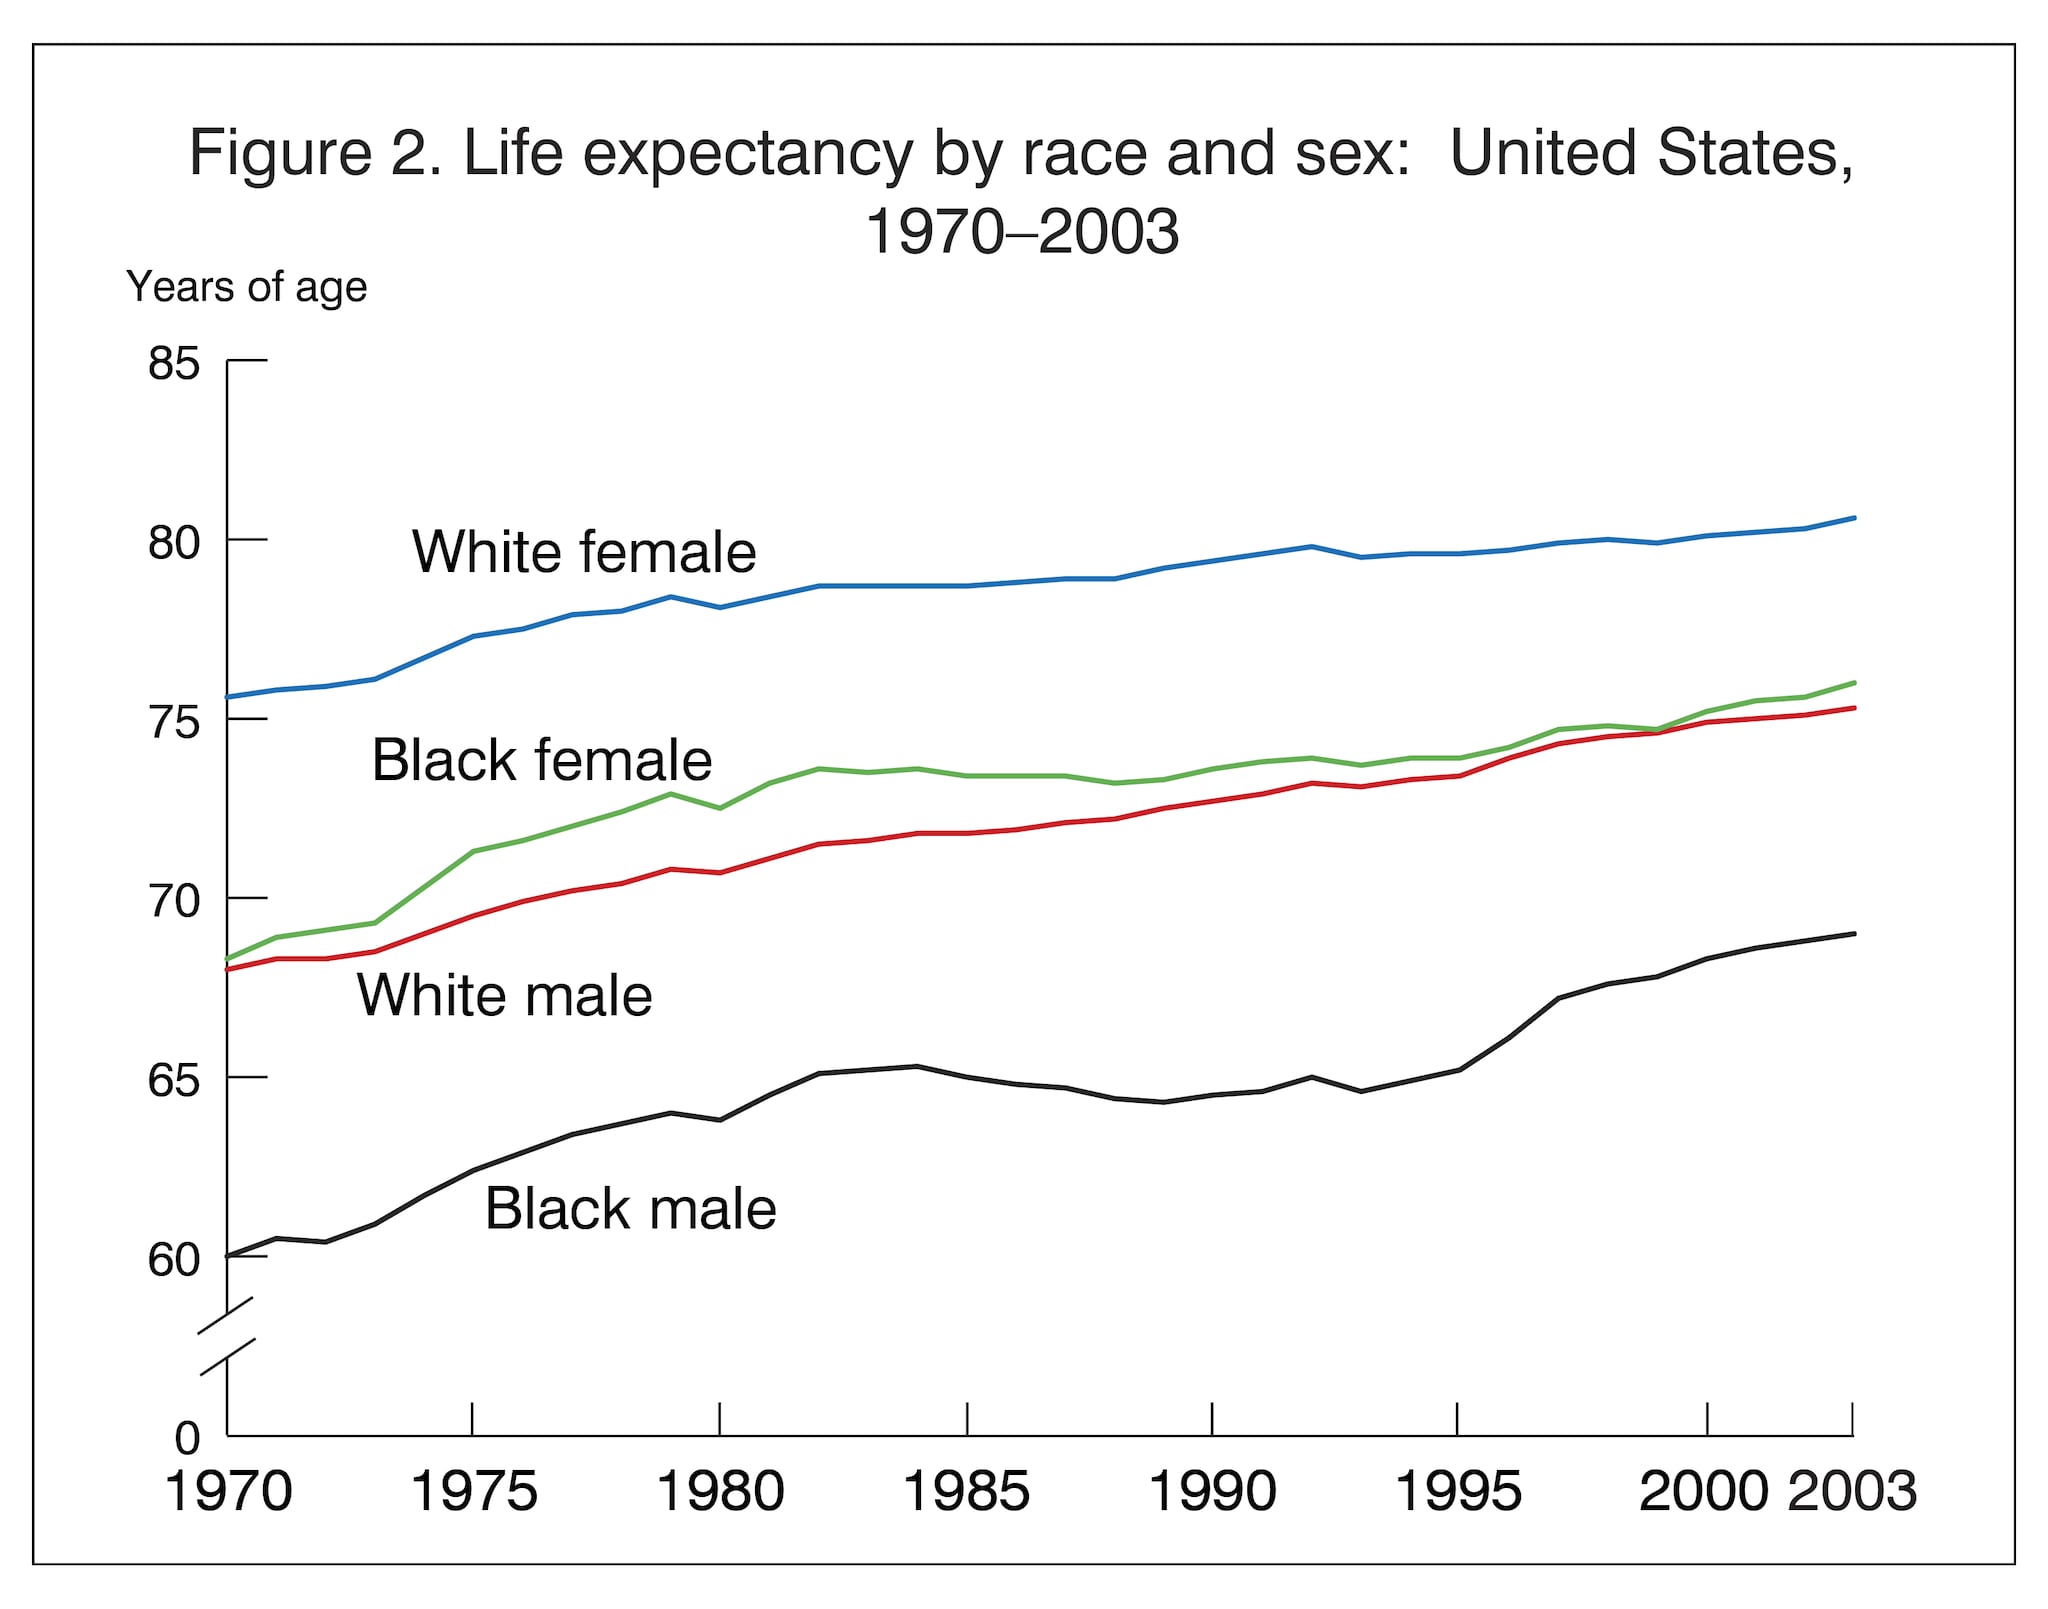
- Life expectancy at birth (Table 1) was 77.5 years.
- The 15 leading causes of death in 2003 (Table 2) were:
- Diseases of heart (heart disease)
- Malignant neoplasms (cancer)
- Cerebrovascular diseases (stroke)
- Chronic lower respiratory diseases
- Accidents (unintentional injuries)
- Diabetes mellitus (diabetes)
- Influenza and pneumonia
- Alzheimer’s disease
- Nephritis, nephrotic syndrome and nephrosis (kidney disease)
- Septicemia
- Intentional self-harm (suicide)
- Chronic liver disease and cirrhosis
- Essential (primary) hypertension and hypertensive renal disease (hypertension)
- Parkinson’s disease
- Assault (homicide)
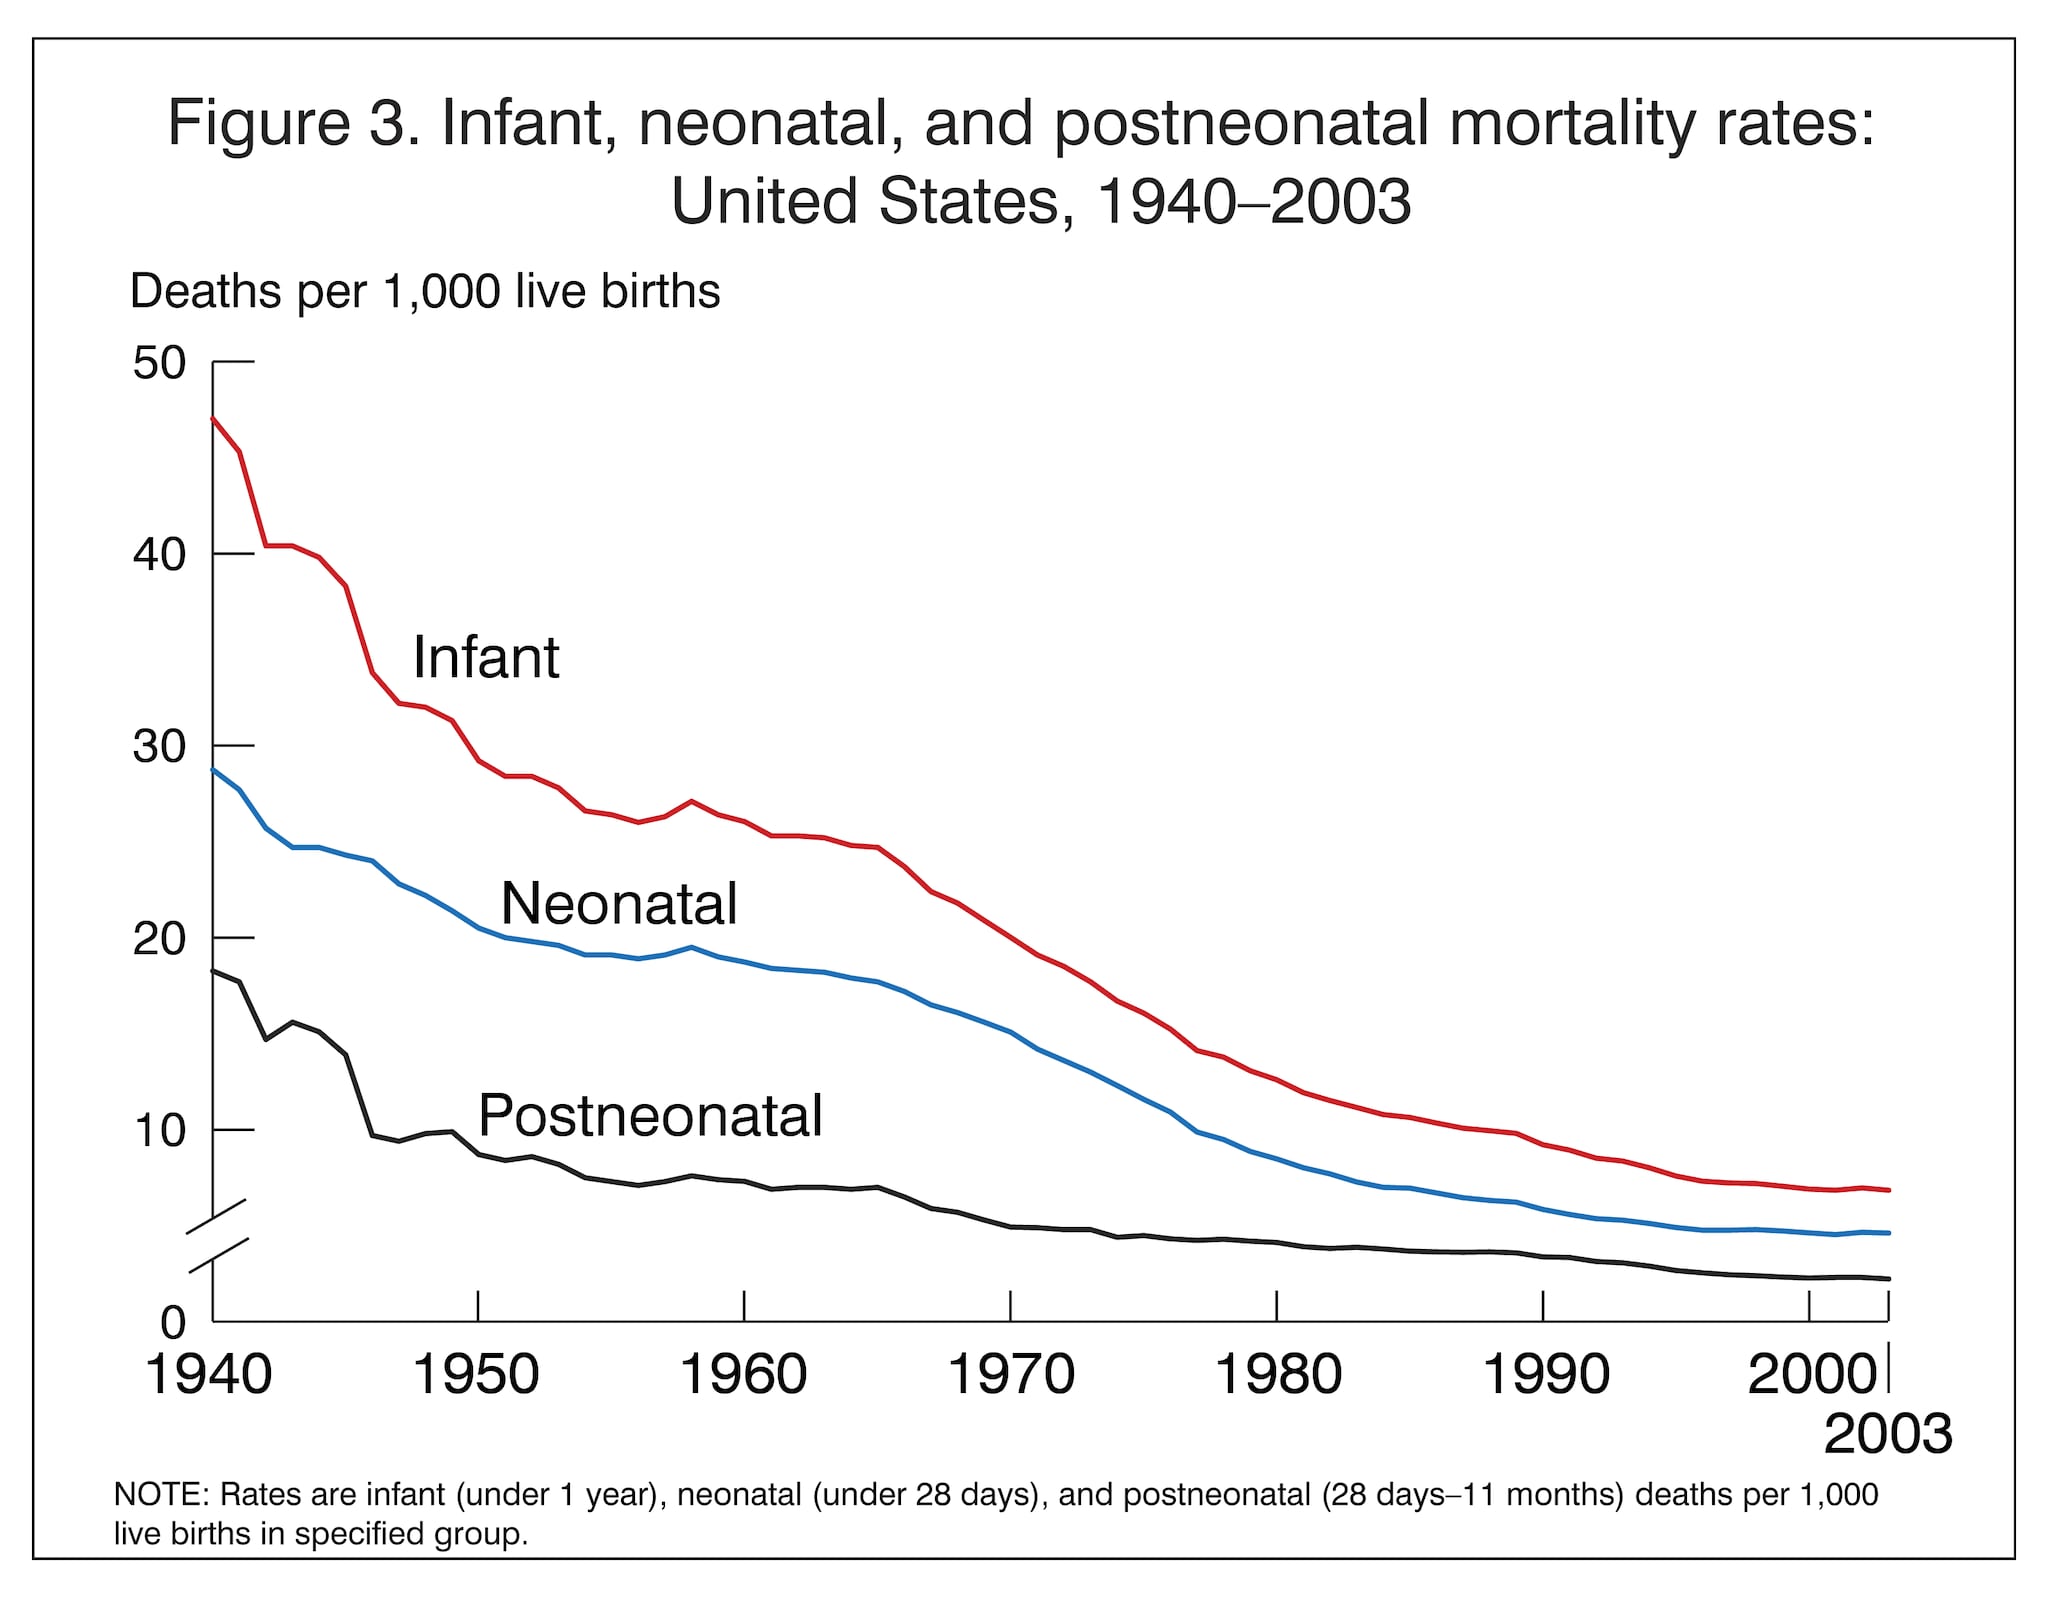
- In 2003, the infant mortality rate was 6.85 infant deaths per 1,000 live births (Tables 1 and 3).
- The 10 leading causes of infant death (Table 4) were:
- Congenital malformations, deformations, and chromosomal abnormalities (congenital malformations)
- Disorders relating to short gestation and low birthweight, not elsewhere classified (low birthweight)
- Sudden infant death syndrome (SIDS)
- Newborn affected by maternal complications of pregnancy (maternal complications)
- Newborn affected by complications of placenta, cord, and membranes (cord and placental complications)
- Accidents (unintentional injuries)
- Respiratory distress of newborn
- Bacterial sepsis of newborn
- Neonatal hemorrhage
- Diseases of the circulatory system (circulatory diseases)
Trends
- The age-adjusted death rate in 2003 was a record low (Figure 1) and 1.5 percent less than the 2002 rate.
- Life expectancy was 77.5 years, a record high that surpassed the previous highest value recorded in 2002 by 0.2 years. Record high life expectancy was attained by the total population, as well as by each of the black and white populations. Both males and females in each of the two major race groups attained record high levels (Figure 2).
- For the most part, the 15 leading causes of death in 2003 remained the same as in 2002. Age-adjusted death rates decreased from 2002 to 2003 for 4 of the 15 leading causes of death and increased for 5 of the 15 leading causes of death (Table 2). Decreasing trends for heart disease, cancer, and stroke, the three leading causes, continued. Increasing trends for Alzheimer’s disease continued.
- Differences in mortality between men and women continued to narrow (Table 1 and Figure 2). The age-adjusted death rate for men was 41 percent greater than that for women (down from 42 percent greater in 2002), and life expectancy for men was less than that for women by 5.3 years, the smallest difference since 1948.
- Differences in mortality between the black and white populations persisted even though there was a trend toward convergence (Tables 1–3 and Figure 2). The age-adjusted death rate was 1.3 times greater, the infant mortality rate 2.4 times greater, and maternal mortality rate 3.5 times greater for the black population than that for the white population. Life expectancy for the white population exceeded that for the black population by 5.3 years.
- The number of maternal deaths increased by 138 deaths between 2002 and 2003 resulting in a maternal mortality rate of 12.1 deaths per 100,000 live births (Table 1). The increase, in part, reflects that an increasing number of States use a separate item on pregnancy status on the death certificate to help identify these deaths (see “Technical Notes ”).
- The infant mortality rate (Figure 3) decreased significantly in 2003; infant mortality had increased for the first time in over four decades in 2002.
Technical Notes
Nature and sources of data
Data in this report are based on information from all death certificates filed in the 50 States and the District of Columbia and are processed by the CDC’s NCHS. Data for 2003 are based on records of deaths that occurred during 2003 and were received as of February 28, 2005. The U.S. Standard Certificate of Death—which is used as a model by the States—was revised in 2003 (1). Prior to 2003, the Standard Certificate of Death had not been revised since 1989. This report includes data for 5 areas (California, Idaho, Montana, New York City, and New York State), which implemented the 2003 revision of the U.S. Standard Certificate of Death in 2003 and for the remaining 46 States and the District of Columbia that collected and reported death data in 2003 based on the 1989 revision of the U.S. Standard Certificate of Death. The 1989 and 2003 revisions are described in detail elsewhere (1–4).
Since most of the items presented in this report appear largely comparable despite changes to item wording and format in the 2003 revision, data from both groups of States are combined unless otherwise stated.
Mortality statistics are based on information coded by the States and provided to NCHS through the Vital Statistics Cooperative Program (VSCP) and from copies of the original certificates received by NCHS from the State registration offices. In 2003, all the States and the District of Columbia participated in this program and submitted part or all of the mortality data for 2003 in electronic data files to NCHS. All areas provided precoded medical (cause-of-death) data to NCHS except Illinois, New York City, and West Virginia. For 2003, all States submitted precoded demographic data for all deaths.
Refer to the “Technical Notes” of the forthcoming full report or previous year’s publication for information on processing of data and more detailed information on the data (5,6). The following describes some details that are different for the 2003 file.
Race and Hispanic origin
The 2003 revision of the U.S. Standard Certificate of Death allows the reporting of more than one race (multiple races) (1). This change was implemented to reflect the increasing diversity of the population of the United States and to be consistent with the decennial census. The race and ethnicity items on the revised certificate are compliant with the revisions to the 1977 Race and Ethnic Standards for Federal Statistics and Administrative Reporting, which were issued by the Office of Management and Budget (OMB) in 1997. The new standards mandate the collection of more than one race for Federal data (7).
In 2003, multiple race was reported on the revised death certificates of California, Idaho, Montana, and New York, as well as on the unrevised certificates of Hawaii, Maine, and Wisconsin. Refer to the “Technical Notes” of the forthcoming full report for details (6).
Data from the vital records of the remaining 43 States and the District of Columbia are based on the 1989 revision of the U.S. Standard Certificate of Death, which follows the 1977 OMB standard, allowing only a single race to be reported (2,8).
In order to provide uniformity and comparability of the data during the transition period, before all or most of the data are available in the new multiple-race format, it was necessary to ‘‘bridge’’ the responses of those for whom more than one race was reported (multiple race) to one, single race. The bridging procedure is similar to the procedure used to bridge multiracial population estimates (9,10). Multiracial decedents are imputed to a single race (either white, black, American Indian or Alaska Native, or Asian or Pacific Islander) according to their combination of races, Hispanic origin, sex, and age indicated on the death certificate. The imputation procedure is described in detail in the following document: NCHS Procedures for Multiple-Race and Hispanic Origin Data: Collection, Coding, Editing, and Transmitting [PDF – 74 KB].
Maternal mortality
Maternal mortality rates are computed on the basis of the number of live births. The maternal mortality rate indicates the likelihood of a pregnant woman dying of maternal causes. They are calculated by dividing the number of maternal deaths in a calendar year by the number of live births registered for the same period and are presented as rates per 100,000 live births. The number of live births used in the denominator is an approximation of the population of pregnant women who are at risk of a maternal death.
“Maternal deaths” are defined by the World Health Organization as “the death of a woman while pregnant or within 42 days of termination of pregnancy, irrespective of the duration and the site of the pregnancy, from any cause related to or aggravated by the pregnancy or its management, but not from accidental or incidental causes” (11). Included in these deaths are ICD–10 codes A34, O00-O95, and O98-O99.
Some State death certificates include a separate question regarding pregnancy status. A positive response to the question is interpreted as if “pregnant” was reported in Part II of the cause-of-death section of the death certificate. If a specified length of time is not provided by the medical certifier, it is assumed that the pregnancy terminated 42 days or less prior to death. Further, if only indirect maternal causes of death (i.e., a previously existing disease or a disease that developed during pregnancy that was not due to direct obstetric causes but was aggravated by physiologic effects of pregnancy) are reported in Part I and pregnancy is reported in either Part I or Part II, the death is classified as a maternal death.
In 2003, 21 States have a separate question related to pregnancy status of female decedents around the time of their death and 2 States have a prompt encouraging certifiers to report recent pregnancies on the death certificate; however, there are at least 6 different questions used. The 2003 revision of the U.S. Standard Certificate of Death introduced a standard question format with categories designed to utilize additional codes available in ICD–10 for deaths associated with pregnancy, childbirth, and the puerperium. As States revise their certificates, most States are expected to introduce the standard item or replace pre-existing questions with the standard item, so that there will be wider adoption of a pregnancy status item across the country and greater standardization of the particular item used.
A separate pregnancy status item on the death certificate results in the identification of more maternal deaths. Refer to the “Technical Notes” of the forthcoming full report for details (6).
Population bases for computing rates
Populations used for computing death rates and life tables shown in this report represent the population residing in the United States, enumerated as of April 1 for census years and estimated as of July 1 for all other years. Population estimates used to compute death rates for the United States for 2003 are available by single years of age on the Mortality Data website (12).
Death rates, shown in this report, for 1991–2003 are based on populations that are consistent with the 2000 census levels (12–23). These estimates were produced under a collaborative arrangement with the U.S. Census Bureau and are based on the 2000 census counts by age, race, and sex, modified to be consistent with OMB race categories as of 1977 and historical categories for death data (8). The modification procedures are described in detail elsewhere (9,10).
Availability of mortality data
Mortality data are available in publications, unpublished tables, and electronic products as described on the Mortality Data website . More detailed analysis than provided in this report is possible by using the Mortality public-use data set issued each data year. Since 1991, the data set is available through NCHS in CD-ROM format. Data are also available in the Vital Statistics of the United States, Mortality, and Vital and Health Statistics, Series 20 reports, and the National Vital Statistics Reports through NCHS.
References
- National Center for Health Statistics. 2003 revision of the U.S. Standard Certificate of Death [PDF – 553 KB]. 2003.
- Tolson GC, Barnes JM, Gay GA, Kowaleski JL. The 1989 revision of the U.S. standard certificates and reports. National Center for Health Statistics. Vital Health Stat 4(28). 1991.
- National Center for Health Statistics. Technical appendix. Vital statistics of the United States, 1989, vol II, mortality, part A. Washington: Public Health Service. 1992.
- National Center for Health Statistics. Report of the Panel to Evaluate the U.S. Standard Certificates [PDF – 1.9 MB]. National Center for Health Statistics. 2000.
- Kochanek KD, Murphy SL, Anderson RN, Scott C. Deaths: Final data for 2002. National vital statisitics reports; vol 53 no 5. Hyattsville, MD: National Center for Health Statistics. 2004.
- Hoyert DL, Heron M, Murphy SL, Kung HC. Deaths: Final data for 2003. National vital statisitics reports; vol 54 no ?. Hyattsville, MD: National Center for Health Statistics. Forthcoming.
- Office of Management and Budget. Revisions to the standards for the classification of Federal data on race and ethnicity. Federal Register 62FR58782–58790. October 30, 1997.
- Office of Management and Budget. Race and ethnic standards for Federal statistics and administrative reporting. Statistical policy directive 15. 1977.
- Ingram DD, Parker JD, Schenker N, Weed JA, et al. United States census 2000 population with bridged race categories. National Center for Health Statistics. Vital Health Stat 2(135). 2003.
- Schenker N, Parker JD. From single-race reporting to multiple-race reporting: Using imputation methods to bridge the transition. Statistics in Medicine. 22: 1571–87. 2003.
- World Health Organization. International Statistical Classification of Diseases and Related Health Problems, Tenth Revision. Geneva: World Health Organization. 1992.
- National Center for Health Statistics. Postcensal estimates of the resident population of the United States as of July 1, 2003, by year, State and county, age, bridged race, sex, and Hispanic origin. File pcenV2003.zip (zipped) or pcen v2003.txt (ASCII). Released September 14, 2004.
- National Center for Health Statistics. Postcensal estimates of the resident population of the United States as of July 1, 2002, by year, State and county, age, bridged race, sex, and Hispanic origin. File cenV2002.zip (zipped) or pcen v2002.txt (ASCII). Released August 1, 2003.
- National Center for Health Statistics. Estimates of the July 1, 2001, United States resident population by age, sex, race, and Hispanic origin, prepared under a collaborative arrangement with the U.S. Census Bureau. 2003.
- National Center for Health Statistics. Estimates of the April 1, 2000, United States resident population by age, sex, race, and Hispanic origin, prepared under a collaborative arrangement with the U.S. Census Bureau. 2003.
- National Center for Health Statistics. Estimates of the July 1, 1999, United States resident population by State and county, age, sex, race, and Hispanic origin, prepared under a collaborative arrangement with the U.S. Census Bureau. Released April 15, 2003.
- National Center for Health Statistics. Estimates of the July 1, 1998, United States resident population by State and county, age, sex, race, and Hispanic origin, prepared under a collaborative arrangement with the U.S. Census Bureau. Released April 15, 2003.
- National Center for Health Statistics. Estimates of the July 1, 1997, United States resident population by State and county, age, sex, race, and Hispanic origin, prepared under a collaborative arrangement with the U.S. Census Bureau. Released April 15, 2003.
- National Center for Health Statistics. Estimates of the July 1, 1996, United States resident population by State and county, age, sex, race, and Hispanic origin, prepared under a collaborative arrangement with the U.S. Census Bureau. Released April 15, 2003.
- National Center for Health Statistics. Estimates of the July 1, 1995, United States resident population by State and county, age, sex, race, and Hispanic origin, prepared under a collaborative arrangement with the U.S. Census Bureau. Released April 15, 2003.
- National Center for Health Statistics. Estimates of the July 1, 1994, United States resident population by State and county, age, sex, race, and Hispanic origin, prepared under a collaborative arrangement with the U.S. Census Bureau. Released April 15, 2003.
- National Center for Health Statistics. Estimates of the July 1, 1993, United States resident population by State and county, age, sex, race, and Hispanic origin, prepared under a collaborative arrangement with the U.S. Census Bureau. Released April 15, 2003.
- National Center for Health Statistics. Estimates of the July 1, 1992, United States resident population by State and county, age, sex, race, and Hispanic origin, prepared under a collaborative arrangement with the U.S. Census Bureau. Released April 15, 2003.
Figures
Suggested citation
Hoyert DL, Heron M, Murphy SL, Kung HC. Deaths: Final data for 2003. Health E-Stats. Released January 19, 2006.
Acknowledgments
This report was prepared in the Division of Vital Statistics under the general direction of Robert N. Anderson, Chief, Mortality Statistics Branch. Elizabeth Arias of the Mortality Statistics Branch provided content related to life expectancy. Robert N. Anderson and Sherry Murphy of the Mortality Statistics Branch, and David W. Justice of the Data Acquisition and Evaluation Branch contributed to the “Technical Notes.” Thomas D. Dunn of the Systems, Programming and Statistical Resources Branch provided statistical content review. Jordan A. Sacks, Manju Sharma, John Birken, Charles E. Royer, and Gail A. Parr, formerly, of the Systems, Programming and Statistical Resources Branch provided computer programming support. Steven J. Steimel and David P. Johnson of the Systems, Programming and Statistical Resources Branch prepared the mortality file. Staff of the Mortality Statistics Branch provided content and table review. Registration Methods staff and staff of the Data Acquisition and Evaluation Branch provided consultation to State vital statistics offices regarding collection of the death certificate data on which this report is based. This report was edited by Joanna Kim, NOVA contractor and Demarius Miller, NCHS senior editor, graphics were produced by Michael Jones, NOVA contractor, and assembled in FrontPage for Internet release by Christine Brown, Office of Information Services, Information Design and Publishing Staff.