Trends in Drug-poisoning Deaths Involving Opioid Analgesics and Heroin: United States, 1999–2012
by Margaret Warner, Ph.D., Division of Vital Statistics; and Holly Hedegaard, M.D., M.S.P.H., and Li-Hui Chen, M.S., Ph.D., Office of Analysis and Epidemiology
PDF Version (185 KB)
This Health E-Stat provides information on annual rates of all drug-poisoning deaths and drug-poisoning deaths involving opioid analgesics and heroin for 1999 through 2012 using data from the Centers for Disease Control and Prevention’s (CDC) National Vital Statistics System.
National Trends
In 2012, there were 41,502 deaths due to drug poisoning (often referred to as drug-overdose deaths) in the United States (Table), of which 16,007 involved opioid analgesics and 5,925 involved heroin.
From 1999 through 2012, the age-adjusted drug-poisoning death rate nationwide more than doubled, from 6.1 per 100,000 population in 1999 to 13.1 in 2012 (Figure 1). During the same period, the age-adjusted rates for drug-poisoning deaths involving opioid analgesics more than tripled, from 1.4 per 100,000 in 1999 to 5.1 in 2012. Opioid-analgesic death rates increased at a fast pace from 1999 through 2006, with an average increase of about 18% each year, and then at a slower pace from 2006 forward. The decline in opioid-analgesic death rates from 2011 through 2012, a decline of 5%, is the first decrease seen in more than a decade.
Also from 1999 through 2012, the age-adjusted rates for drug-poisoning deaths involving heroin nearly tripled, from 0.7 deaths per 100,000 in 1999 to 1.9 in 2012. The rates increased substantially beginning in 2006. Between 2011 and 2012, the rate of drug-poisoning deaths involving heroin increased 35%, from 1.4 per 100,000 to 1.9.
In 2012, 14 states had age-adjusted drug-poisoning death rates that were significantly higher than the overall U.S. rate (Figure 2). The states with the highest rates per 100,000 population were West Virginia (32.0), Kentucky (25.0), New Mexico (24.7), Utah (23.1), and Nevada (21.0).
Data sources and methods
Estimates are based on the National Vital Statistics System’s multiple cause-of-death mortality files (1). Deaths were classified using the International Classification of Diseases, Tenth Revision (ICD–10) (2). Drug-poisoning deaths were defined as having an ICD–10 underlying cause-of-death code of X40–X44 (unintentional), X60–X64 (suicide), X85 (homicide), or Y10–Y14 (undetermined intent). Drug-poisoning deaths involving opioid analgesics include those with a multiple cause-of-death code of T40.2, T40.3, or T40.4. Drug-poisoning deaths involving heroin include those with a multiple cause-of-death code of T40.1.
Age-adjusted death rates were calculated using the direct method and the 2000 standard population (1). Trends in death rates and number of deaths were evaluated using the Joinpoint Regression Program (3).
Several factors related to death investigation and reporting may affect measurement of death rates involving specific drugs. At autopsy, toxicological tests may be performed to determine the type of drugs present. The substances tested for and circumstances under which the tests are performed vary by jurisdiction. Measurement errors related to these factors are more likely to affect substance-specific death rates than the overall drug-poisoning death rate.
Additionally, classification of drug-poisoning deaths can be problematic if the specific drugs involved are not mentioned on the death certificate. In 2011, approximately 25% of drug-poisoning deaths did not include information on the specific types of drugs involved (4). These deaths could potentially have involved opioid analgesics, heroin, or both.
References
- NCHS. Multiple cause-of-death data, 1999–2012. CDC WONDER online database. 2014.
- WHO. International statistical classification of diseases and related health problems, tenth revision (ICD–10). 2008 ed. Geneva, Switzerland. 2009.
- National Cancer Institute. Joinpoint Regression Program (Version 3.4.3.) [computer software]. 2010.
- Chen LH, Hedegaard H, Warner M. Drug-poisoning deaths involving opioid analgesics: United States, 1999–2011. NCHS data brief, no 166. Hyattsville, MD: National Center for Health Statistics. 2014.
Figures
Figure 1. Age-adjusted drug-poisoning death rates: United States 1999–2012

NOTE: Drug-poisoning deaths may involve both opioid analgesics and heroin.
SOURCE: CDC/NCHS, National Vital Statistics System, Mortality File.
Figure 2. Age-adjusted drug-poisoning death rates, by state: United States, 2012
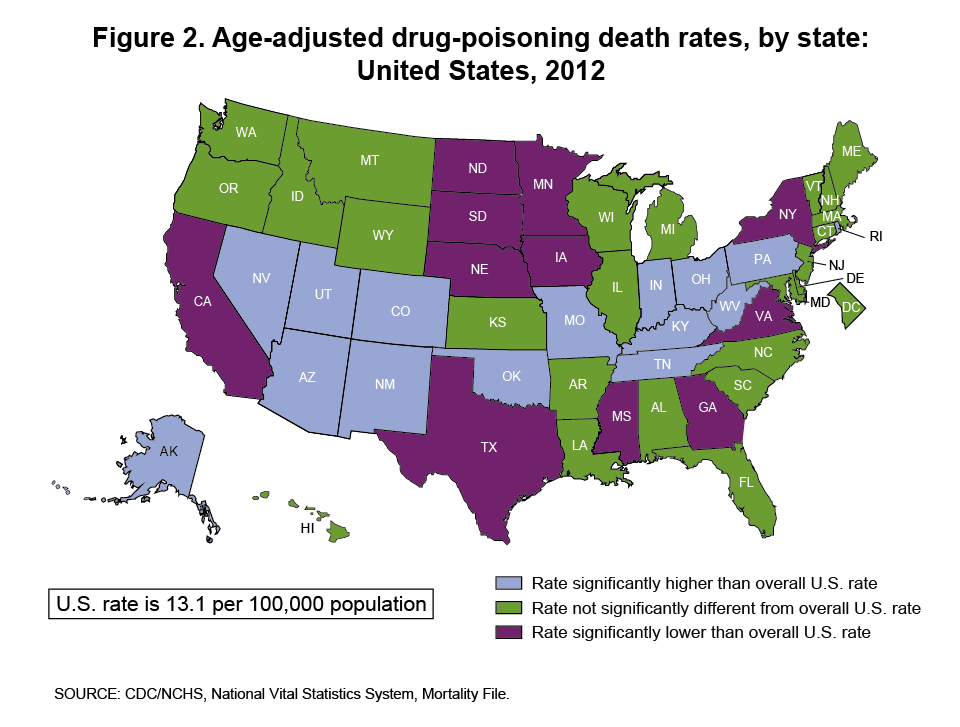
SOURCE: CDC/NCHS, National Vital Statistics System, Mortality File.
Table
Table. Number and age-adjusted rate of drug-poisoning deaths involving opioid analgesics and heroin: United States, 1999-2012
| All | Opioid analgesics | Heroin | ||||
|---|---|---|---|---|---|---|
| Year | Number | Rate | Number | Rate | Number | Rate |
| 1999 | 16,849 | 6.1 | 4,030 | 1.4 | 1,960 | 0.7 |
| 2000 | 17,415 | 6.2 | 4,400 | 1.5 | 1,842 | 0.7 |
| 2001 | 19,394 | 6.8 | 5,528 | 1.9 | 1,779 | 0.6 |
| 2002 | 23,518 | 8.2 | 7,456 | 2.6 | 2,089 | 0.7 |
| 2003 | 25,785 | 8.9 | 8,517 | 2.9 | 2,080 | 0.7 |
| 2004 | 27,424 | 9.4 | 9,857 | 3.4 | 1,878 | 0.6 |
| 2005 | 29,813 | 10.1 | 10,928 | 3.7 | 2,009 | 0.7 |
| 2006 | 34,425 | 11.5 | 13,723 | 4.6 | 2,088 | 0.7 |
| 2007 | 36,010 | 11.9 | 14,408 | 4.8 | 2,399 | 0.8 |
| 2008 | 36,450 | 11.9 | 14,800 | 4.8 | 3,041 | 1.0 |
| 2009 | 37,004 | 11.9 | 15,597 | 5.0 | 3,278 | 1.1 |
| 2010 | 38,329 | 12.3 | 16,651 | 5.4 | 3,036 | 1.0 |
| 2011 | 41,340 | 13.2 | 16,917 | 5.4 | 4,397 | 1.4 |
| 2012 | 41,502 | 13.1 | 16,007 | 5.1 | 5,925 | 1.9 |
NOTES: Deaths are classified using the International Classification of Diseases, Tenth Revision (ICD–10). Drug-poisoning deaths are identified using ICD–10 underlying cause-of-death codes X40–X44, X60–X64, X85, and Y10–Y14. Opioid-analgesic drug-poisoning deaths are drug-poisoning deaths with a multiple cause-of-death code of T40.2, T40.3, or T40.4. Heroin drug-poisoning deaths are drug-poisoning deaths with a multiple cause-of-death code of T40.1. Approximately 25% of drug-poisoning deaths lack information on the specific drugs involved. Some of these deaths may have involved heroin, opioid analgesics, or both.
SOURCE: CDC/NCHS, National Vital Statistics System, Mortality File.