Recent Trends in Births and Fertility Rates Through June 2013
by Brady E. Hamilton, Ph.D., and Paul D. Sutton, Ph.D., Division of Vital Statistics
PDF Version (86 KB)
The provisional count of births in the United States for the 12-month period ending June 2013 was 3,941,000, which was not significantly different from the 3,944,000 births (provisional count) for the 12-month period ending June 2012 (1). The number of births has declined from the historic high of 4,316,233 in 2007. However, the decline has slowed from 2010 through 2011, and the number was essentially unchanged from 2011 through 2012 (Figure ) (2,3).
The provisional fertility rate in the United States for the 12-month period ending June 2013 was 62.7 births per 1,000 women aged 15–44, which was down slightly (less than 1%) from 63.0 births per 1,000 women aged 15–44 for the 12-month period ending June 2012 (1). The fertility rate has also declined from the recent high of 69.3 in 2007. However, the decline has slowed from 2010 through 2011 and further again from 2011 through 2012 (Figure ) (2,3).
Data sources and methods
Provisional counts of births for 2013 are based on a combination of counts of events provided by each reporting area and registered vital events processed into National Center for Health Statistics (NCHS) data files for the 12 months ending with the specified month (i.e., June 2013). For further information about the provisional counts, see Births, Marriages, Divorces, and Deaths: Provisional Data for 2009 (4). Preliminary birth data for 2012 are based on nearly 100% of 2012 births. Records of the states with less than 100% of records are weighted to independent control counts of all births received in state vital statistics offices in 2012 (2). Final birth data for 2011 and earlier years are based on complete files of 100% of the births registered in state vital statistics offices and reported to NCHS (3).
References
- National Center for Health Statistics. Provisional monthly and 12-month ending number of live births, deaths, and infant deaths and rates: United States, January 2012–June 2013 [PDF – 20 KB]. Internet Table.
- Hamilton BE, Martin JA, Ventura SJ. Births: Preliminary data for 2012 [PDF – 362 KB]. National vital statistics reports; vol 62 no 3. Hyattsville, MD: National Center for Health Statistics. 2013.
- Martin JA, Hamilton BE, Ventura SJ, et al. Births: Final data for 2011 [PDF – 1.6 MB]. National vital statistics reports; vol 62 no 1. Hyattsville, MD: National Center for Health Statistics. 2013.
- Tejada-Vera B, Sutton PD. Births, marriages, divorces, and deaths: Provisional data for 2009 [PDF – 160 KB]. National vital statistics reports; vol 58 no 25. Hyattsville, MD: National Center for Health Statistics. 2010.
Figure
Figure. Birth and fertility rates: United States, final 2005–2011, preliminary 2012, and provisional for the 12 months ending June 2013
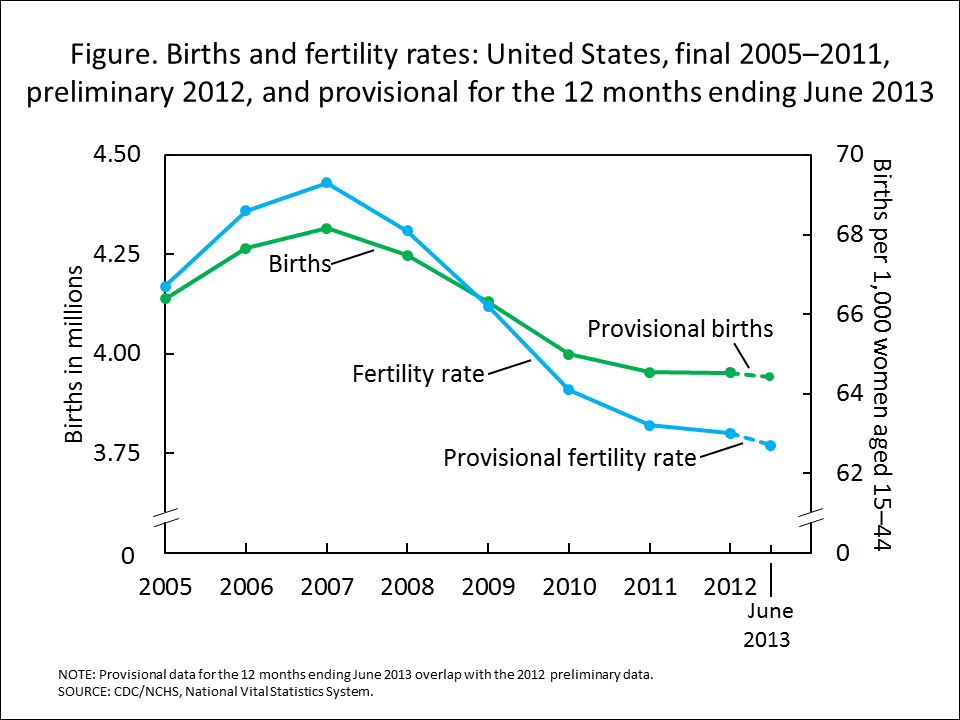
NOTE: Provisional data for the 12 months ending June 2013 overlap with the 2012 preliminary data.
SOURCE: CDC/NCHS, National Vital Statistics System.