|
Key Points for the Public |
|
Vital Signs: State-Specific Obesity Prevalence Among Adults --- United States, 2009
ABSTRACT
Background: Obesity is a costly condition that can reduce quality of life and increases the risk for many serious chronic diseases and premature death. The U.S. Surgeon General issued the Call to Action to Prevent and Decrease Overweight and Obesity in 2001, and in 2007, no state had met the Healthy People 2010 objective to reduce obesity prevalence among adults to 15%.
Methods: CDC used 2009 Behavioral Risk Factor Surveillance System survey data to update estimates of national and state-specific obesity prevalence. Obesity was calculated based on self-reported weight and height and defined as body mass index (weight [kg] / height [m]2) ≥30.
Results: Overall self-reported obesity prevalence in the United States was 26.7%. Non-Hispanic blacks (36.8%), Hispanics (30.7%), those who did not graduate from high school (32.9%), and persons aged 50--59 years (31.1%) and 60--69 years (30.9%) were disproportionally affected. By state, obesity prevalence ranged from 18.6% in Colorado to 34.4% in Mississippi; only Colorado and the District of Columbia (19.7%) had prevalences of <20%; nine states had prevalences of ≥30%.
Conclusions: In 2009, no state met the Healthy People 2010 obesity target of 15%, and the self-reported overall prevalence of obesity among U.S. adults had increased 1.1 percentage points from 2007.
Implications for Public Health Practice: Obesity should be addressed through a comprehensive approach across multiple settings and sectors that can change individual nutrition and physical activity behaviors and the environments and policies that affect these behaviors. New and continued national, state, and community-level surveillance of obesity, its behavioral risk factors, and the environments and policies that affect these behaviors is critical to monitor progress in obesity prevention and to target interventions.
Over the past decade, obesity has become recognized as a national health threat and a major public health challenge. In 2007--2008, based on measured weights and heights (1), approximately 72.5 million adults in the United States were obese (CDC, unpublished data, 2010). Obese adults are at increased risk for many serious health conditions, including coronary heart disease, hypertension, stroke, type 2 diabetes, certain types of cancer, and premature death (2,3). Adult obesity also is associated with reduced quality of life, social stigmatization, and discrimination (2,3). From 1987 to 2001, diseases associated with obesity accounted for 27% of the increases in U.S. medical costs (4). For 2006, medical costs associated with obesity were estimated at as much as $147 billion (2008 dollars); among all payers, obese persons had estimated medical costs that were $1,429 higher than persons of normal weight (5). In 2001, the Surgeon General called for strong public health action to prevent and decrease overweight and obesity (3).
The Behavioral Risk Factor Surveillance System (BRFSS) measures height and weight through self-report in state-based surveys; data are released every year. In 2000, a Healthy People 2010 objective was established to reduce the prevalence of obesity among adults in the United States to 15%.* This objective is based on obesity prevalence from measured height and weight among participants in the National Health and Nutrition Examination Survey (NHANES). Because NHANES provides only national and not state-specific estimates, CDC uses the state-based BRFSS data and applies the 15% prevalence figure as a reasonable target for self-reported obesity prevalence in the states. As of 2007 (6), no state had met the Healthy People 2010 objective to reduce the prevalence of obesity among U.S. adults to 15%. To characterize the most recent trends, CDC used data from the 2009 BRFSS survey to estimate the national and state-specific prevalence of obesity among adults aged ≥18 years.
Methods
BRFSS is an ongoing annual, state-based, random-digit--dialed landline telephone survey of the U.S. civilian, noninstitutionalized adult population. States use BRFSS data to identify and monitor the prevalence of behaviors and health conditions and to develop and evaluate risk prevention initiatives. BRFSS data are weighted for probability of selection to match the age-, race-, and sex-specific populations of participating states and the District of Columbia (DC). Since 1984, BRFSS has asked survey respondents to report their weight and height. All 50 states and DC have contributed these data since 1996. The body mass index (BMI) (weight [kg] / height [m]2) is calculated for each participant, based on self-reported weight and height. Obesity is defined as BMI ≥30. For consistency with previous analyses, respondents reporting weight ≥500 pounds or height ≥7 feet or <3 feet were excluded, and unadjusted prevalence estimates were reported for each state and by selected sociodemographic characteristics. In the 2009 BRFSS survey, Council of American Survey and Research Organizations (CASRO) response rates ranged from 37.9 to 66.9% (median: 52.9%), and cooperation rates ranged from 55.5% to 88.0% (median: 75.0%).† A total of 405,102 persons participated. Prevalence estimates were compared with previously published estimates from the 2000, 2005, and 2007 surveys (6,7). T-tests were used to assess statistical differences in the total prevalence estimates.
Results
The overall estimated prevalence of obesity was 26.7% (95% confidence interval [CI] = 26.4%--27.0%). Obesity prevalence varied substantially by selected characteristics (Table), with the greatest prevalences found among adults aged 50--59 and 60--69 years (31.1% and 30.9%, respectively), non-Hispanic blacks overall (36.8%), non-Hispanic black women (41.9%), Hispanics (30.7%), and residents of the Midwest (28.2%) and South (28.4%). For both men (22.9%) and women (18.6%), obesity prevalence was smallest among those with a college education; overall, prevalence was greatest among those who did not graduate from high school (32.9%), with prevalences of 29.6% among men and 36.4% among women.
The overall prevalence of 26.7% for 2009 is 1.1 percentage points (CI = 0.7--1.5) greater than the 25.6% (CI = 25.3%--25.9%) estimate for 2007 (6) (p<0.001). The 2009 prevalence is 2.8 percentage points greater than the 23.9% (CI = 23.6%--24.1%) estimate for 2005 (p<0.001) and 6.9 percentage points greater than the 19.8% (CI = 19.5%--20.1%) estimate for 2000 (7) (p<0.001).
Among states, the prevalence of adult obesity ranged from 18.6% in Colorado to 34.4% in Mississippi. Only Colorado and DC (19.7%) had prevalences of <20%. A total of 33 states had obesity prevalences of ≥25%; nine of those states (Alabama, Arkansas, Kentucky, Louisiana, Mississippi, Missouri, Oklahoma, Tennessee, and West Virginia) had prevalences of ≥30% (Figure). In contrast, in 2000, 28 states had prevalences of <20%, and no state had a prevalence of ≥30%. In 2005, four states had prevalences of <20%, and three states had prevalences of ≥30%. In 2007, only one state had a prevalence of <20%, and three states had prevalences of ≥30%.
Conclusions and Comment
In 2009, all states continued to have high prevalences of obesity among adults, although the prevalences varied geographically. No state met the Healthy People 2010 target of 15%, and the number of states with obesity prevalence of ≥30% increased from none in 2000 to nine in 2009. The results of this report also indicate that the prevalence of adult obesity in the United States, as measured by BRFSS, continued to increase. Using 2007 population data for both years, the increase of 1.1 percentage points from 2007 to 2009 corresponds to approximately 2.4 million additional adults whose self-reported heights and weights yielded a BMI of ≥30. Previously documented disparities in obesity prevalence continued by age, education, and race/ethnicity (6,7). Of particular concern are the high prevalences among non-Hispanic black women and persons with less education.
BRFSS estimates of obesity prevalence rely on self-reported height and weight, which likely produces underestimates because both men and women tend to overestimate their height and women tend to underestimate their weight (8). The overall 2009 BRFSS obesity prevalence estimate of 26.7% is 7.2 percentage points lower than the national 2007--2008 estimate of 33.9% from NHANES, for which height and weight were measured rather than self-reported (1).
In the BRFSS survey, the prevalence of obesity varied from 18.6% to 34.4% among states, with greater prevalences observed in the South and Midwest. Differences in demographic characteristics associated with obesity, dietary and physical activity behaviors, or environments and policies that affect these behaviors might contribute to the variability. However, the finding that no state met the Healthy People 2010 goal of 15% prevalence, despite the likelihood that state prevalences are underestimated, suggests that past efforts and investments to address the problem have not been sufficient. Thus, efforts need to be intensified.
The problem of obesity is inherently complex, and no single strategy has been determined most effective. As such, the need for a comprehensive approach was stressed recently in The Surgeon General's Vision for a Healthy and Fit Nation 2010§ and the 2010 report of the White House Task Force on Childhood Obesity.¶ These reports highlight the need to 1) address both nutrition and physical activity, 2) work across multiple settings (e.g., medical-care sites, worksites, and communities) and multiple sectors (e.g., industry and government), and 3) change individual behaviors as well as the environments and policies that affect those behaviors. For example, research indicates that environmental and policy supports for physical activity (e.g., access and community design)** and for nutrition (e.g., access to supermarkets) (9) are associated with increased physical activity and improved diet, including greater consumption of fruits and vegetables. A comprehensive approach also should use the best available evidence and should evaluate new strategies.
Based on the best available evidence, persons can support their personal weight goals by following the recommendations of the 2005 Dietary Guidelines for Americans†† and the 2008 Physical Activity Guidelines for Americans.§§ Health-care providers also can help their adult patients address obesity by following recommendations of the U.S. Preventive Services Task Force to screen for obesity and provide intensive counseling to those in need of weight loss.¶¶ BMI measurement is increasingly included in clinical quality measurement and also has been included as a core objective to demonstrate "meaningful use" of electronic medical records, according to the Health Information Technology for Economic and Clinical Health Act.*** Worksites can follow recommendations of the Task Force on Community Preventive Services to implement programs intended to improve diet and physical activity to reduce weight in employees††† and can be supported in their efforts by toolkits such as CDC's LEAN Works!§§§ Communities can address obesity by implementing recommended strategies such as those that increase the availability of affordable healthier food and beverages or create community infrastructures that support physical activity (10). States can help reduce obesity with statewide policies that address nutrition (e.g., increased fruit and vegetable consumption; breastfeeding initiation, duration, and exclusivity; and decreased consumption of high energy-dense foods and sugar-sweetened drinks), physical activity, or clinical services, or by supporting local groups in their efforts.
Intensified nationwide efforts to address obesity will be supported by recent federal initiatives such as the Let's Move! campaign,¶¶¶ Communities Putting Prevention to Work program,**** and the Patient Protection and Affordable Care Act.†††† For example, the Let's Move! campaign facilitates work across multiple sectors to solve the problem of childhood obesity in a generation. Together, these initiatives mobilize public and private resources and partnerships, provide guidance and funding to states and communities to change state and local environments and policies related to diet and physical activity, and help reduce financial barriers to screening.
The findings in this report are subject to at least three limitations. First, BRFSS excludes persons who do not have landline telephones. Adults who live in wireless-only households are more likely to be younger, to be black or Hispanic, and to have lower incomes and no health insurance coverage.§§§§ These differences might affect obesity prevalence estimates. Second, the median CASRO response rate in BRFSS for 2009 was 52.9% and varied by state. The level of nonresponse might lead to bias in the results if respondents overall or by state have different characteristics related to obesity status than nonrespondents. Finally, it is unknown whether the extent of overestimation of height and underestimation of weight has changed over time, which could impact the self-reported trend data in this report.
New and continued national, state, and community-level surveillance of obesity, its behavioral risk factors (e.g., physical inactivity and consumption of sugar-sweetened drinks or high energy-dense foods), and the environments and policies that affect these behaviors is needed to monitor progress in obesity prevention and to target and assess the impact of interventions.
Reported by
B Sherry, PhD, HM Blanck, PhD, DA Galuska, PhD, L Pan, MD, WH Dietz, MD, PhD, Div of Nutrition, Physical Activity, and Obesity, National Center for Chronic Disease Prevention and Health Promotion; L Balluz, ScD, Div of Behavioral Surveillance, Office of Surveillance, Epidemiology, and Laboratory Svcs, CDC.
References
- Flegal KM, Carroll MD, Ogden CL, Curtin LR. Prevalence and trends in obesity among US adults, 1999--2008. JAMA 2010;303:235--41.
- National Heart, Lung, and Blood Institute. Clinical guidelines on the identification, evaluation, and treatment of overweight and obesity in adults: the evidence report. Bethesda, MD: US Department of Health and Human Services, National Institutes of Health, National Heart, Lung, and Blood Institute; 1998. Available at http://www.nhlbi.nih.gov/guidelines/obesity/ob_gdlns.htm. Accessed July 20, 2010.
- US Department of Health and Human Services. The Surgeon General's call to action to prevent and decrease overweight and obesity 2001. Rockville, MD: US Department of Health and Human Services, US Public Health Service, Office of the Surgeon General; 2001. Available at http://www.surgeongeneral.gov/topics/obesity/calltoaction/CalltoAction.pdf. Accessed July 20, 2010.
- Thorpe KE, Florence CS, Howard DH, Joski P. The impact of obesity on rising medical spending. Health Aff 2004;W4:480--6.
- Finkelstein EA, Trogden JG, Cohen JW, Dietz W. Annual medical spending attributable to obesity: payer- and service-specific estimates. Health Aff 2009;28:w822--831.
- CDC. State-specific prevalence of obesity among adults---United States, 2007. MMWR 2008;57:765--8.
- CDC. State-specific prevalence of obesity among adults---United States, 2005. MMWR 2006;55:985--8.
- Merrill RM, Richardson JS. Validity of self-reported height, weight, and body mass index: findings from the National Health and Nutrition Examination Survey, 2001--2006. Prev Chronic Dis 2009;6:A121.
- Larson NI, Story MT, Nelson MC. Neighborhood environments: disparities in access to healthy foods in the U.S. Am J Prev Med 2009;36:74--81.
- CDC. Recommended community strategies and measurements to prevent obesity in the United States. MMWR 2009;58(No. RR-7).
* Objective 19-2. Available at http://www.healthypeople.gov/data.
† Information available at http://www.cdc.gov/brfss/technical_infodata/quality.htm.
§ Available at http://www.surgeongeneral.gov/library/obesityvision/obesityvision2010.pdf.
¶ Available at http://www.letsmove.gov/pdf/TFCO_Table_of_Contents.pdf.
** Information available at http://www.thecommunityguide.org/pa/index.html.
†† Available at http://www.health.gov/dietaryguidelines.
§§ Available at http://www.health.gov/paguidelines.
¶¶ Information available at http://www.ahrq.gov/clinic/pocketgd09/gcp09s2d.htm#obesity.
*** Available at http://edocket.access.gpo.gov/2010/pdf/2010-17207.pdf
††† Information available at http://www.thecommunityguide.org/obesity/workprograms.html.
§§§ Available at http://www.cdc.gov/leanworks.
¶¶¶ Available at http://www.letsmove.gov.
**** Available at http://www.cdc.gov/chronicdisease/recovery/community.htm.
†††† Available at http://frwebgate.access.gpo.gov/cgi-bin/getdoc.cgi?dbname=111_cong_public_laws&docid=f:publ148.111.
§§§§ Information available at http://www.cdc.gov/nchs/data/nhis/earlyrelease/wireless201005.pdf.
|
TABLE. Self-reported prevalence of obesity* among adults, by sex and selected characteristics --- Behavioral Risk Factor Surveillance System, United States, 2009 |
||||||
|---|---|---|---|---|---|---|
|
Overall (N = 405,102) |
Men (n = 158,455) |
Women (n = 246,647) |
||||
|
Characteristic |
% |
(95% CI†) |
% |
(95% CI) |
% |
(95% CI) |
|
Total |
26.7 |
(26.4--27.0) |
27.4 |
(26.9--27.8) |
26.0 |
(25.7--26.4) |
|
Age group (yrs) |
||||||
|
18--29 |
20.3 |
(19.5--21.2) |
20.1 |
(18.8--21.4) |
20.6 |
(19.5--21.7) |
|
30--39 |
27.8 |
(27.1--28.6) |
29.4 |
(28.2--30.7) |
26.2 |
(25.3--27.1) |
|
40--49 |
29.4 |
(28.8--30.1) |
31.0 |
(30.0--32.0) |
27.8 |
(27.0--28.6) |
|
50--59 |
31.1 |
(30.6--31.7) |
31.9 |
(31.1--32.8) |
30.3 |
(29.6--31.0) |
|
60--69 |
30.9 |
(30.3--31.5) |
30.4 |
(29.6--31.3) |
31.3 |
(30.6--32.1) |
|
≥70 |
20.5 |
(20.0--21.0) |
19.8 |
(19.0--20.5) |
21.0 |
(20.4--21.6) |
|
Race/Ethnicity |
||||||
|
White, non-Hispanic |
25.2 |
(24.9--25.5) |
27.1 |
(26.6--27.6) |
23.3 |
(23.0--23.7) |
|
Black, non-Hispanic |
36.8 |
(35.7--37.9) |
30.9 |
(29.2--32.8) |
41.9 |
(40.5--43.2) |
|
Hispanic |
30.7 |
(29.5--31.9) |
30.6 |
(28.7--32.5) |
30.8 |
(29.4--32.2) |
|
Other race |
16.7 |
(15.5--18.0) |
16.9 |
(15.2--18.8) |
16.5 |
(15.0--18.1) |
|
Educational level |
||||||
|
Less than high school graduate |
32.9 |
(31.8--34.0) |
29.6 |
(27.9--31.4) |
36.4 |
(35.1--37.8) |
|
High school graduate |
29.5 |
(29.0--30.1) |
29.5 |
(28.6--30.4) |
29.5 |
(28.9--30.2) |
|
Some college |
29.1 |
(28.6--29.7) |
30.6 |
(29.6--31.5) |
27.9 |
(27.2--28.5) |
|
College graduate |
20.8 |
(20.4--21.2) |
22.9 |
(22.2--23.5) |
18.6 |
(18.2--19.1) |
|
Census region§ |
||||||
|
Northeast |
24.3 |
(23.6--24.9) |
25.2 |
(24.2--26.2) |
23.4 |
(22.6--24.2) |
|
Midwest |
28.2 |
(27.7--28.7) |
29.2 |
(28.4--30.1) |
27.2 |
(26.5--27.9) |
|
South |
28.4 |
(27.9--29.0) |
28.8 |
(28.0--29.7) |
28.1 |
(27.5--28.7) |
|
West |
24.4 |
(23.8--25.0) |
25.1 |
(24.2--26.0) |
23.7 |
(22.9--24.4) |
|
* Body mass index (BMI) ≥30.0; BMI was calculated from self-reported weight and height (weight [kg] / height [m]2). † Confidence interval. § Additional information available at http://www.census.gov. |
||||||
FIGURE. Self-reported prevalence of obesity* among adults --- Behavioral Risk Factor Surveillance System, United States, 2000, 2005, and 2009
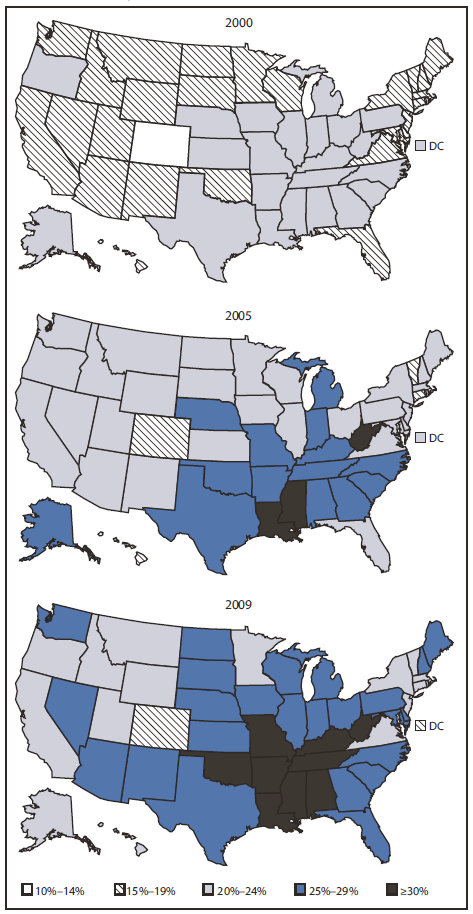
* Body mass index (BMI) ≥30.0; BMI was calculated from self-reported weight and height (weight [kg] / height [m]2).
Alternate text: The Figure above compares the prevalence of state-specific obesity in 2009 with 2005 and 2000. A total of 33 states had obesity prevalences >25% in 2009, and nine of those states had prevalences ≥30%. In contrast, 28 states had prevalences <20% in 2000, and no state had a prevalence of ≥30%.
Use of trade names and commercial sources is for identification only and does not imply endorsement by the U.S. Department of
Health and Human Services. |
All MMWR HTML versions of articles are electronic conversions from typeset documents.
This conversion might result in character translation or format errors in the HTML version.
Users are referred to the electronic PDF version (http://www.cdc.gov/mmwr)
and/or the original MMWR paper copy for printable versions of official text, figures, and tables.
An original paper copy of this issue can be obtained from the Superintendent of Documents, U.S.
Government Printing Office (GPO), Washington, DC 20402-9371;
telephone: (202) 512-1800. Contact GPO for current prices.
**Questions or messages regarding errors in formatting should be addressed to
mmwrq@cdc.gov.
