|
|
|
|
|
|
|
| ||||||||||
|
|
|
|
|
|
|
||||
| ||||||||||
|
|
|
|
|
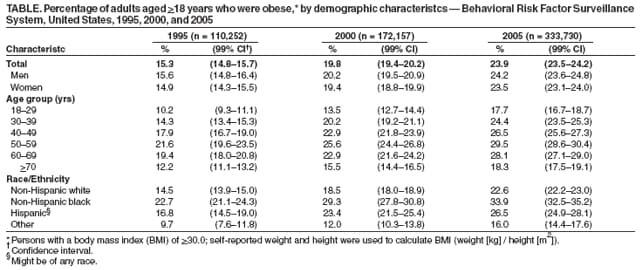
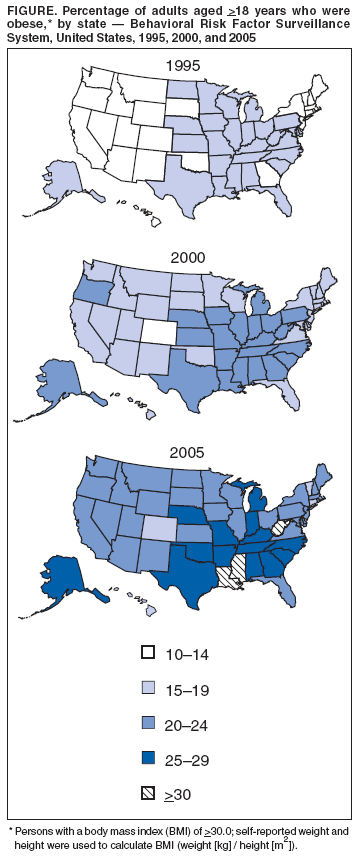
Persons using assistive technology might not be able to fully access information in this file. For assistance, please send e-mail to: mmwrq@cdc.gov. Type 508 Accommodation and the title of the report in the subject line of e-mail. State-Specific Prevalence of Obesity Among Adults --- United States, 2005Obesity, one of the 10 leading U.S. health indicators (1), is associated with increased risk for hypertension, dyslipidemia, type 2 diabetes, coronary heart disease, stroke, and certain cancers (2). A Healthy People 2010 objective is to reduce to 15% the prevalence of obesity among adults in the United States (objective 19-2) (1). Both national-level data from the National Health and Nutrition Examination Survey (NHANES) (3) and state-level data from the Behavioral Risk Factor Surveillance System (BRFSS) (4) indicate that the prevalence of obesity among adults continued to increase during the past decade. In 2003, one study estimated that state-specific, obesity-attributable medical expenditures ranged from $87 million in Wyoming to $7.7 billion in California (5). To assess the prevalence of obesity among adults by state and demographic characteristics since 1995, data were analyzed from the 1995, 2000, and 2005 BRFSS surveys. The results of these analyses indicated that 23.9% of U.S. adults were obese in 2005, and the prevalence of obesity increased during 1995--2005 in all states. To reverse this trend, a sustained and effective public health response is needed, including surveillance, research, policies, and programs directed at improving environmental factors, increasing awareness, and changing behaviors to increase physical activity and decrease calorie intake. BRFSS data are used to track the prevalence of chronic disease risk factors and monitor progress toward state-specific health objectives. BRFSS is an ongoing, state-based, random-digit--dialed telephone survey of the noninstitutionalized, U.S. civilian population aged >18 years. BRFSS data files are weighted to the respondent's probability of being selected and to the age-, race-, and sex-specific populations from the annually adjusted census for each state. In 2005, response rates* among states ranged from 34.6% to 67.4% (median: 51.1%), based on Council of American Survey and Research Organizations (CASRO) guidelines. Cooperation rates† ranged from 58.7% to 85.3% (median: 75.1%). In 1995 and 2000, median CASRO response rates were 68.4% and 48.9%, and median cooperation rates were 71.3% and 53.2%, respectively. Self-reported weight and height were used to calculate body mass index (BMI) (weight [kg] / height [m2]). Overweight was classified as BMI >25.0, obesity as BMI >30.0, and extreme (class III) obesity as BMI >40.0 kg/m2. To be consistent with previous analyses (4), data were excluded if a respondent's weight was >500 lbs or height was >7.0 ft. In 2005, among the total U.S. adult population surveyed, 60.5% were overweight, 23.9% were obese, and 3.0% were extremely obese. Obesity prevalence was 24.2% among men and 23.5% among women and ranged from 17.7% among adults aged 18--29 years to 29.5% among adults aged 50--59 years (Table). Among racial/ethnic populations, the greatest obesity prevalence was 33.9% for non-Hispanic blacks. Overall, age-adjusted obesity rates were 15.6%, 19.8%, and 23.7% for the 1995, 2000, and 2005 surveys, respectively. Among states in 2005, obesity prevalences ranged from 17.4% to 30.3%, and prevalence of extreme obesity ranged from 1.8% to 5.3%. During 1995--2005, obesity prevalence increased significantly (p<0.01) in all states. During 1995--2000, the number of states with obesity prevalence <20% declined from 50 states to 28 states (Figure). In 2005, four states (Colorado, Connecticut, Hawaii, and Vermont) still had obesity prevalences <20%, but 17 states had prevalences >25%, including three (Louisiana, Mississippi, and West Virginia) with prevalences >30% (Figure). Reported by: HM Blanck, PhD, WH Dietz, MD, PhD, DA Galuska, PhD, C Gillespie, MS, R Hamre, MPH, L Kettel Khan, PhD, MK Serdula, MD, Div of Nutrition and Physical Activity; ES Ford, MD, WS Garvin, AH Mokdad, PhD, Div of Adult and Community Health, National Center for Chronic Disease Prevention and Health Promotion; D Densmore, PhD, EIS Officer, CDC. Editorial Note:The findings in this report indicate that state-level prevalences of obesity in adults, based on self-reported weight and height, increased significantly during 1995--2005, moving states farther away from the Healthy People 2010 target of 15% prevalence of obesity. According to the surgeon general's Call to Action to Prevent and Decrease Overweight and Obesity (6), for obesity prevention and control to be successful, changes that promote recognition of obesity as a public health threat and assist persons in balancing healthful eating with regular physical activity must be made at multiple levels (i.e., individual, family, community, state, and nation) and across multiple sectors (i.e., education, government, and business). The Task Force on Community Preventive Services has identified evidence-based strategies to reduce weight and increase physical activity. For example, seven worksite interventions with both nutrition and physical activity components (e.g., nutrition education, physical activity "prescription," and behavioral skills development and training) were effective, resulting in average weight losses of 4.4--26.4 lbs during a minimum 6-month period (7). In addition, the Guide to Preventive Community Services§ recommends informational, behavioral, social, environmental, and policy approaches to increase physical activity, including school-based physical education and creation of, or enhanced access to, locales for physical activity in the community. The findings in this report are subject to at least two limitations. First, BRFSS data rely on self-reported weight and height. Study participants, especially in telephone surveys, tend to underreport their weight, overreport their height, or both, leading to underestimation of obesity prevalence (8). According to NHANES, for which measured weight and height are used for an adult sample aged >20 years, the prevalence of obesity among U.S. adults overall was 32.2% during 2003--2004 (3), approximately one third greater than the 23.9% prevalence reported in the 2005 BRFSS survey. Second, persons who use only cellular telephones or are without land-line telephones are not included in BRFSS surveys. Persons with no telephone might be of lower socioeconomic status (9), a factor associated with obesity (10); exclusion of these persons might result in underreporting of obesity prevalence. Multiple CDC programs address prevention of obesity through nutrition and physical activity. Specifically, CDC's Nutrition and Physical Activity Program to Prevent Obesity and Other Chronic Diseases works collaboratively with state health departments to implement and evaluate interventions to increase physical activity and improve nutrition. The Steps to a HealthierUS program established by the U.S. Department of Health and Human Services in 2003 and overseen by CDC provides funding to 40 communities nationwide to use evidence-based strategies to prevent and reduce the burden of obesity. CDC's Coordinated School Health Program works through state education and health agencies to improve nutrition and increase physical activity in schools. The continued increase in obesity prevalence underscores the need for additional measures to educate and motivate persons to make healthier choices and to establish social and physical environments that support those choices. To reduce obesity in the United States, an effective public health response will require a robust combination of policies, programs, and supportive environments created through the combined activities of health-care agencies, government, media, business and industry, communities, schools, families, and individuals. In addition, monitoring and evaluation systems are needed to ensure effectiveness of both new and existing interventions and to validate their widening use. Acknowledgment The findings in this report are based, in part, on data provided by BRFSS state coordinators. References
* The percentage of persons who completed interviews among all eligible persons, including those who were not successfully contacted. † The percentage of persons who completed interviews among all eligible persons who were contacted. § Available at http://www.thecommunityguide.org/pa.
Table
Disclaimer All MMWR HTML versions of articles are electronic conversions from ASCII text into HTML. This conversion may have resulted in character translation or format errors in the HTML version. Users should not rely on this HTML document, but are referred to the electronic PDF version and/or the original MMWR paper copy for the official text, figures, and tables. An original paper copy of this issue can be obtained from the Superintendent of Documents, U.S. Government Printing Office (GPO), Washington, DC 20402-9371; telephone: (202) 512-1800. Contact GPO for current prices. **Questions or messages regarding errors in formatting should be addressed to mmwrq@cdc.gov.Date last reviewed: 9/14/2006 |
|||||||||
|