|
|
|
|
|
|
|
| ||||||||||
|
|
|
|
|
|
|
||||
| ||||||||||
|
|
|
|
|
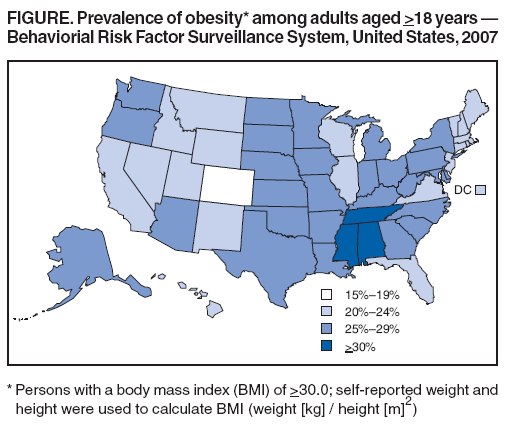
Persons using assistive technology might not be able to fully access information in this file. For assistance, please send e-mail to: mmwrq@cdc.gov. Type 508 Accommodation and the title of the report in the subject line of e-mail. State-Specific Prevalence of Obesity Among Adults --- United States, 2007Obesity is associated with reduced quality of life, development of serious chronic conditions such as heart disease and diabetes, increased medical care costs, and premature death (1,2). A Healthy People 2010 objective is to reduce to 15% the proportion of adults who are obese (3). In 2005, no state met this target, and (based on self-reported height and weight) 23.9% of adults in the United States were obese (4). To update 2005 estimates of the prevalence of obesity in adults, CDC analyzed data from the 2007 Behavioral Risk Factor Surveillance System (BRFSS) survey. The results of that analysis indicated that 25.6% of respondents overall in 2007 were obese; the prevalence of obesity among adults remained above 15% in all states and was above 30% in Alabama, Mississippi, and Tennessee. Enhanced collaborative efforts among national, state, and community groups are needed to establish, evaluate, and sustain effective programs and policies to reduce the prevalence of obesity in the United States. BRFSS is an ongoing, state-based, random-digit--dialed telephone survey of the noninstitutionalized U.S. civilian population aged >18 years. Survey data are used to monitor progress in achieving health objectives at the state level and in selected metropolitan statistical areas.* Data are weighted to the respondents' probabilities of being selected and to the age-, race-, and sex-specific populations from each state's annually adjusted census. In the 2007 BRFSS survey, Council of American Survey and Research Organizations (CASRO) response rates† among states ranged from 26.9% to 65.4% (median: 50.6%), and cooperation rates§ ranged from 49.6% to 84.6% (median: 72.1%). Body mass index (BMI) (weight [kg] / height [m]2) was calculated from self-reported weight and height at the time of the survey. Obesity was defined as a BMI >30.0. (1). To maintain consistency with previous analyses (4,5), respondents with self-reported weight >500 pounds or height >7 feet were excluded. In the 2007 BRFSS survey, 25.6% of respondents overall were obese. Obesity prevalence was 26.4% for men and 24.8% for women (Table). By age group, obesity prevalence ranged from 19.1% for men and women aged 18--29 years to 31.7% and 30.2%, respectively, for men and women aged 50--59 years. By race/ethnicity and sex, obesity prevalence was highest for non-Hispanic black women (39.0%) followed by non-Hispanic black men (32.1%). By education level, for men, obesity prevalence was lowest among college graduates (22.1%) and highest among those with some college (29.5%) and a high school diploma (29.1%). For women, obesity prevalence was lowest among college graduates (17.9%) and highest among those with less than a high school diploma (32.6%). By region, the prevalence of obesity was higher in the South (27.3%) and Midwest (26.5%) and lower in the Northeast (24.4%) and West (23.1%) (Table). State-specific obesity prevalence ranged from 18.7% to 32.0% and was <20% in only one state: Colorado (18.7%) (Figure). Obesity prevalence was >30% in three states: Alabama (30.3%), Mississippi (32.0%), and Tennessee (30.1%). No state met the Healthy People 2010 target of 15%, and 30 states had obesity prevalence >25%. Reported by: DA Galuska, PhD, C Gillespie, MS, SA Kuester, MS, Div of Nutrition, Physical Activity, and Obesity, AH Mokdad, PhD, Div of Adult and Community Health, ME Cogswell, DrPH, Div of Birth Defects and Developmental Disabilities, National Center for Chronic Disease Prevention and Health Promotion; CM Philip, MD, EIS Officer, CDC. Editorial Note:The findings in this report indicate that, in 2007, none of the 50 states nor the District of Columbia had reached the Healthy People 2010 target for obesity prevalence among adults aged >18 years. The 25.6% prevalence of obesity among respondents overall in the 2007 BRFSS survey represents an increase of 1.7 percentage points from the 23.9% prevalence in 2005. In 2000, the prevalence was 19.8%, and in 1995 the prevalence was 15.3% (4). State and national data indicating that obesity prevalence has continued to increase during much of the past two decades (4--7) underscore the public health challenge presented by obesity. Of further concern are the disparities in prevalence of obesity, particularly among racial/ethnic populations and by education level. These disparities might reflect differences in knowledge and behavior related to diet and physical activity. They also might reflect differences in environmental supports for these behaviors, such as access to places for physical activity (e.g., local parks or recreation facilities) or access to healthier food options (e.g., selection at local groceries). To reach the Healthy People 2010 target, increased national attention to actions that promote healthy eating and physical activity is essential. In the Surgeon General's 2001 Call to Action to Prevent and Decrease Overweight and Obesity (2), 15 activities were identified as national priorities for immediate action; many focus on increased access to healthy food choices and safe physical activity in settings such as worksites, communities, and schools. The report also called for collaboration across multiple sectors (i.e., education, government, and business) and levels (i.e., individual, family, community, state, and national) to address the problem of obesity. CDC conducts obesity prevention programs and activities with a wide range of partners, including state and local health and education departments and communities across the country.¶ For example, as part of CDC's Nutrition and Physical Activity Program to Prevent Obesity and Other Chronic Diseases, the state of Washington implemented a community intervention that promotes environmental and policy changes to help encourage healthful nutrition and physical activity. Changes included widening sidewalks, connecting systems of paths for pedestrians and bicyclists, and creating community gardens. Examples of other approaches were highlighted in a meeting of representatives from 25 community programs, held July 10--11, 2008, at CDC. Examples included increasing access to healthier foods through farmer's markets, community gardens, and local groceries; altering roads and sidewalks to make them safer and more accessible to pedestrians and bicyclists; creating or enhancing access to physical activity through parks, trails, or community fitness trails; and creating social support for physical activity through walking clubs. CDC also works with employers and worksite health experts to translate evidence-based recommendations from the Task Force on Community Preventive Services (8) on worksite interventions for preventing obesity into business practices. This collaboration will produce a return-on-investment calculator to assist businesses in making the case for initiation and maintenance of wellness programs, especially those that promote weight management. In addition, an interactive website will provide guidance for the creation, expansion, or customization of worksite obesity programs. Efforts to help address obesity in the health-care setting also are occuring. For example, the National Committee for Quality Assurance recently approved inclusion of BMI assessment for adults as a Health Plan Employer Data and Information Set (HEDIS) measure. This assessment should help prompt health-care providers to provide appropriate counseling regarding diet and physical activity to their patients. The findings in this report are subject to at least two limitations. First, BRFSS data depend on self-reported height and weight, and obesity prevalence is likely underestimated because survey participants tend to overstate their height and understate their weight, or both (9). Second, persons without landline telephones are excluded from BRFSS, which might affect obesity estimates. Persons without landline telephones, including those who use only cellular telephones, might be younger or of lower socioeconomic status (10). Expansion of multidisciplinary, cross-sector collaborations and partnerships that seek to improve nutrition and physical activity in settings such as schools, workplaces, and communities will be an important strategy to reduce obesity prevalence in the United States. Priority should be given to interventions that move beyond increasing individual awareness and provide the environmental and policy changes that support behavior change, particularly among those with the greatest need. Acknowledgment The findings in this report are based, in part, on data provided by BRFSS state coordinators. References
* Additional information is available at http://www.cdc.gov/brfss/smart. † The percentage of persons who completed interviews among all eligible persons, including those who were not successfully contacted. Rates are available at http://www.cdc.gov/brfss/technical_infodata/surveydata/2006/dqrhandbook_06.rtf. § The percentage of persons who completed interviews among all eligible persons who were contacted. ¶ Additional information regarding these programs is available at http://www.cdc.gov/nccdphp/dnpa/obesity/state_programs/funded_states/index.htm; http://www.cdc.gov/healthyyouth/partners/funded/cshp.htm; and http://www.cdc.gov/steps.
Table
All MMWR HTML versions of articles are electronic conversions from typeset documents. This conversion might result in character translation or format errors in the HTML version. Users are referred to the electronic PDF version (http://www.cdc.gov/mmwr) and/or the original MMWR paper copy for printable versions of official text, figures, and tables. An original paper copy of this issue can be obtained from the Superintendent of Documents, U.S. Government Printing Office (GPO), Washington, DC 20402-9371; telephone: (202) 512-1800. Contact GPO for current prices. **Questions or messages regarding errors in formatting should be addressed to mmwrq@cdc.gov.Date last reviewed: 7/17/2008 |
|||||||||
|
![TABLE. Prevalence of obesity* among adults aged >18 years, by sex and selected characteristics — Behavioral Risk Factor
Surveillance System, United States, 2007
Total (N = 404,300) Men (n = 155,525) Women (n = 248,775)
Characteristic % (99% CI†) % (99% CI) % (99% CI)
Total 25.6 (25.2–26.0) 26.4 (25.8–27.1) 24.8 (24.4–25.3)
Age group (yrs)
18–29 19.1 (18.0–20.3) 19.1 (17.4–21.0) 19.1 (17.9–20.5)
30–39 26.5 (25.5–27.5) 28.2 (26.6–29.8) 24.8 (23.7–26.0)
40–49 27.8 (27.0–28.6) 29.4 (28.1–30.7) 26.1 (25.1–27.2)
50–59 30.9 (30.1–31.8) 31.7 (30.4–33.0) 30.2 (29.1–31.2)
60–69 29.9 (29.1–30.8) 30.1 (28.7–31.5) 29.8 (28.8–30.9)
>70 19.4 (18.7–20.1) 18.5 (17.4–19.7) 20.0 (19.2–20.9)
Race/Ethnicity
White, non-Hispanic 24.5 (24.2–24.9) 26.3 (25.7–26.9) 22.9 (22.4–23.3)
Black, non-Hispanic 35.8 (34.4–37.2) 32.1 (29.7–34.6) 39.0 (37.4–40.6)
Hispanic§ 28.5 (26.7–30.4) 28.3 (25.5–31.2) 28.8 (26.7–31.0)
Other 15.3 (13.8–16.9) 16.2 (13.9–18.8) 14.1 (12.5–15.9)
Educational level
Less than high school diploma 29.4 (27.9–30.9) 26.4 (24.2–28.8) 32.6 (30.7–34.5)
High school diploma 28.8 (28.0–29.5) 29.1 (27.9–30.3) 28.5 (27.6–29.3)
Some college 27.8 (27.0–28.6) 29.5 (28.1–30.9) 26.3 (25.5–27.2)
College graduate 20.0 (19.5–20.6) 22.1 (21.2–23.0) 17.9 (17.2–18.5)
Census region
Northeast 24.4 (23.6–25.3) 25.7 (24.3–27.1) 23.3 (22.3–24.3)
Midwest 26.5 (25.8–27.2) 27.6 (26.5–28.7) 25.3 (24.5–26.2)
South 27.3 (26.7–27.8) 27.5 (26.7–28.4) 27.0 (26.4–27.6)
West 23.1 (22.0–24.3) 24.1 (22.3–26.0) 22.1 (20.8–23.4)
*Persons with a body mass index (BMI) of >30.0; self-reported weight and height were used to calculate BMI (weight [kg] / height [m]2).
†Confidence interval.
§Might be of any race.](figures/m728a1t.gif)