CDC Environmental Health Nexus Newsletter
Healthy Environment, Healthy You
April 22, 2022 | Volume 9

Environmental News Nexus
The Centers for Disease Control and Prevention’s (CDC) Environmental Health Nexus (EH Nexus) shares environmental health messages with the public and gives special attention to environmental justice concerns.
EH Nexus newsletters provide information about environmental health issues and promote actions to help save lives. The newsletters communicate how to reduce harm from many threats, including climate change, contaminated food and water, toxic environments, and inadequate systems and practices.
This issue covers the following topics to help you prepare for extreme heat:
- U.S. Summers are Hot, and Cities are Getting Even Hotter
- Extreme Heat can Take a Toll on Cities
- Why do we Care About Urban Heat Islands?
- Act Fast and Prepare Yourself for Extreme Heat
- People at Increased Risk from Extreme Heat
- What is Being Done to Address Extreme Heat and Urban Heat Islands?
- Urban Heat Island Mapping Campaign
- What are the Next Steps?
- Additional Environmental Resources
If the newsletter was emailed to you, we thank you for joining our subscription distribution list. To become a subscriber, please click here, enter your email address, and click the subscribe button.
U.S. Summers are Hot, and Cities are Getting Even Hotter
Extreme heat events in the United States are expected to become more common, more severe, and longer lasting as our climate changes. The 4th National Climate Assessmentexternal icon projects that U.S. heat waves will become more frequent and more intense.
As temperatures continue to rise, it is important that you identify steps that you can take now to prepare for an extreme heat event pdf icon[PDF – 8.6 MB].
Extreme Heat can Take a Toll on Cities
We all expect it to be warm in the summer, but sometimes the heat can be severe or even dangerous. A series of unusually hot days is referred to as an extreme heat event.
Extreme heat conditions are defined as weather that is much hotter than average for a certain time and place — and sometimes more humid, too. Extreme heat is not just annoying, it kills hundreds of U.S. residents every year and causes many more to become seriously ill.
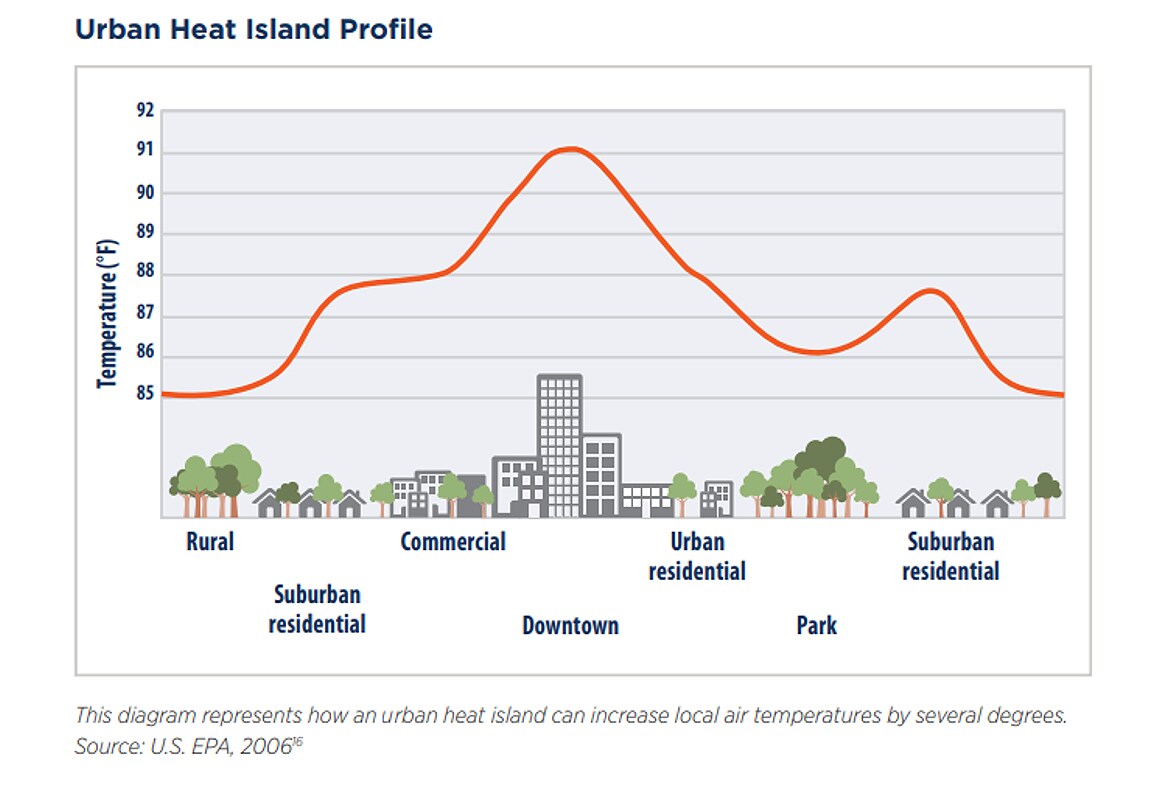
Cities tend to get much warmer than their surrounding rural landscapes, particularly during the summer. This is known as the urban heat islandexternal icon effect. This temperature difference occurs when the unshaded roads and buildings in cities gain heat during the day and radiate that heat into the surrounding air. As a result, highly developed urban areas can experience mid-afternoon temperatures that are 15°F to 20°F warmer than surrounding, vegetated areas.
Temperatures are usually cooler at night, giving your body some relief from hot daytime temperatures. But during an extreme heat event, which typically lasts more than one day, nighttime temperatures might stay too warm to allow your body to cool down, especially if you live in an urban heat island.
People who reside in lower income neighborhoods are affected more due to the lack of greenery and other cooling infrastructure that provide shade during the day. A nationwide studyexternal icon found that neighborhoods exposed to historical redliningexternal icon, typically lack green spaces and suffer most from having urban heat islands. The study found that 94% of redlined areas, which remain mostly lower income communities of color, are exposed to higher temperatures than are non-redlined, affluent communities. Reducing harmful environmental exposures can improve population health and may contribute to decreases in health disparities.
Why Do We Care About Urban Heat Islands?
Elevated temperatures with urban heat islands affect a community’s quality of life and can adversely affect natural and built environments. These adverse effects include the following:
- Compromised human health and comfort
- Increased risk for respiratory illnesses, heat exhaustion, heat stroke, and heat-related death
- Increased energy consumption to air condition homes and buildings, which leads to increased emissions of air pollutants and heat-trapping gases
People at Increased Risk from Extreme Heat
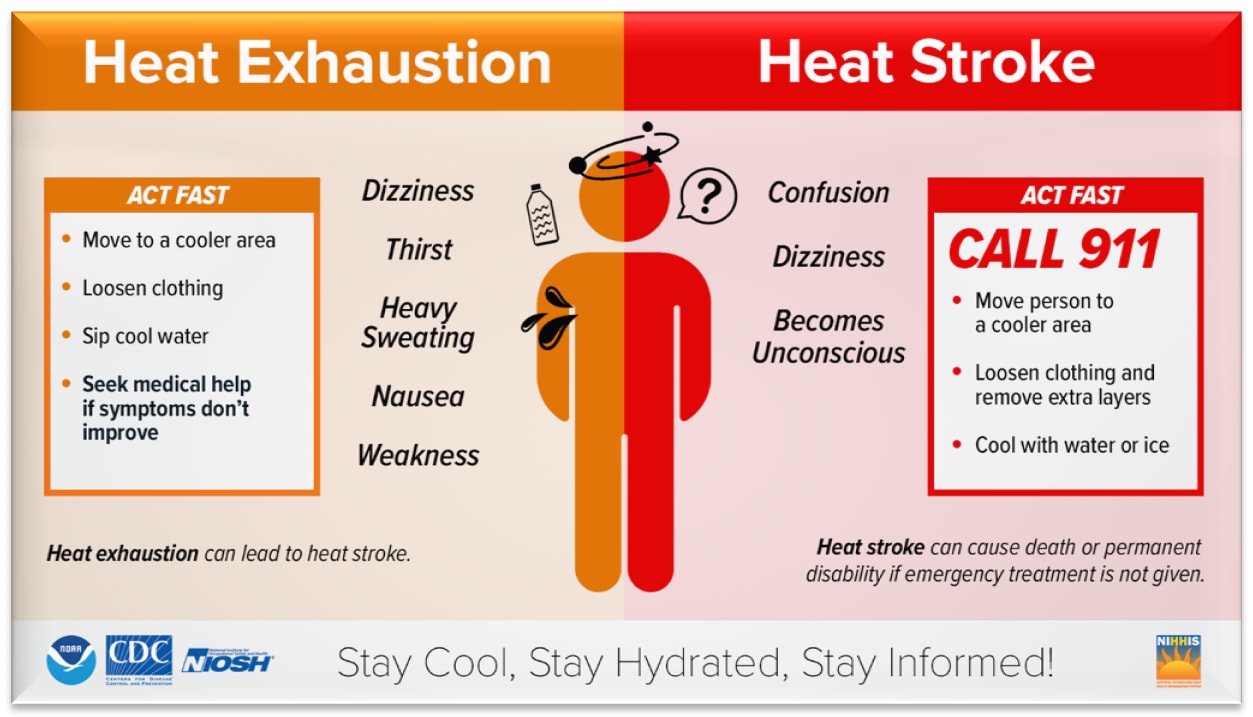
Extreme temperatures associated with heat waves can make everyone uncomfortable. When combined with conditions such as high humidity, sun exposure, stagnant air, and poor air quality, high temperatures compromise the body’s ability to regulate temperature and can result in a surge of illnesses, including heat cramps, heat exhaustion, heatstroke, and hyperthermia.
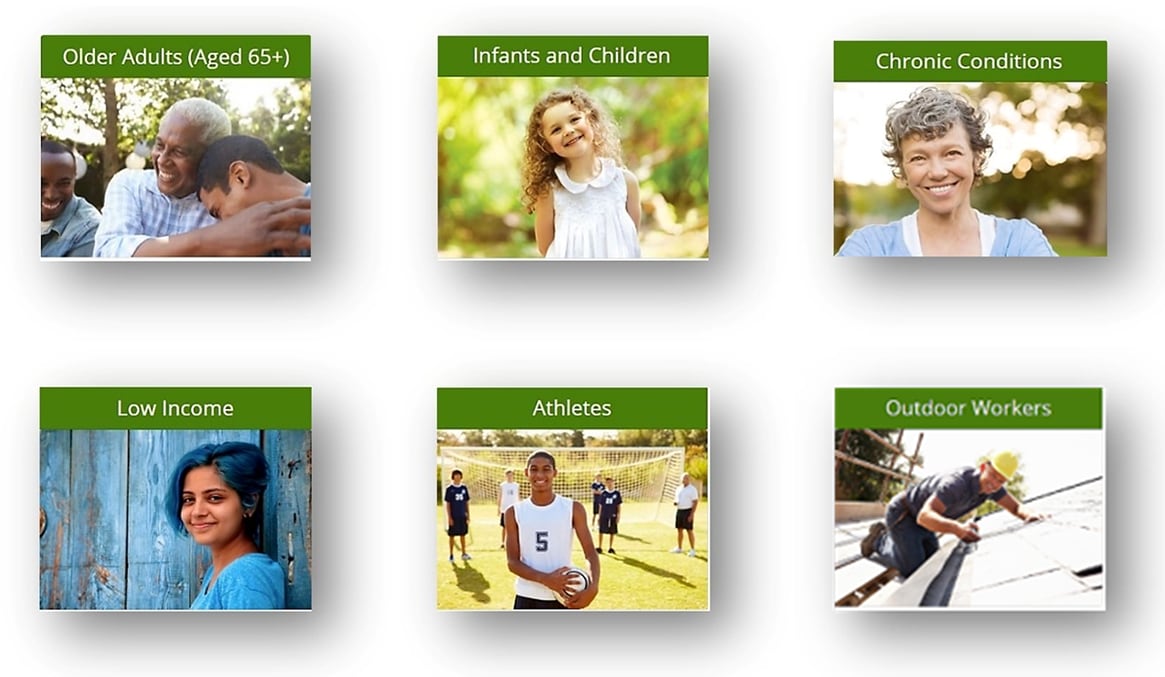
Some groups face a greater risk for heat-related illness than others. For instance, outdoor workers and athletes might be at greater risk than are office workers because they have increased exposure to heat.
Identifying specific factors that increase risk for some populations gives us a way to reduce exposure and vulnerability through adaptive actions. In some cases, simply increasing awareness of the risks that extreme heat poses to health can encourage people to take adaptive actions, such as going indoors or getting to a cooling center.
Emergency responders put themselves in danger repeatedly in the line of duty, and heat waves further add to that danger. Police officers, firefighters, paramedics, and others who protect people during heat waves need information to understand how to find and help those who are most disproportionately affected, while ensuring they are protected themselves.
To support and help protect emergency responders, the Federal Emergency Management Agency, the U.S. Fire Administration, and the International Association of Fire Fighters developed the Emergency Incident Rehabilitation report pdf icon[PDF – 5.6 MB]external icon to inform decision makers of heat exposures that firefighters and other emergency responders face.
What is Being Done to Address Extreme Heat and Urban Heat Islands?
The National Integrated Heat Health Information System (NIHHISexternal icon) provides actionable, science-based information to help decision makers reduce exposure and manage their risks.
The program brings together researchers, experts from federal agencies, and local decision makers across disciplines (health care providers, emergency managers, city planners, and energy utilities) to use the best-available science to reduce health risks resulting from extreme heat.
To learn where action is needed to protect populations with an increased risk now and, in the future, NIHHIS and partners launched new community-led campaigns that map the hottest parts of citiesexternal icon.
Urban Heat Island Mapping Campaign
Over the past 5 years, NOAA has funded a program of over 35 community-led campaignsexternal icon to map urban heat islands. Using heat sensors mounted on their own cars or bikes, volunteer citizen scientists, led by a team of local partners in each city, traversed their neighborhoods in the morning, afternoon, and evening on one of the hottest days of the year. The sensors record temperature, humidity, time, and the volunteers’ location every second. The urban heat island mapping program includes sensor technology, analysis and modeling, and community engagement. It allows communities to develop hyper-local descriptions of heat and strategize mitigation options specific to each region of the United States.
The final product of the campaigns is a set of high-resolution air temperature and humidity data, and a report that provides a detailed analysis of distribution of heat in the morning, afternoon, and evening.
The goals of these mapping projects include the following:
- Establishing the spatial pattern of heat vulnerability across the city to inform climate adaptation and resilience initiatives
- Raising awareness and informing the public about heat-related risks and heat vulnerability
- Coordinating a strong network of academic, municipal, and community partners to advance urban heat island-related research and policy
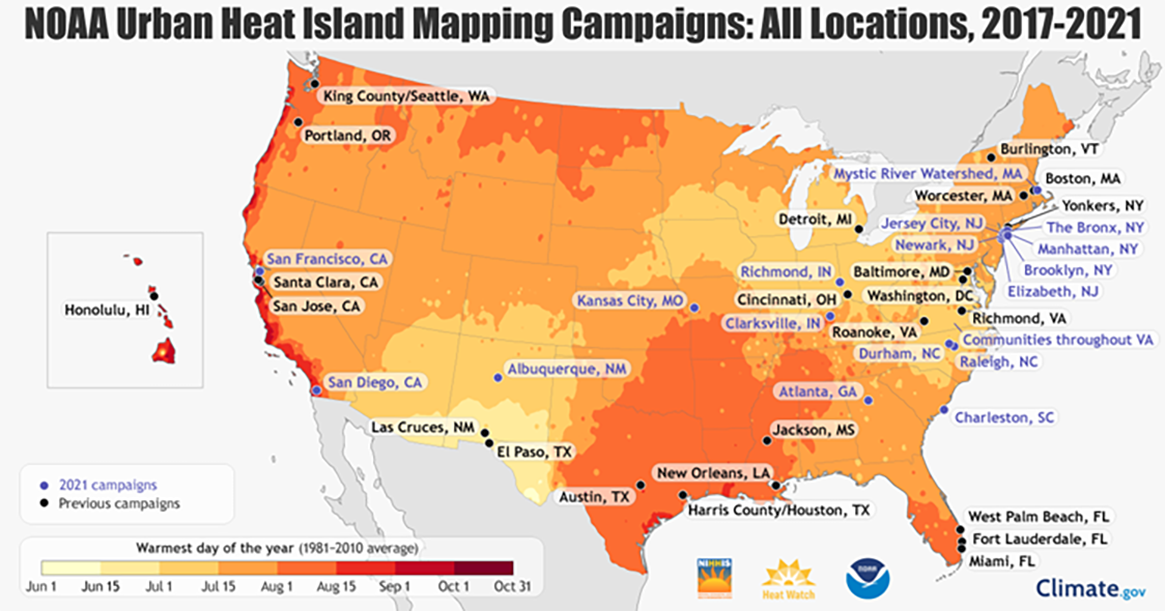
2017 - 2021 NOAA Urban Heat Island Mapping Campaigns
2017-2020 Previous Campaign Cities: Austin (TX), Cincinnati (OH), Boston (MA), Burlington (VT), Detroit (MI), El Paso (TX), Fort Lauderdale (FL), King County/the City of Seattle (WA), Honolulu (HI), Houston/Harris County (TX), Jackson (MS), New Orleans (LA), Portland (OR), West Palm Beach (FL), Worcester (MA), Yonkers (NY)
2021 Campaign Cities: Albuquerque (NM), Atlanta (GA), Bronx/Manhattan (NY), Brooklyn (NY), Charleston (SC), Clarksville (IN), Jersey City/Elizabeth/Newark (NJ), Kansas City (MO), Mystic River Watershed (MA), Raleigh/Durham (NC), San Diego (CA), San Francisco (CA), Richmond (IN), and communities throughout Virginia
What are the Next Steps?
The information gathered from urban heat campaigns can be used to inform city governments, health departments, city planners, first responders, and others about how the city’s heat distribution affects populations and infrastructure. The data can be paired with social vulnerability variables to develop a heat vulnerability index to further understand the needs of communities.
These maps and reports can serve to educate stakeholders and start conversations about ways to adapt to heat and plan for mitigation strategies. The benefit of these would help
- Determine where cooling centers would be viable
- Visualize where strategies such as cool roofs and green spaces would be beneficial
Additional Environmental Resources
- Learn about the NIHHIS program: https://nihhis.cpo.noaa.gov/external icon
- Extreme heat vulnerability map tool: https://nihhis.cpo.noaa.gov/vulnerability-mappingexternal icon
- Learn more about extreme heat and climate change: https://www.cdc.gov/climateandhealth/effects/temperature_extremes.htm
- CDC planning guide: https://www.cdc.gov/climateandhealth/docs/Health_Impacts_Climate_Change-508_final.pdf pdf icon[PDF – 2.8 MB]
- CDC Heat and Health Tracker: https://ephtracking.cdc.gov/Applications/heatTracker/
- Climate and health resources: https://www.cdc.gov/climateandhealth/site_resources.htm
- Extreme heat guidance: https://www.cdc.gov/disasters/extremeheat/index.html
- Learn more about the campaigns: https://nihhis.cpo.noaa.gov/Urban-Heat-Island-Mappingexternal icon
Thank you for reading. Do not keep this great resource to yourself! Please share it with your colleagues and networks.
If you are not yet a subscriber, please click here, enter your email address, and click the subscribe button at the bottom of the webpage.
