COVID-19 Science Update released: October 23, 2020 Edition 59

The COVID-19 Science Update summarizes new and emerging scientific data for public health professionals to meet the challenges of this fast-moving pandemic. Weekly, staff from the CDC COVID-19 Response and the CDC Library systematically review literature in the WHO COVID-19 databaseexternal icon, and select publications and preprints for public health priority topics in the CDC Science Agenda for COVID-19 and CDC COVID-19 Response Health Equity Strategy.
Here you can find all previous COVID-19 Science Updates.
The October 12, 2020, issue of JAMA had a sobering series of research papers and commentaries describing the extensive costs of the COVID-19 pandemic in the US, summarized by the JAMA editor-in-chief in Bauchner et alexternal icon. These costs come in many forms–economic, excess deaths, mental health, and ever-increasing health disparities for racial minorities and individuals in lower socioeconomic strata. These issues are explored in the following three article summaries and in the COVID-19 and Health Disparities segment of the In Brief section below.
The COVID-19 pandemic and the $16 trillion virusexternal icon. Cutler & Summers. JAMA (October 12, 2020).
Key findings:
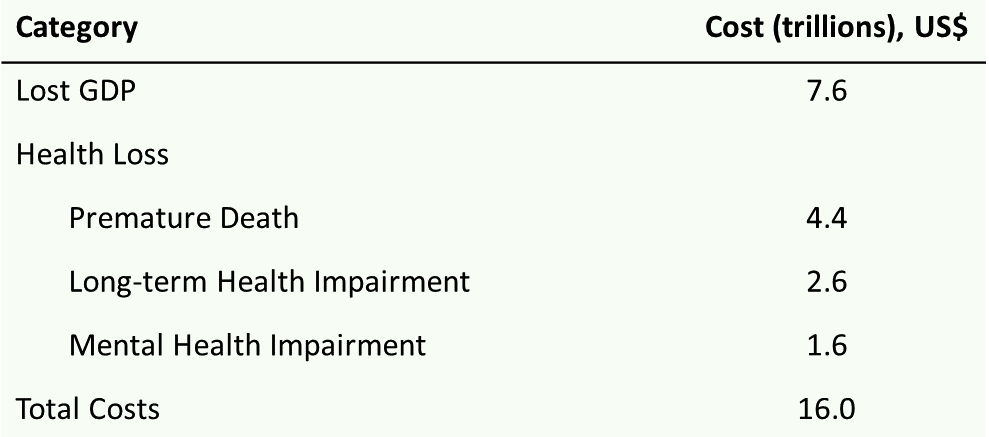
- Total economic cost of US pandemic through Fall, 2021 estimated at $16 trillion or 90% of the gross domestic product (GDP).
- Cumulative deaths estimated at 625,000 yielding $4.4 trillion in losses for premature death.
- Losses from long-term COVID-19 complications estimated at $2.6 trillion.
- Losses for mental health symptoms estimated at $1.6 trillion.
- Lost economic output estimated at $7.6 trillion over 20 years.
- Lost income from COVID-19-induced recession accounts for 50% of total losses.
- The economic return on investment of a SARS-CoV-2 testing and contact tracing program was estimated at 30 times the cost.
Methods: Viewpoint describing aggregated costs for direct economic losses combined with mortality, morbidity, and mental health costs related to COVID-19 to estimate the economic burden of the pandemic in the US through Fall of 2021. Assumes a $7 million value for a statistical life, and that the pandemic will be substantially contained by Fall, 2021. Limitations: Costs for additional public health measures to reach containment in 2021 not incorporated.
Figure:
Note: Adapted from Cutler & Summers. Estimated cost of the COVID-19 crisis in the US through Fall 2021. GDP, gross domestic product. Cost estimates rounded. Reproduced with permission from JAMA. Cutler & Summers, The COVID-19 pandemic and the $16 trillion virus. DOI:10.1001/jama.2020.19759. October 12, 2020. Copyright© 2020 American Medical Association. All rights reserved.
Excess deaths from COVID-19 and other causes, March–July 2020.external icon Woolf et al. JAMA (October 12, 2020).
Key findings:
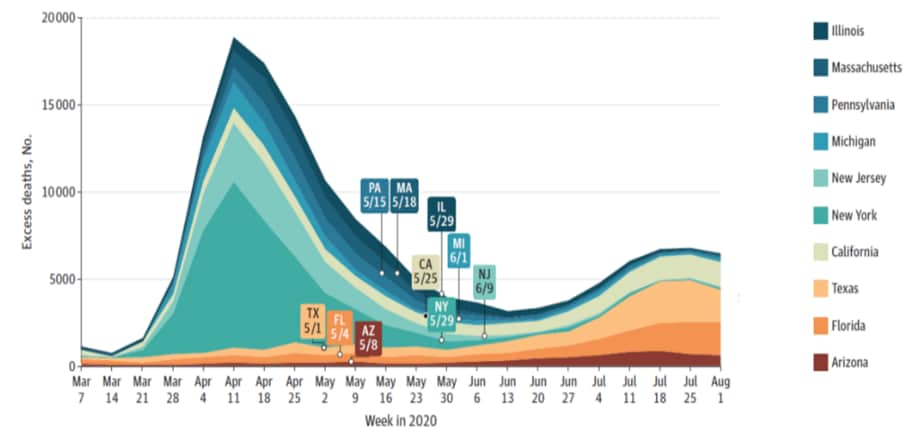
- Between March 1 and August 1, 2020, 1,336, 561 deaths occurred in the US, a 20% increase over expected deaths based on death data from the National Center for Health Statistics (Figure).
- 150,541 (67%) of excess deaths were attributed to COVID-19.
- The annual percentage change in deaths due to heart disease and Alzheimer disease/dementia were statistically significant for multiple weeks of the analysis frame.
Methods: Death data for 2014–2020 and population counts for the 48 states and the District of Columbia (US Census Bureau) were used to estimate expected deaths; Connecticut and North Carolina were excluded due to missing data. COVID-19 deaths were those in which COVID-19 was cited as an underlying or contributing cause. Limitations: Reliance on preliminary data; inaccuracies and incomplete death certificate data.
Figure:
Note: from Woolf et al. Weekly excess deaths for the 10 states with the largest number of excess deaths from March to July, 2020. Dates refer to the lifting of broad COVID-19 restrictions, as reported by the New York Times. Reproduced with permission from JAMA. Woolf et al., Excess deaths from COVID-19 and other causes, March–July 2020. DOI: 10.1001/jama.2020.19545. October 12, 2020. Copyright© 2020 American Medical Association. All rights reserved.
COVID-19 and excess all-cause mortality in the US and 18 comparison countries.external icon Bilinksi et al. JAMA (October 12, 2020).
Key findings:
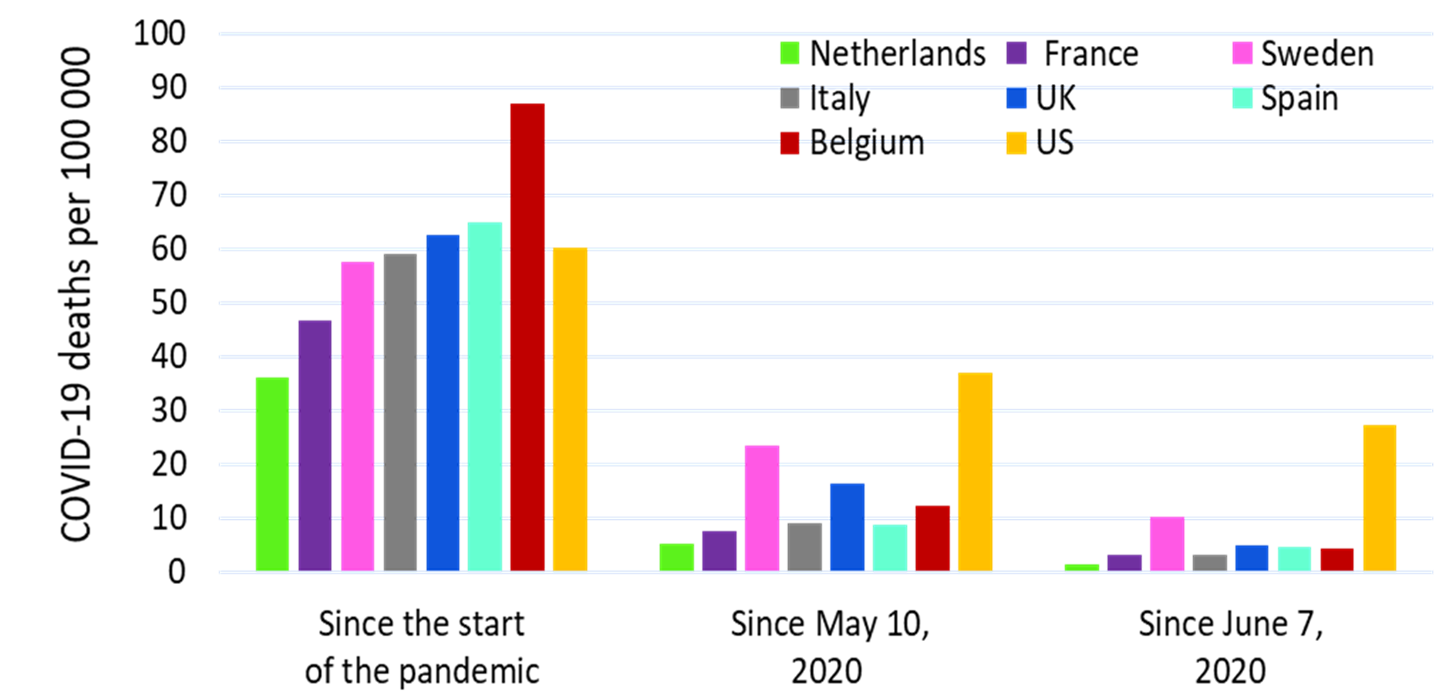
- Compared with other countries, the US experienced high COVID-19–associated mortality and excess all-cause mortality into September 2020 (Figure).
- The US had lower COVID-19 mortality rates than other high mortality countries in early Spring, but higher mortality rates after May 10, 2020.
- As of September 2020, the United States had similar COVID-19 mortality rates (60.3 per 100,000) as other high mortality countries (36.2–86.8 per 100,000).
Methods: Comparison of the US with countries of population >5 million and a gross domestic product >$25,000 per capita. COVID-19 and all-cause mortality was grouped into different mortality rate strata. Differences in COVID-19 related deaths between the US and other countries were calculated on three different mortality rate scenarios. Limitations: Does not control for differences in mortality risk such as age and comorbidities.
Figure:
Note: Adapted from Bilinski et al. COVID-19 Mortality in the US Compared with that of other countries. Data on COVID-19 deaths from February 13 to September 19, 2020 (n = 198,589 US deaths). All mortality rates are statistically significantly different from the corresponding US mortality rates (p <0.001). Reproduced with permission from JAMA. Bilinski et al., COVID-19 and excess all-cause mortality in the US and 18 comparison countries. DOI:10.1001/jama.2020.20717. October 12, 2020. Copyright© 2020 American Medical Association. All rights reserved.
Implications for 3 articles (Cutler & Summers, Woolf, et al., & Bilinski et al.): The economic burden of the COVID-19 pandemic in the US is immense and poses the greatest threat to economic prosperity and well-being since the Great Depression. The US has experienced a higher COVID-19 specific and all-cause mortality rate than other countries through September 2020; Fineberg et alexternal icon provide insight into cause of death determination and the importance of contributing factors for mortality. Policies that can reduce the spread of COVID-19, such as testing and contact tracing, can have enormous economic and health value.
Barriers and facilitators of adherence to social distancing recommendations during COVID-19 among a large international sample of adults. external iconCoroiu et al. PLOS One (October 7, 2020).
Key findings:
- Top motivating factors for social distancing in an online survey of 2,013 adults were:
- Self-protection (84%).
- Protecting others (84%).
- Closure of restaurants, community and recreation centers (94%).
- Top barriers to social distancing were:
- Seeing people out on street (31%).
- Having to run errands for family and friends (25%).
- Mistrust in the government (13%).
- Feeling stressed when alone or in isolation (13%).
- Women and older adults were more likely to adhere to social distancing measures in several adjusted regression analyses than men and younger individuals.
Methods: Online survey of English-speaking adults primarily living in North America and Europe conducted between March 30 and April 16, 2020. Limitations: Convenience sample; respondents not representative of the population (84% of female; >70% with a bachelor’s degree).
Implications: Measures to improve adherence to social distancing should appeal to individuals’ motivations for social distancing, target men and young adults, and be accompanied by institutional restrictions on high risk social congregate settings (restaurants, community and recreation centers).
Who complies with COVID-19 transmission behavioral mitigation guidelines?external icon Nofal et al. PLOS One (October 8, 2020).
Key findings:
- Conscientiousness, openness to experience, and agreeableness positively predicted self-reported adherence to behaviors that mitigate SARS-CoV-2 transmission.
- Of traits tested, conscientiousness was the strongest predictor.
- Extraversion was negatively related to adherence to SARS-CoV-2 transmission mitigation behaviors.
Methods: Anonymous online survey of 11,342 Japanese citizens from March 26 to March 28, 2020. Quota sampling used to match final sample (n = 8,548) to Japanese population on age, gender, and employment. Survey included personality assessment and questions about behaviors that mitigate spread of SARS-CoV-2. Relationship between personality factors and SARS-CoV-2 mitigation behaviors was assessed. Limitations: All data were self-reported.
Implications: Understanding how individual factors influence behavior holds potential to inform and increase the reach of COVID-19 messaging campaigns.
PEER-REVIEWED
COVID-19 in New Zealand and the impact of the national response: A descriptive epidemiological studyexternal icon. Jefferies et al. Lancet Public Health (October 13, 2020).
Key findings:
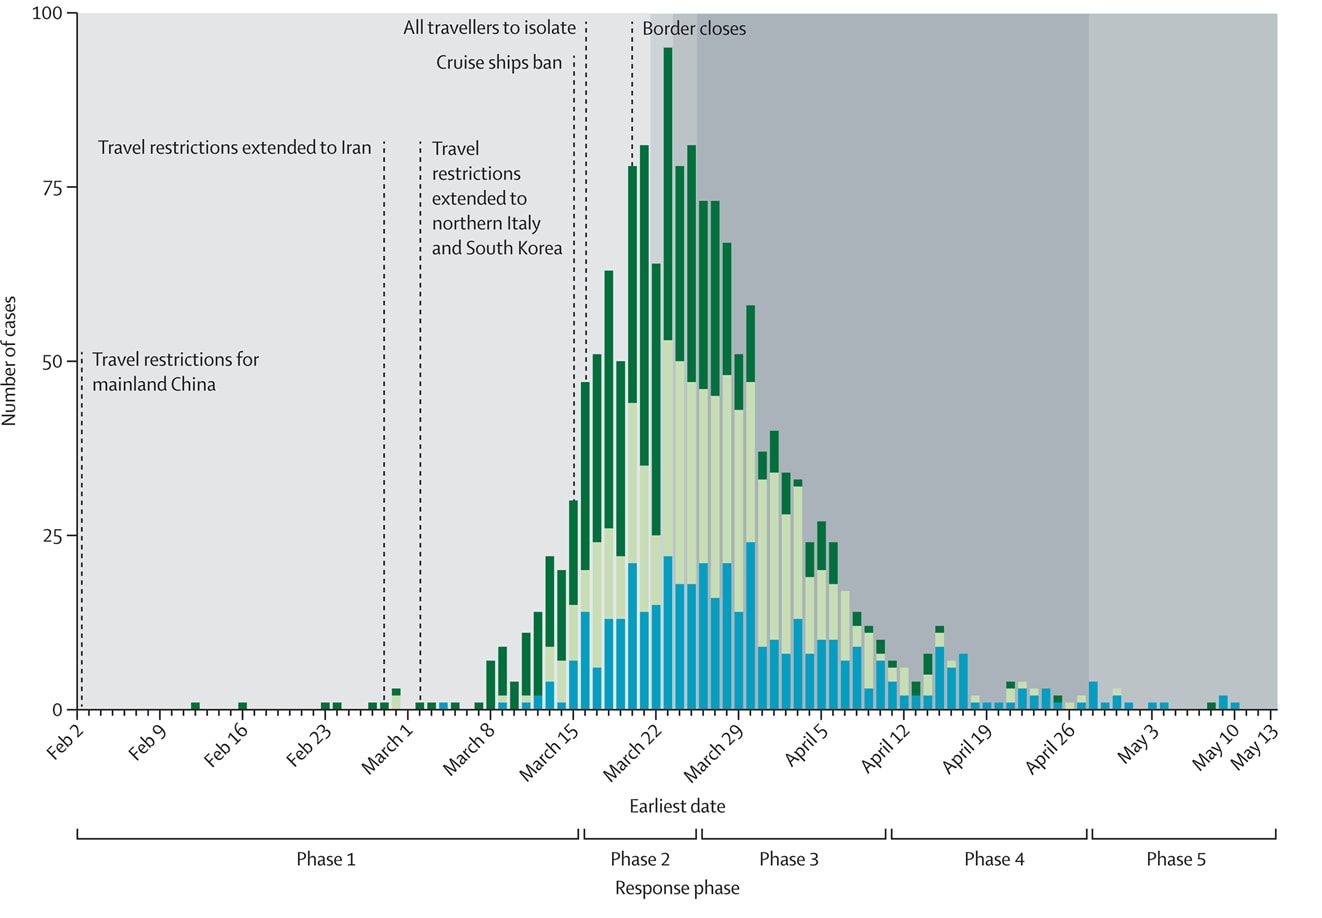
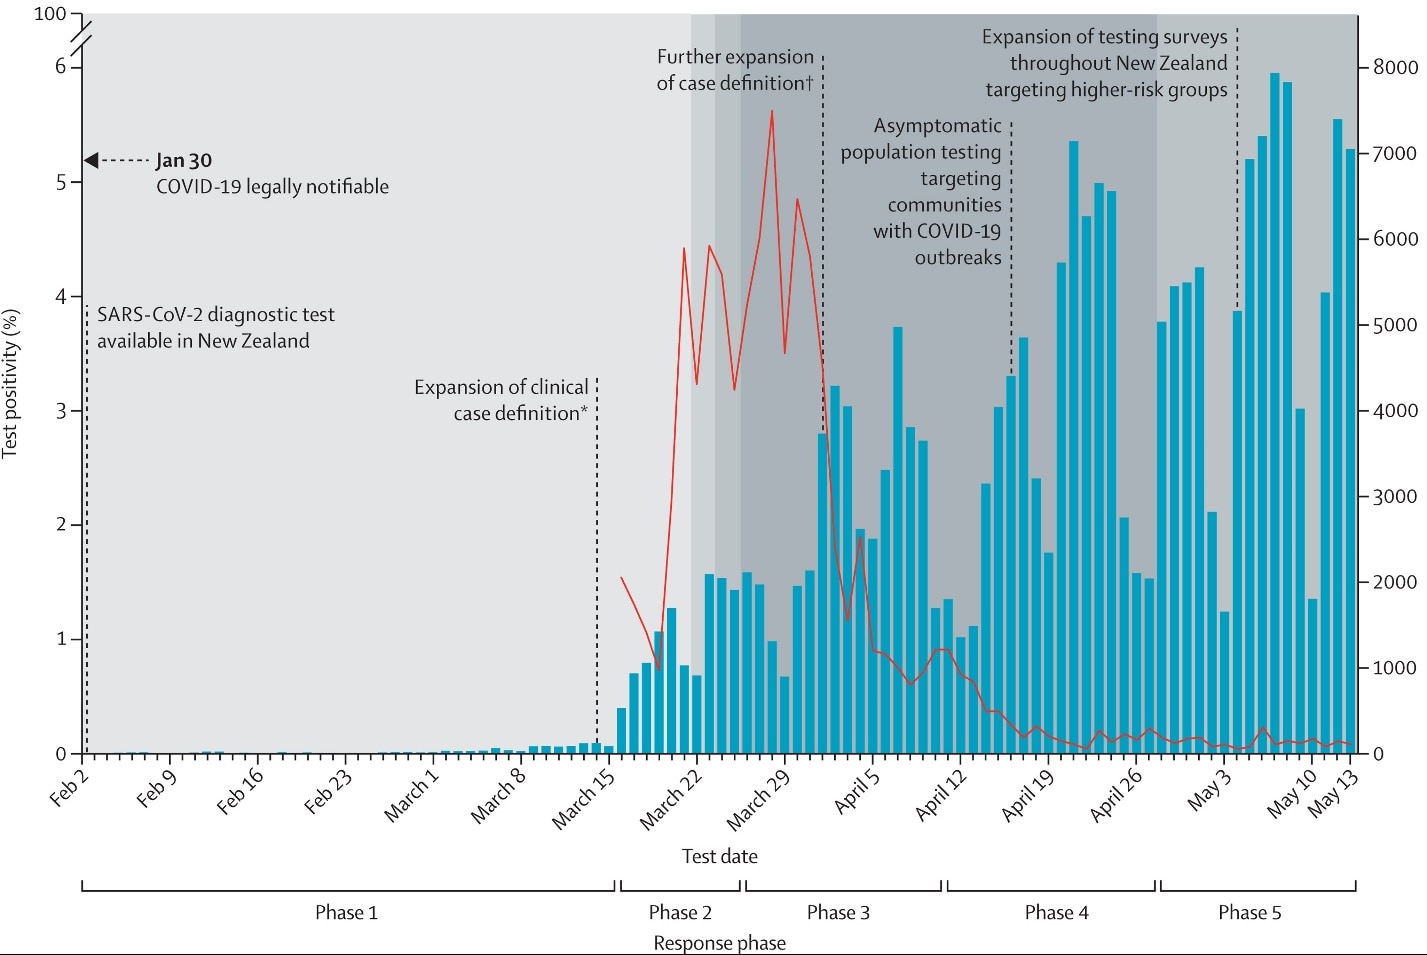
- The estimated case infection rate per million people per day peaked at 8.5 (95% CI 7.6-9.4) between March 16 and March 25, 2020 and progressively declined to 0.5 per million per day (95% CI 0.4-0.7) when the most stringent non-pharmaceutical interventions (NPI) were enforced (Figure 1 & 2).
- 1,034 cases (69% of total) were imported or import-related and this proportion declined from Phase 3 onward (Figure 1).
- Severe outcomes (hospitalization or death) were associated with:
- Locally acquired infection (OR 2.32, 95% CI 1.4-3.8) compared with imported infection.
- Older age, adjusted OR (aOR) 2.72 (95% CI 1.4-5.3) for 50─64-year-olds and 8.25 (95% CI 2.6-26.3 for people aged ≥80 years compared with 20─34-year-olds.
- Residing in an aged residential care facility (aOR 2.9, 95% CI 1.6-9.4).
- Pacific peoples (aOR 2.76, 95% CI 1.1-6.7) and Asian (aOR 2.15, 95% CI 1.1-4.2) ethnicities compared with European or other.
Methods: A descriptive epidemiological study of 1,503 confirmed and probable COVID-19 cases from February 2 to May 13, 2020 in New Zealand. Demographic features and disease outcomes, transmission patterns, time-to-event intervals, and testing coverage over five phases of the national response. Limitations: Impact of individual NPIs could not be measured due to rapid and concomitant implementation of these measures.
Implications: New Zealand’s ability to limit the burden of COVID-19 has potential implications for island states and potentially other high-income countries with similar resources, political will, and population compliance. Robertexternal icon et al. highlight the importance of detailed epidemiological linkage data to aid in identifying transmission chains and targeting surveillance to settings with high risk of transmission.
Figure 1
Note: Adapted from Jefferies et al. Epidemic curve of confirmed and probable COVID-19 cases in New Zealand by source of infection (imported cases, import-related cases, and locally acquired cases) and major NPIs. Travel restriction start dates are highlighted. Licensed under CC BY-NC-ND.
Figure 2
Note: Adapted from Jefferies et al. Molecular testing counts (y-axis) and daily test positivity (x-axis). *Case definition expanded to include non-febrile presentations of acute respiratory infection, and testing of asymptomatic household contacts was added to contact tracing. †Removal of epidemiological criteria (travel to COVID-19-affected areas or close contact with a case) as a requirement (with clinical presentations) and expanded clinical criteria. Licensed under CC BY-NC-ND.
The household secondary attack rate of SARS-CoV-2: A rapid reviewexternal icon. Fung et al. Clinical Infectious Diseases (October 12, 2020).
Key findings:
- Pooled estimates of household secondary attack rate for SARS-CoV-2 was 17.1% (95% CI 13.7%-21.2%) with significant heterogeneity (I2, p<0.0001).
- The secondary attack rate ranged from 3.9%–36.4%.
- Studies that tested contacts more frequently generated larger SARs; random-effects estimates stratified by testing frequency:
- 1 test, 9.2% (95% CI 6.7%-12.3%).
- 2 tests, 17.5% (95% CI 13.9%-21.8%).
- >2 tests, 21.3% (95% CI 13.8%-31.3%).
- Household secondary attack was higher among adult contacts and contacts of symptomatic cases.
Methods: A systematic review and meta-analysis of 22 published and pre-published, non-peer reviewed studies from 10 countries of 20,000 household contacts through September 2020. Subgroup analyses were conducted using meta-regression to estimate secondary attack rate by contact characteristics and frequency of testing contacts, geographic region, and peer-review status. Limitations: Only one database of published studies was searched; authors did not account for household clustering; limited data on index cases who were young children.
Implications: Secondary attack rate reporting using one-time testing may underestimate number of cases among household contacts. More frequent testing of household contacts may increase yield of secondary cases.
PREPRINT (NOT PEER-REVIEWED)
Long-term COVID-19 symptoms in a large unselected population.external icon Cirulli et al. medRxiv (October 11, 2020).
Key findings:
- 42.3% of patients with mild COVID-19 and a positive SARS-CoV-2 test (n = 233) had ≥1 symptom for 30 days or longer.
- 33.8% and 24.1% reported ≥1 symptom for 60 and 90 days, respectively.
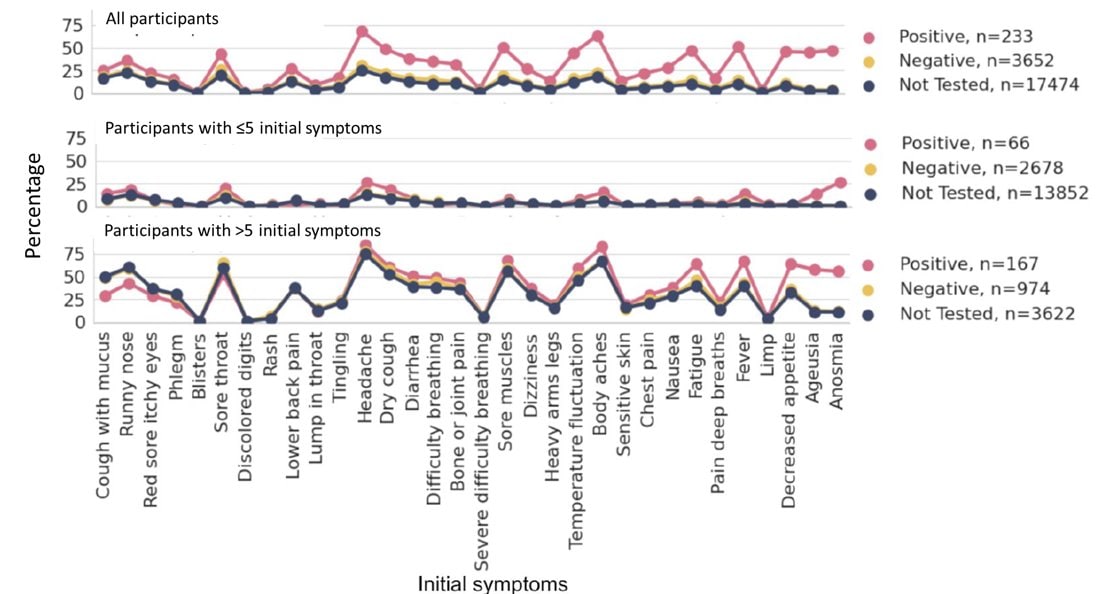
- When controlling for number of symptoms, a positive SARS-CoV-2 test was predictive of loss of smell and taste, memory loss, and headache lasting for at least 30 days (Figure).
- These associations held true at 60 days and for all except of memory loss, at 90 days.
- Total number of initial symptoms (p <0.0001) and an initial symptom of labored breathing (p <0.0001) were predictive of reported symptoms lasting ≥30 days.
Methods: Longitudinal online surveys of 21,359 individuals in Nevada on COVID-19 test results, symptoms, comorbidities, and “long-term” (>30 days) symptoms administered every 4 to 6 weeks from April to September 2020. Limitations: Small sample size; self-reported data; sample may not be representative.
Implications: Long-term COVID-19 sequelae are common and should be noted within the extended burden of COVID-19 when considering health and economic consequences.
Figure:
Note: Adapted from Cirulli et al. Participants divided by number of initial symptoms. Lines depict proportion of those positive, negative, and untested for SARS-CoV-2 who showed the symptom for at least 30 days. Symptoms ordered left to right by relative strength of relationship with SARS-CoV-2 test result, with symptoms on the right being more likely in positive patients than in negative. Licensed under CC-BY-NC 4.0.
PEER-REVIEWED
The impact of mask-wearing and shelter-in-place on COVID-19 outbreaks in the United Statesexternal icon. Zhang et al. International Journal of Infectious Diseases (October 8, 2020).
Key findings:
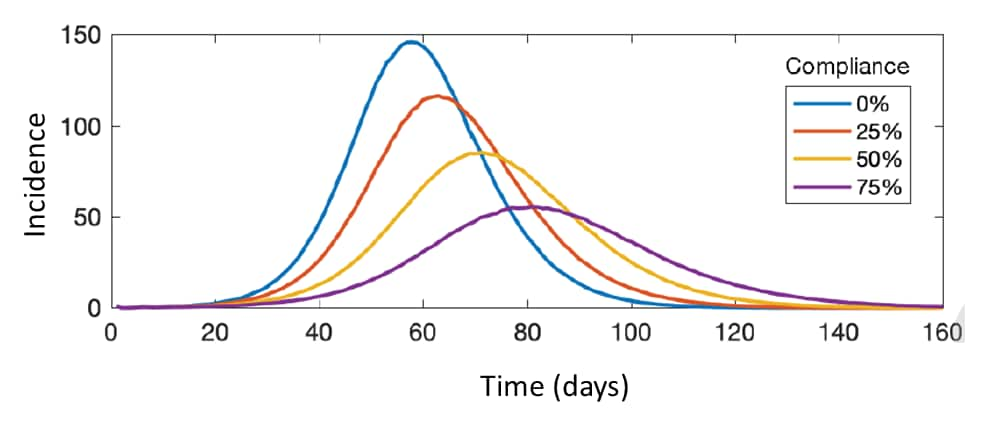
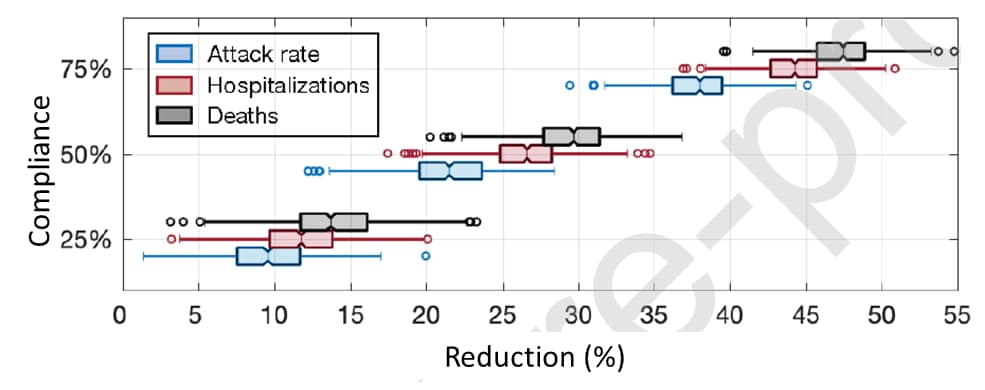
- Face mask-wearing by 75% of the US population, in absence of other control measures, flattened the projected incidence curve and reduced:
- Infections by 37% (IQR 36.1%–39.4%) (Figure 1).
- Hospitalizations by 44.2% (IQR 42.9%–45.8%) (Figure 2).
- Deaths by 47.2% (IQR 45.5%–48.7%) (Figure 2).
- The combination of face mask-wearing and targeted shelter-in-place for those aged 50–64 was the most efficient strategy, decreasing attack rate, hospitalizations, and deaths by over 82%.
- Identifying at least 33% of pre-symptomatic and asymptomatic infections can achieve epidemic control when there is 75% face mask-wearing and implementation of targeted shelter-in-place.
Methods: Transmission model to look at effects of face mask wearing, shelter-in-place, and case isolation on the SARS-CoV-2 attack rate and outcomes in the US. Limitations: Assumption of 20% mask efficacy may be conservative; limited sensitivity analyses; population immunity assumption of 5% may not reflect waning immunity.
Implications: Face mask-wearing alone, even non-medical grade masks, could have a substantial impact on outbreak control. When combined with targeted shelter-in-place recommendations and with testing and contact tracing efforts, epidemic control could be achievable.
Figure 1
Note: Adapted from Zhang et al. Projected incidence of COVID-19 infections per 10,000 population at 0%, 25%, 50%, and 75% of mask-wearing compliance and with 5% level of pre-existing immunity. Licensed under CC BY-NC-ND.
Figure 2
Note: Adapted from Zhang et al. Modeling reduction of attack rate, hospitalizations, and deaths at different levels of mask-wearing compliance, compared to no mask-wearing, in the absence of shelter-in-place strategies. Licensed under CC BY-NC-ND.
PEER-REVIEWED
Remdesivir targets a structurally analogous region of the Ebola virus and SARS-CoV-2 polymerases.external icon Lo et al. Proceedings of the National Academy of Sciences (October 7, 2020).
Key findings:
- A single amino acid substitution, F584S, in the Ebola virus (EBOV) polymerase conferred reduced susceptibility to remdesivir (Figure).
- This region of the F584S mutation in EBOV maps to a similar functional region within the SARS-CoV-2 polymerase.
Methods: Ebola virus was serially passaged in vitro under remdesivir selection or under mock drug pressure to induce potential mutations. Virus sensitivity to remdesivir after 35 passages was determined. Limitations: Study performed in EBOV and may not be directly applicable to SARS-CoV-2.
Implications: Because genome-wide mapping shows homology between the Ebola virus and coronavirus polymerase active sites, molecular surveillance of remdesivir-treated COVID-19 patients to identify any potential genetic mutations that may decrease susceptibility towards antiviral therapies may be warranted.
Figure:
Note: Adapted from Lo et al. Fluorescence micrographs of Wild-type EBOV or EBOV F584S-mutated-infected cells treated with serial dilutions of remdesivir or control. Concentrations of remdesivir are indicated below the micrographs. DMSO used as control. Licensed under CC BY 4.0.
COVID-19 and Health Disparities
- Macmadu et al. COVID-19 and mass incarceration: A call for urgent action.external icon The number of COVID-19 cases is 5.5x higher among people who are incarcerated (approximately 2.3 million people in the US) compared with the general population. Decreasing the size of the prison population would reduce the number of persons at risk and help flatten the curve.
- Cooper et al. Excess deaths from COVID-19, community bereavement, and restorative justice for communities of color.external icon The American Public Media Research Lab reported that about 19,500 Black, 8,400 Latino, 600 Indigenous, and 70 Pacific Islander individuals in the US would still be alive if these groups had died of COVID-19 at the same rate as White US residents. This burden compounds the already existing lower life span for many of these groups, which this article explores.
- Simon et al. Mental health disorders related to COVID-19–related deathsexternal icon. JAMA. A second wave of COVID-19 in the fall will result in mental health and substance abuse crises that may disproportionately affect Black and Hispanic individuals, older adults, lower socioeconomic groups, and health care workers. Early screening is needed to prevent prolonged grief, major depressive disorder, or posttraumatic stress disorder.
- Nuzzo et al. Suboptimal US response to COVID-19 despite robust capabilities and resources.external icon Details the lapses in US federal leadership that resulted in a failure to mobilize the country’s substantial capacity and emphasizes the importance of national-level reviews to understand gaps that led to a suboptimal response.
- Schmidt et al. Is it lawful and ethical to prioritize racial minorities for COVID-19 vaccines?external icon Several agencies — including WHO and the National Academy of Sciences, Engineering, and Medicine — have warned that a “colorblind” allocation of limited vaccine would perpetuate disparities. This viewpoint lays out the ethical and legal case for prioritizing racial and ethnic minorities for SARS-CoV-2 vaccination in the US.
- Nelson et al. “Physical sex is over for now”: Impact of COVID-19 on the well-being and sexual health of adolescent sexual minority males in the U.S.external icon US Journal of Adolescent Health. The COVID-19 pandemic and physical distancing measures reduced social connectedness and changed sexual behaviors of adolescent sexual minority males and could further increase health disparities in this population.
Blood Group and COVID-19
- Barnkob et al. Reduced prevalence of SARS-CoV-2 infection in ABO blood group Oexternal icon. Blood Advances. Blood group O is associated with a decreased risk for contracting SARS-CoV-2 infection.
- The Severe COVID-19 GWAS Working Group. Genomewide association study of severe COVID-19 with respiratory failureexternal icon. A blood-group-specific analysis showed a higher risk for severe COVID-19 in blood group A than in other blood groups.
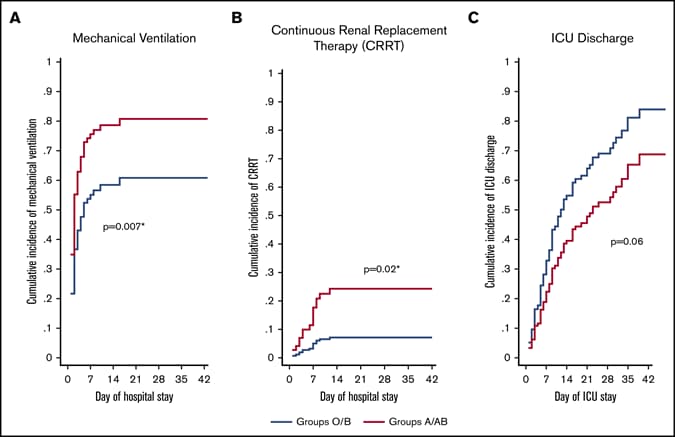
- Hoiland et al. The association of ABO blood group with indices of disease severity and multiorgan dysfunction in COVID-19external icon. Blood Advances. COVID-19 patients with blood group A or AB are at increased risk for mechanical ventilation and appear to have more severe disease than patients with blood group O or B.
Figure:
Note: from Hoiland et al. Impact of ABO blood group type on mechanical ventilation (A), continuous renal replacement therapy (B) and Day of ICU discharge (C) for COVID-19 patients. Republished with permission of American Society of Hematology, from The association of ABO blood group with indices of disease severity and multiorgan dysfunction in COVID-19, Hoiland et al. 2020; permission conveyed through Copyright Clearance Center, Inc.
Other
- Burki, T. China’s successful control of COVID-19external icon. Lancet Infectious Diseases. While two-thirds of Americans believe China has done poorly in dealing with the Pandemic, WHO views it as a success story.
Disclaimer: The purpose of the CDC COVID-19 Science Update is to share public health articles with public health agencies and departments for informational and educational purposes. Materials listed in this Science Update are selected to provide awareness of relevant public health literature. A material’s inclusion and the material itself provided here in full or in part, does not necessarily represent the views of the U.S. Department of Health and Human Services or the CDC, nor does it necessarily imply endorsement of methods or findings. While much of the COVID-19 literature is open access or otherwise freely available, it is the responsibility of the third-party user to determine whether any intellectual property rights govern the use of materials in this Science Update prior to use or distribution. Findings are based on research available at the time of this publication and may be subject to change.

