COVID-19 Science Update released: October 20, 2020 Edition 58

The COVID-19 Science Update summarizes new and emerging scientific data for public health professionals to meet the challenges of this fast-moving pandemic. Weekly, staff from the CDC COVID-19 Response and the CDC Library systematically review literature in the WHO COVID-19 databaseexternal icon, and select publications and preprints for public health priority topics in the CDC Science Agenda for COVID-19 and CDC COVID-19 Response Health Equity Strategy.
Here you can find all previous COVID-19 Science Updates.
Understanding the immune response to SARS-CoV-2 infection is important to comprehend factors that may play a role in mitigating the epidemic such as whether persons develop lasting immunity after recovery from infection and the optimal vaccine-induced immunity to provide adequate protection. Additionally, understanding the timing of antibody response and neutralizing activity can help direct optimal timing for convalescent plasma donation. Here we present three papers evaluating the magnitude, duration, and predictors of IgG, IgM, IgA, and neutralizing antibody responses to SARS-CoV-2.
PEER-REVIEWED
Persistence and decay of human antibody responses to the receptor binding domain of SARS-CoV-2 spike protein in COVID-19 patients.external icon Iyer et al. Science immunology (October 8, 2020).
Key findings:
- IgA and IgM antibodies to the SARS-CoV-2 receptor-binding domain (RBD) of the spike protein were short-lived.
- Median time to seroreversion (return to seronegative) was 70.5 (95% CI 58.5-87.5) and 48.9 days (95% CI 43.8-55.6), respectively.
- IgG responses were maintained with only 4% seroreversion within 90 days.
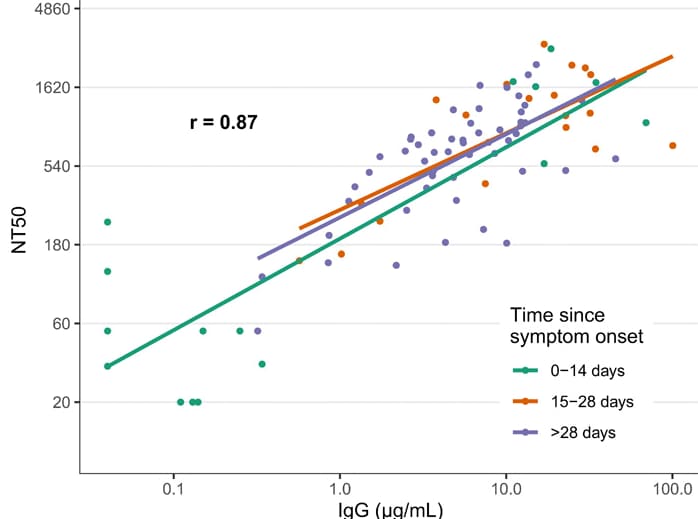
- IgG antibodies to SARS-CoV-2 RBD were strongly correlated with neutralizing antibody titers (r = 0.87) (Figure).
- Neutralizing antibody titers demonstrated little or no decrease at 75 days post-symptom onset.
- No cross-reactivity of antibodies to SARS-CoV-2 RBD with other widely circulating coronaviruses (HKU1, 229 E, OC43, NL63) was observed.
Methods: Study used enzyme-linked immunosorbent assays (ELISAs) to monitor levels of IgG, IgA and IgM antibodies to the SARS-CoV-2 spike protein and RBD in 343 patients with RT-PCR-confirmed SARS-CoV-2 infection (with 93% requiring hospitalization), up to 122 days post-symptom onset. In a subset of 15 individuals with samples collected up to 75 days post-symptom onset, neutralizing antibody responses against the spike protein were measured. Cross-reactivity of antibodies to other coronaviruses was also evaluated. Limitations: Cohort of SARS-CoV-2-infected individuals was skewed toward those with severe disease.
Figure:
Note: Adapted from Iyer et al. Correlation of SARS-CoV-2 neutralizing antibody titers in symptomatic RT-PCR positive persons with anti-RBD IgG responses at 0–14, 15–28, and >28 days post symptom onset. The overall repeated measures correlation coefficient (r) is shown. Lines represent simple linear models for each time period. NT50, 50% neutralizing titer. From Persistence and decay of human antibody responses to the receptor binding domain of SARS-CoV-2 spike protein in COVID-19 patients. Iyer et al. Science immunology, Vol. 5, Issue 52, eabe0367. Reprinted with permission from AAAS.
Persistence of serum and saliva antibody responses to SARS-CoV-2 spike antigens in COVID-19 patients.external icon Isho et al. Science immunology (October 8, 2020).
Key findings:
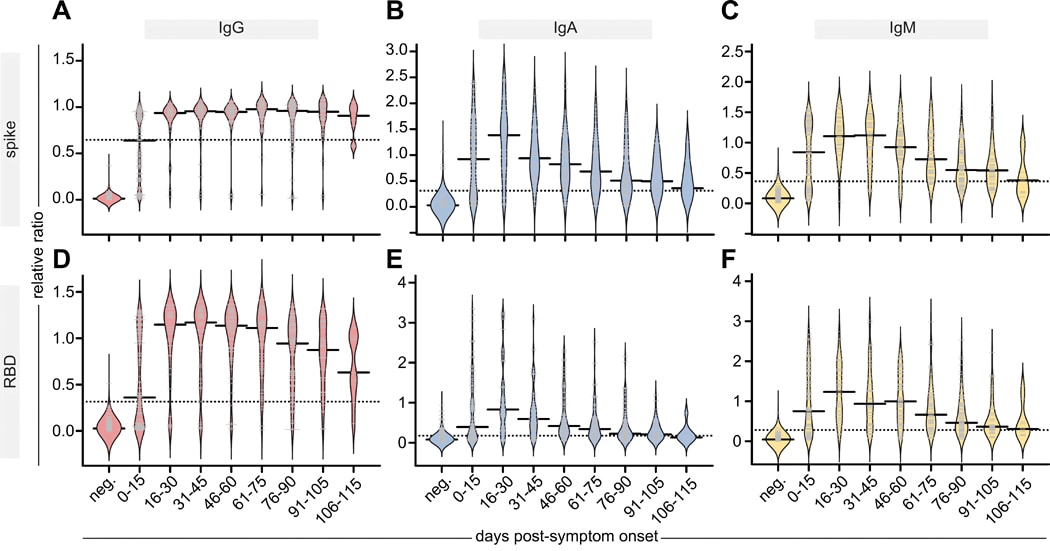
- IgG antibodies to both the SARS-CoV-2 spike protein and its receptor-binding domain (RBD) peaked in serum by 16–30 days post-symptom onset and were sustained through 105–115 days (Figure).
- IgM and IgA also peaked in serum by 16–30 days but then steadily declined such that they were at 66%–84% of their maximal levels by 115 days (Figure).
- IgG and IgM levels against the spike protein and RBD were correlated across 71 paired serum and saliva samples.
Methods: Study used enzyme-linked immunosorbent assays (ELISAs) to monitor IgG, IgA and IgM antibodies levels to the SARS-CoV-2 spike protein and RBD in acute and convalescent serum from 439 persons and saliva from 128 persons, 3–115 days post-symptom onset. Antibody levels were compared to negative controls. Limitations: Antibody responses beyond 115 days post-symptom onset were not studied.
Figure:
Note: Adapted from Isho et al. Persistence of IgG, IgA, and IgM antibodies in the serum of affected individuals. Relative ratios of a pool of positive controls of spike (A-C) and RBD (D-F) to the indicated antibodies. Days post-symptom onset in 15-day increments and compared with pre-COVID samples (neg). Solid bars denote the median and dotted line represents the median ratio for all samples. From Persistence of serum and saliva antibody responses to SARS-CoV-2 spike antigens in COVID-19 patients. Isho et al. Science Immunology, Vol. 5, Issue 52, eabe5511. Reprinted with permission from AAAS.
PREPRINT (NOT PEER-REVIEWED)
Clinical, laboratory, and temporal predictors of neutralizing antibodies to SARS-CoV-2 after COVID-19.external icon Boonyaratanakornkit et al. medRxiv (October 8, 2020).
Key findings:
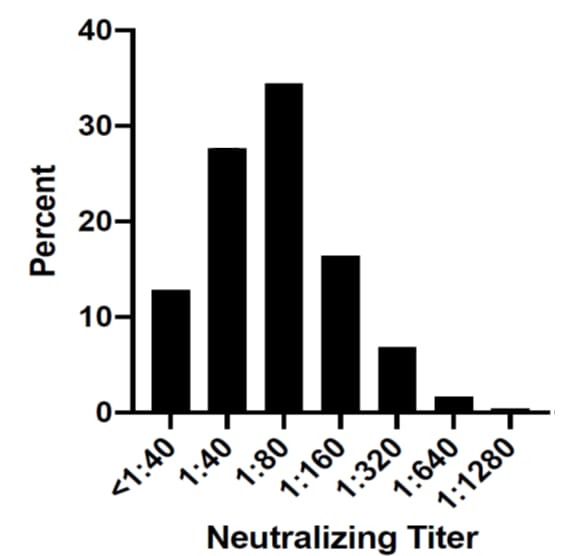
- ~60% of potential convalescent plasma donors had SARS-CoV-2 neutralizing antibody (nAb) titers ≥1:80(Figure).
- Correlates of nAb titer ≥1:80 included the following:
- Older age (adjusted OR [aOR] 1.03/year of age, 95% CI 1.00-1.06).
- Male sex (aOR 2.08, 95% CI 1.13-3.82).
- Fever during acute illness (aOR 2.73, 95% CI 1.25-5.97).
- Hospitalization for COVID-19 (aOR 6.59, 95% CI 1.32-32.96).
- Longer time between PCR diagnosis and antibody testing (aOR 0.97/day, 95% CI 96-0.99) associated with lower nAb titers.
- IgG antibodies titers to SARS-CoV-2 spike protein S1 domain and nucleoprotein corresponded well with nAb titers.
Methods: Samples from 250 adults recovering from RT-PCR-confirmed SARS-CoV-2 infection and participating in a convalescent plasma donor screening program were tested for IgG to SARS-CoV-2 spike protein S1 domain, spike protein nucleoprotein, and nAb. Analyses modeled predictors of high nAb titers (≥1:80, the US Food and Drug Administration [FDA] minimum titer for convalescent plasma), adjusting for demographic and clinical variables, and determined correlation between IgG and nAb titers. Limitations: Cross sectional study with longitudinal data obtained from only a subset of the cohort; cohort consisted of predominantly white individuals.
Figure:
Note: From Boonyaratanakornkit et al. Distribution of neutralization antibody titers in convalescent subjects (N=250). Used by permission from author.
Implications for 3 studies (Iyer et al., Isho et al., & Boonyaratanakornkit et al.): Serum IgG responses to SARS-CoV-2 appear to be sustained for at least 3 months and are highly correlated with SARS-CoV-2 nAb. Because direct assessment of neutralizing activity requires specialized laboratories, SARS-CoV-2 IgG titers from relatively easy-to-perform commercial assays may serve as a surrogate for assessment of neutralizing activity. Serum IgG is also correlated with saliva IgG which might serve as a marker for systemic immunity. Decreasing nAb titers over time raise concern for re-infection and could impact implementation of immunization programs and monitoring for herd immunity.
PEER-REVIEWED
Symptoms and transmission of SARS-CoV-2 among children—Utah and Wisconsin, March–May 2020.external icon Laws et al. Pediatrics (October 2020).
Key findings:
- Secondary infection rates were similar among adult (30%, n = 36) and child (28%, n = 19) household contacts (OR 1.11, 95% CI 0.56-2.21).
- Among households with potential for transmission from children, child-to-adult transmission may have occurred in 2/10 (20%) and child-to-child transmission may have occurred in 1/6 (17%) cases.
- Secondarily infected children had fewer and less severe symptoms than adults.
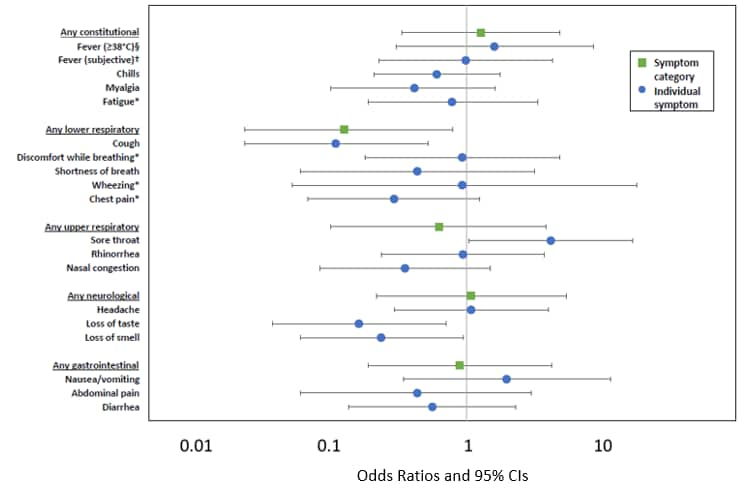
- Children were less likely to report lower respiratory symptoms, cough, loss of taste or smell than adults, and more likely to report sore throat.
- Children had shorter symptom duration than adults, median 10 vs 16 days (β = -6.5, 95% CI -10.1 to -2.9).
- In children, symptoms had low positive predictive value (PPV) for infection except for measured fever, 100% (95% CI 44%–100%).
Methods: Laboratory-confirmed SARS-CoV-2 index-cases and their household contacts (58 households, n = 188 contacts [120 adults and 68 children]) were enrolled in a household transmission investigation between March and May 2020. Blood and NP swab specimens were collected at specified intervals, and when a household member developed new or worsening symptoms, all participants were followed for 14 days. Transmission, risk factors, secondary infection rates, and symptoms in child and adult contacts were assessed. This study represent sub-analyses from the full investigationexternal icon. Limitations: Study used an incubation period of 2 days which may underestimate cases as incubation period may last up to 14 days.
Implications: Children may be a transmission source within households. Because the PPV for most symptoms in children was low, there should be a low threshold for testing children living with a confirmed or suspected case.
Figure:
Note: From Laws et al. Unadjusted odds ratios for the presence of symptoms comparing 19 children (referent) and 36 adults with secondary infection. §Equivalent to 100.4°F. †Subjective fever is defined as tactile rather than measured. *Symptom was not systematically asked of all participants. Reproduced with permission from Pediatrics, Vol. 146, e2020027268, Copyright © 2020 by the AAP.
PEER-REVIEWED
State-level needs for social distancing and contact tracing to contain COVID-19 in the United Statesexternal icon. Chiu et al. Nature Human Behavior (October 6, 2020).
Key findings:
- In most states, the initial shelter-in-place controls (April 11–May 29, 2020) contained the outbreak.
- The minimum effective reproduction number (Reff, average number of secondary cases generated by a single infectious person) in all but five states was <1.
- By July 2020, most states had ≥75% probability of a Reff >1.
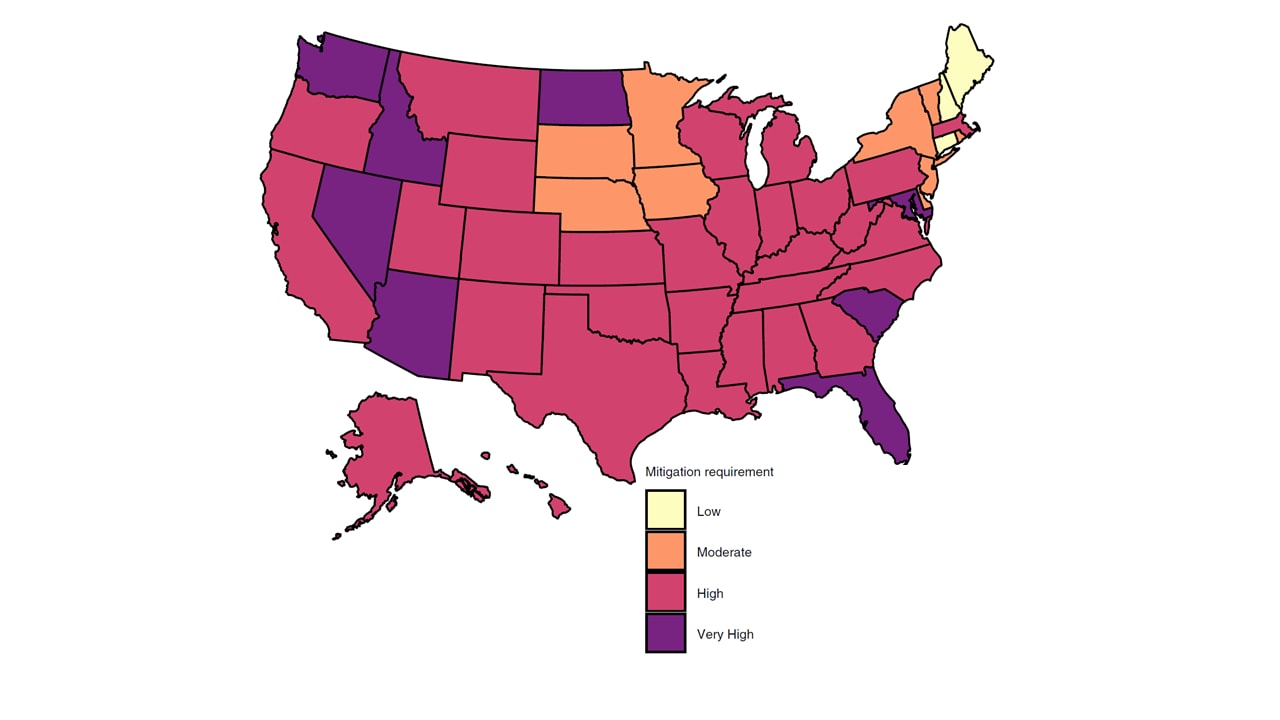
- Mitigating SARS-CoV-2 spread (maintaining a Reff <1) in most states could be accomplished by implementing two of the following: doubling the testing rate; doubling the contact tracing rate; reducing re-opening by 25% (Figure).
Methods: A dynamic compartmental model calibrated to state-level COVID-19 cases and deaths examined the effect of social distancing, state re-opening after shelter-in-place controls, testing, and contact tracing on SARS-CoV-2 transmission and mortality in each state, between March 2020 and late July 2020. Limitations: Model did not account for heterogeneity in individual behavior; uncertainty of hygiene practices with various physical distancing measures, or age-stratified transmission risk.
Implications: The model indicates that the initial social distancing measures, implemented near the beginning of the pandemic, were mostly successful in containing the outbreak while relaxation of these policies led to a rise in cases. These findings emphasize the need for public health authorities to understand the impact of social-distancing measures and testing and contact-tracing strategies to mitigate the epidemic.
Figure:
Note: From Chiu et al. Estimated state-level mitigation measures needed to curtail the epidemic as of July 22, 2020. No state would be able to curtail epidemic if reopening is relaxed an additional 25%. Low, state can maintain current level of reopening but not increase current reopening more than 25%. Moderate, doubling contact-tracing rate or reducing current reopening by 25%. High, double both testing and contact tracing rate and/or reduce current reopening by 25%; Very High, reduce current reopening by 50% and double testing and/or contact tracing rate. Reprinted by permission from Springer Nature Customer Service Centre GmbH: [Springer Nature, Nature Human Behaviour, State-level needs for social distancing and contact tracing to contain COVID-19 in the United States, Chiu et al., COPYRIGHT 2020
PEER-REVIEWED
Characteristics of hospitalized children with SARS-CoV-2 in the New York City metropolitan area.external icon Verma et al. Hospital Pediatrics (October 1, 2020).
Key findings:
- 28% of children were admitted to the critical care unit.
- 70% of children with comorbidities required critical care vs 37% of those without comorbidities (p = 0.008).
- Obesity was the most common factor associated with critical care, 63% of obese vs 28% of non-obese children (p = 0.02).
- 43% of children presenting with renal dysfunction vs 10% without renal dysfunction required critical care (p = 0.002).
- A greater proportion of children with asthma, 28%, than those without, 8% (p = 0.002) received any respiratory support, with no difference in need for critical care (p = 0.26).
Methods: Multicenter retrospective cohort study of 82 children hospitalized with COVID-19 between March 1, and May 10, 2020. Analyses compared patients based on admission to acute or critical care units and need for any respiratory support. Limitations: Small sample size; subjects from a single locality; observational study.
Implications: Like clinical course in adults, comorbidities in children hospitalized for COVID-19 increased acuity. Attention to comorbidities in children hospitalized for COVID-19 is warranted.
Gaining back what is lost: Recovering the sense of smell in mild to moderate patients after COVID-19.external icon Iannuzzi et al. Chemical Senses (October 9, 2020).
Key findings:
- At baseline, 10% of patients were anosmic (loss of sense of smell) and more than 50% were hyposmic (decreased sense of smell).
- On follow-up, olfactory deficits improved in most patients (Figure).
- Olfactory threshold (lowest concentration of an odor that could be detected) improved almost 2-fold, with less improvement in odor discrimination (ability to detect differences between odors).
- No improvement was observed in odor identification (ability to correctly identify an odor).
- By two months after symptom onset, there was a decrease in the number of hyposmic patients (53.3% to 6.7%), and an increase in normosmic patients (36.7% to 73.3%).
- No patients remained anosmic.
Methods: Adults hospitalized with mild to moderate COVID-19 (n = 30) between April and May, 2020 were evaluated with a quantitative olfactory test during hospitalization and approximately two months after symptom onset. Repeated measures ANOVA was used to calculate differences. Limitations: Small sample size; no explanations for figures in the article are given.
Implications: Findings indicate that many patients, with olfactory deficits due to SARS-CoV-2 infection, re-gain their sense of smell within a couple of months of symptom onset.
Figure:
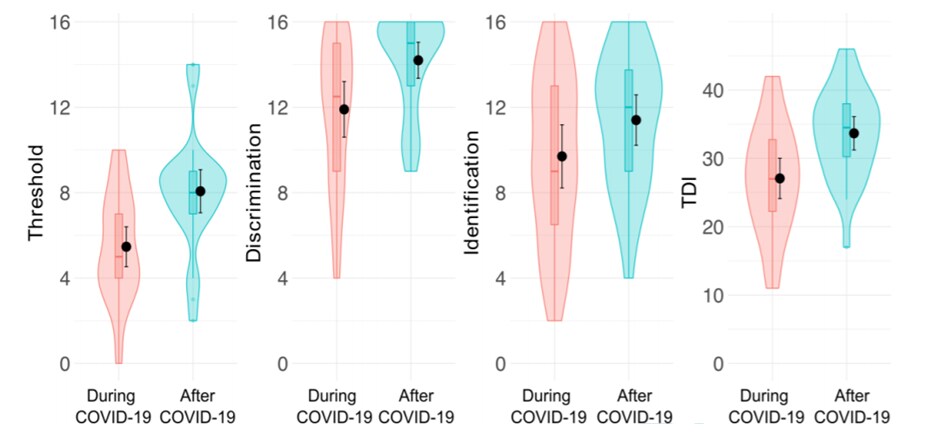
Note: From Iannuzzi et al. Results of olfactory testing during and after COVID-19. TDI, a composite of the olfactory threshold (T), odor discrimination (D) and odor identification (I) score. Anosmia defined as (TDI ≤16.5), hyposmia (16.5< TDI <30.5) and normal ability to smell (TDI ≥30.5). No explanations for figures in the article are given. Gaining back what is lost: Recovering the sense of smell in mild to moderate patients after COVID-19. Iannuzzi et al. Chemical Senses (2020), 45 (9):875-881.
Cerebrovascular events and outcomes in hospitalized patients with COVID-19: The SVIN COVID-19 Multinational Registry.external icon Siegler et al. Journal of Stroke (September 30, 2020).
Key findings:
- Incidence of cerebrovascular events (CVE) was 1.13% or 1,130 per 100,000 (95% CI 970-1,320 per 100,000).
- Incidence of acute ischemic stroke (1.08%) was greater than either intracranial hemorrhage (0.19%) or cortical vein and/or sinus thrombosis (0.02%).
- In-hospital mortality for stroke and intracranial hemorrhage was 38.1% and 58.3%, respectively.
- Median time from onset of CVE to death was ~4 days in persons with acute ischemic stroke or intracranial hemorrhage.
Methods: Multinational observational cohort study of 14,483 patients with laboratory-confirmed SARS-CoV-2 infection and hospitalization between February 1 and June 16, 2020. CVE incidence of and mortality were determined. Limitations: Analysis limited to patients from large referral hospitals which may have biased toward more severe cases; no comparisons made to COVID-19 inpatients without CVE or to general population.
Implications: Although CVE are uncommon in patients with COVID-19, they have a high associated mortality indicating that these patients require early diagnosis and intervention to improve survival.
PREPRINT (NOT PEER-REVIEWED)
Repurposed antiviral drugs for COVID-19–interim WHO SOLIDARITY trial resultsexternal icon. WHO Solidarity trial consortium. medRxiv (October 15, 2020). Published in NEJM (December 2, 2020).
Key findings:
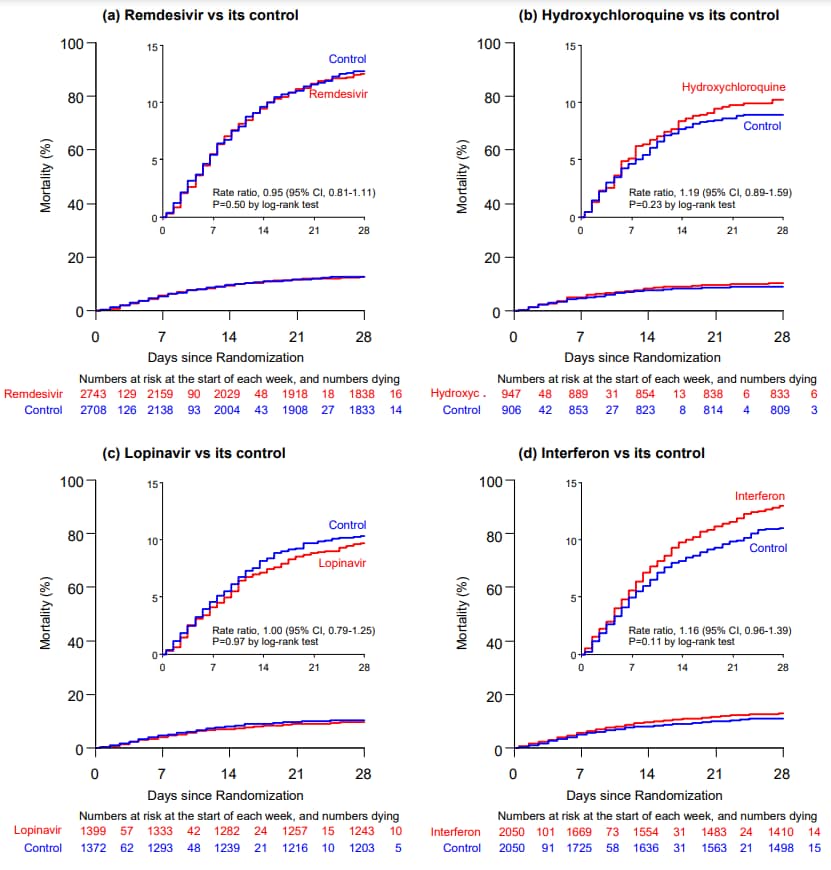
- Overall 28-day mortality was 12%; 39% if ventilated at randomization, 10% otherwise.
- The risk of death for each drug vs standard of care was (Figure):
- Remdesivir (rate ratio [RR] = 0.95, 95% CI 0.81-1.11, p = 0.50).
- Hydroxychloroquine (RR = 1.19, 95% CI 0.89-1.59, p = 0.23).
- Lopinavir plus ritonavir (RR = 1.00, 95% CI 0.79-1.25, p = 0.97).
- Interferon (RR = 1.16, 95% CI 0.96-1.39, p = 0.11).
- Hydroxychloroquine and lopinavir were discontinued for futility (unlikely to show a benefit).
- No drug reduced initiation of ventilation or hospitalization duration.
Methods: Open-label randomized control trial comparing drug treatment, for adults hospitalized for COVID-19, to local standard of care, in 30 countries. Patients were randomized to remdesivir (n = 2,750), hydroxycholoroquine (n = 954), lopinavir plus ritonavir (n = 1,411), interferon plus lopinavir (n = 651), interferon only (1,412) or local standard of care (n = 4,088). Trial was adaptive; unpromising drugs could be dropped. Primary study outcome was 28-day mortality. These interim study results are for the original four drugs. Limitations: Differences in local standard of care not evaluated.
Implications: Although the Adaptive COVID-19 Treatment Trial external icon indicates that remdesivir reduces time to recovery, in this larger trial there were no differences in time to hospital discharge or in mortality. An editorialexternal icon discusses these disparate results. Findings from this trial are consistent with results from the larger RECOVERY trial for hydoxycholoroquineexternal icon, and lopinavir plus ritonavirexternal icon. Taken together, the benefit of remdesivir is unclear. However, it appears none of the other potential drugs studied here for COVID-19 treatment have significant effect on mortality.
Figure:
Note: Adapted from WHO Solidarity trial consortium. In-hospital mortality of each drug tested. The inset shows the same data on an expanded y-axis. Permission request in process.
Viral infections in pregnancy can increase risk of adverse outcomes in mothers and newborns. Here we describe two papers that evaluated maternal and neonatal outcomes among pregnant women with COVID-19.
PEER-REVIEWED
A. Epidemiology of coronavirus disease 2019 in pregnancy: Risk factors and associations with adverse maternal and neonatal outcomesexternal icon. Brandt et al. American Journal of Obstetrics and Gynecology (September 25, 2020).
Key findings:
- Most mothers had either asymptomatic or mild COVID-19 (n = 54, 88.5%) while 11.5% (n = 7) had severe infection.
- A composite of adverse maternal outcomes was more likely among mothers with SARS-CoV-2 infection compared with those without SARS-CoV-2 infection, 18.0% vs 8.2% (adjusted OR [aOR] 3.4, 95% CI 1.2-13.4).
- Adverse maternal outcomes were similar among mothers with mild or asymptomatic COVID-19 and those without SARS-CoV-2 infection, 7.4% vs 8.2% (aOR 1.1, 95% CI <0.0-6.0).
- 100% of mothers with severe SARS-CoV-2 infections had adverse maternal outcomes compared with mothers without SARS-CoV-2 infection (8.2%).
- Adverse neonatal outcomes were similar among neonates born to mothers with mild or asymptomatic COVID-19 vs those born to mothers without SARS-CoV-2 infection, 9.3% vs 13.9% (aOR 1.0, 95% CI 0.1-7.7).
- Adverse neonatal outcomes were more prevalent among those born to mothers with severe COVID-19 (85.7%) than among those born to mothers without SARS-CoV-2 infection (13.9%).
Methods: Case-control study of 61 pregnant patients with RT-PCR-confirmed SARS-CoV-2 infection, who delivered between 16- and 41-weeks gestation from March 11 to June 11, 2020, matched by delivery date to 122 pregnant people without SARS-CoV-2 infection. Composite adverse maternal and neonatal outcomes were identified from chart abstraction and odds ratios for outcomes calculated, adjusted for maternal age, obesity, race, and comorbid medical problems. Limitations: Relatively small sample size; hospital-based sample might not be representative of the general population.
B. Outcomes of neonates born to mothers with severe acute respiratory syndrome Coronavirus 2 infection at a large medical center in New York Cityexternal icon. Dumitriu et al. JAMA. (October 12, 2020).
Key findings:
- 2% (95% CI 0.2%-7.0%) of neonates born to mothers with COVID-19 had positive test results for SARS-CoV-2.
- None showed clinical signs of COVID-19.
- No evidence of vertical or postnatal transmission in neonates who roomed with their mothers or who were breastfed.
- Neonates born to mothers with severe COVID-19 were more likely than those born to mothers with asymptomatic or mild infection to be born earlier, median gestational age 37.9 vs 39.1 weeks (p = 0.02) and to require phototherapy for hyperbilirubinemia, 0% vs 7.0% (p = 0.04).
Methods: A retrospective cohort study of neonates (n = 101) born to mothers either suspected or confirmed positive for SARS-CoV-2 infection in two New York City hospitals from March 13 to April 24, 2020. Neonates were admitted to either nurseries (n = 82, roomed with their mothers who wore masks) or to intensive care units (n = 19). Direct breastfeeding was encouraged. Neonate and maternal clinical characteristics and clinical courses were reviewed. The primary outcome was newborn SARS-CoV-2 test results. Limitations: Results collected from a COVID-19 hotspot may not be generalizable; all mothers studied were infected in the third trimester, with most at term; limited follow-up at the end of the observation period.
Implications for 2 studies (Brandt et al. & Dumitriu et al.): Increased risk for adverse maternal and neonatal outcomes associated with COVID-19 appears to be limited to pregnant persons with severe COVID-19. As incidence of mother-to-newborn transmission appears to be low, separating mothers with COVID-19 from their newborns and restricting direct breastfeeding does not appear warranted. Steps to minimize exposure to SARS-CoV-2 should be taken in pregnant women, given the possibility of severe COVID-19 disease and risk of adverse maternal and neonatal outcomes.
PEER-REVIEWED
Antibody response to multiple antigens of SARS-CoV-2 in patients with diabetes: An observational cohort study.external icon Lampasona et al. Diabetologia (October 8, 2020).
Key findings:
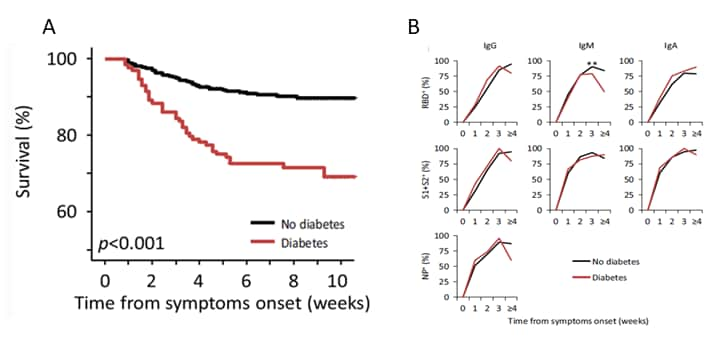
- Diabetes was associated with increased risk of death (hazard ratio 2.32, 95% CI 1.44-3.75, p = 0.001) (Figure).
- There were negligible differences in SARS-CoV-2 humoral response in patients with and without diabetes (Figure).
- Immune response was not influenced by glucose levels.
- Presence of IgG antibodies to the SARS-CoV-2 receptor-binding domain of the spike protein was predictive of survival in patients with and without diabetes.
Methods: Cohort study of 509 adult patients (139 with diabetes) hospitalized for COVID-19 between February 25 and April 19, 2020. Clinical outcomes and SARS-CoV-2 antibody titers were determined and compared by presence of hyperglycemia. Limitations: Unclear what comorbid conditions were adjusted for in the analyses; antibody neutralizing activity was not measured.
Implications: The increased severity and mortality of COVID-19, in persons with diabetes, does not appear to be caused by impaired antibody production in response to SARS-CoV-2 infection.
Figure:
Note: Adapted from Lampasona et al. A: Survival rates in persons with diabetes and without diabetes. B: Timing and amplitude of antibody response to SARS-CoV-2 among persons with diabetes and without diabetes. RBD, Receptor-binding domain (of SARS-CoV-2 spike protein); S1 and S2, Subunits of SARS-CoV-2 spike protein; NP, Nucleocapsid protein. Available via Nature Public Health Emergency Collection through Pubmed Central.
Clinical Treatment & Management
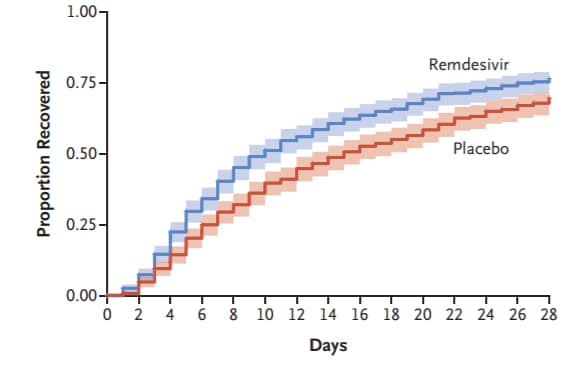
- Beigel et al. Remdesivir for the treatment of COVID-19—final reportexternal icon. NEJM. Final results from the Adaptive COVID-19 Treatment Trial showing remdesivir to be superior to placebo in shortening recovery time in adults. Preliminary study resultsexternal icon were previously published.
Figure:
Note: Adapted from Beigel et al. Cumulative recovery estimates among remdesivir and placebo groups, in overall study population after completion of follow up. From NEJM, Beigel et al. Remdesivir for the treatment of COVID-19—final report, DOI: 10.1056/NEJMoa2007764, October 8, 2020. Copyright © 2020 Massachusetts Medical Society. Reprinted with permission from Massachusetts Medical Society.
- Burwick et al. Compassionate use of remdesivir in pregnant women with severe COVID-19.external icon Clinical Infectious Diseases. Study of compassionate use remdesivir showed high recovery rates and low adverse events among pregnant and postpartum women with COVID-19.
- Del Rio et al. Long-term health consequences of COVID-19external icon. JAMA. Authors summarize potential long-term consequences of SARS-CoV-2 infection and argue for multidisciplinary care of persons with persistent symptoms and for longitudinal studies to determine breadth of sequalae.
Case Reports
- Patrocínio de Jesus et al. Reactivation of SARS-CoV-2 after asymptomatic infection while on high-dose corticosteroids. Case reportexternal icon. SN Comprehensive Clinical Medicine. Report of patient considered recovered from asymptomatic infection who, while on high-dose steroids for demyelinating disease, presented with new signs and symptoms of SARS-CoV-2 infection leading to transmission of infection to three household members.
- Kapatayes et al. Retinal vein occlusion associated with COVID-19.external icon Retina Today. Case report of central retinal vein occlusion in a patient with COVID-19.
Recommendations and Lessons Learned
- Bergman et al. Recommendations for welcoming back nursing home visitors during the COVID-19 Pandemic: Results of a Delphi Panelexternal icon. Journal of American Medical Directors Association. Guidance for long term care facilities on receiving visitors.
- Page et al. Lessons we’ve learned—COVID-19 and the undocumented Latinx communityexternal icon. NEJM. Authors describe barriers to care in the undocumented Latinx community and suggest steps to promote health equity.
- Deep et al. A hybrid model of pediatric and adult critical care during the coronavirus disease 2019 surge: The experience of two tertiary hospitals in London and New Yorkexternal icon. Pediatric Critical Care Medicine. Describes a hybrid intensive care model that enabled pediatric intensive care units to provide adult critical care while maintaining essential services for critically ill children.
Miscellaneous
- Madariaga et al. Clinical predictors of donor antibody titer and correlation with recipient antibody response in a COVID-19 convalescent plasma clinical trialexternal icon. Journal of Internal Medicine. Describes clinical and serological parameters associated with convalescent antibody titer and response to plasma transfusion.
- Walton et al. Mechanisms linking the human gut microbiome to prophylactic and treatment strategies for COVID-19.external icon British Journal of Nutrition. A review of how gut microbiota may influence risk of contracting SARS-CoV-2 infection and proposed mechanisms for probiotic and prebiotic interventions.
- Landrigan et al. COVID-19 and clean air: An opportunity for radical changeexternal icon. Lancet Planetary Health. Authors argue that the reduction in ambient air pollution since the pandemic began demonstrates that cleaner air is possible, and they propose key actions to control air pollution and reduce pollution related health inequalities.
Disclaimer: The purpose of the CDC COVID-19 Science Update is to share public health articles with public health agencies and departments for informational and educational purposes. Materials listed in this Science Update are selected to provide awareness of relevant public health literature. A material’s inclusion and the material itself provided here in full or in part, does not necessarily represent the views of the U.S. Department of Health and Human Services or the CDC, nor does it necessarily imply endorsement of methods or findings. While much of the COVID-19 literature is open access or otherwise freely available, it is the responsibility of the third-party user to determine whether any intellectual property rights govern the use of materials in this Science Update prior to use or distribution. Findings are based on research available at the time of this publication and may be subject to change.

