COVID-19 Science Update released: August 25, 2020 Edition 42

The COVID-19 Science Update summarizes new and emerging scientific data for public health professionals to meet the challenges of this fast-moving pandemic. Weekly, staff from the CDC COVID-19 Response and the CDC Library systematically review literature in the WHO COVID-19 databaseexternal icon, and select publications and preprints for public health priority topics in the CDC Science Agenda for COVID-19 and CDC COVID-19 Response Health Equity Strategy.
Here you can find all previous COVID-19 Science Updates.
More effective clinical care and prevention of COVID-19 would benefit by knowing the extent to which a person’s viral load is affected by the duration of infection and its severity. Several recent studies examine these issues.
PEER-REVIEWED
A. Clinical course and molecular viral shedding among asymptomatic and symptomatic patients with SARS-CoV-2 infection in a community treatment center in the Republic of Korea.external icon Lee et al. JAMA Internal Medicine (August 6, 2020).
Key findings:
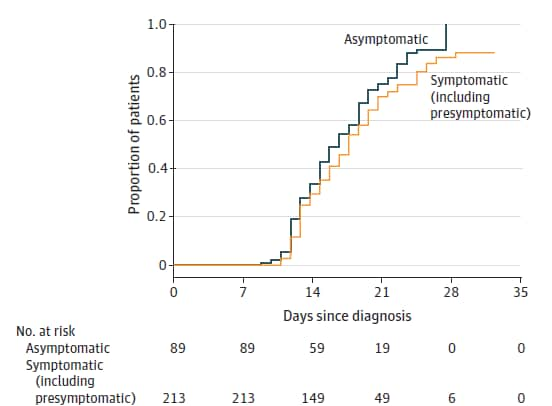
- Median time to convert from positive to negative RT-PCR test result was similar for asymptomatic and symptomatic patients, 17.0 versus 19.5 days, respectively (Figure).
- Viral loads were similar in asymptomatic and symptomatic patients, as measured by Ct values.
Methods: Subjects consisted of a retrospective cohort of 303 symptomatic and asymptomatic patients testing positive for SARS-CoV-2 and isolated during the course of infection, South Korea, March 6 to 26, 2020. Median age was 22 years. Upper and lower respiratory specimens were obtained on Days 8, 9, 15 and 16 and tested by RT-PCR. Patients were released from isolation if they had consecutive negative RT-PCR tests. Limitations: Subjects were young and from only one region of South Korea.
Figure:
Note: Adapted from Lee et al. Kaplan-Meier curve showing relationship between days since diagnosis and proportion of asymptomatic and symptomatic patients with negative RT-PCR result. Reproduced with permission from JAMA Intern Med. doi:10.1001/jamainternmed.2020.3862. Copyright©2020 American Medical Association. All rights reserved.
B. The correlation between clinical features and viral RNA shedding in outpatients with COVID-19external icon. Liao et al. Open Forum Infectious Diseases (August 7, 2020).
Key findings:
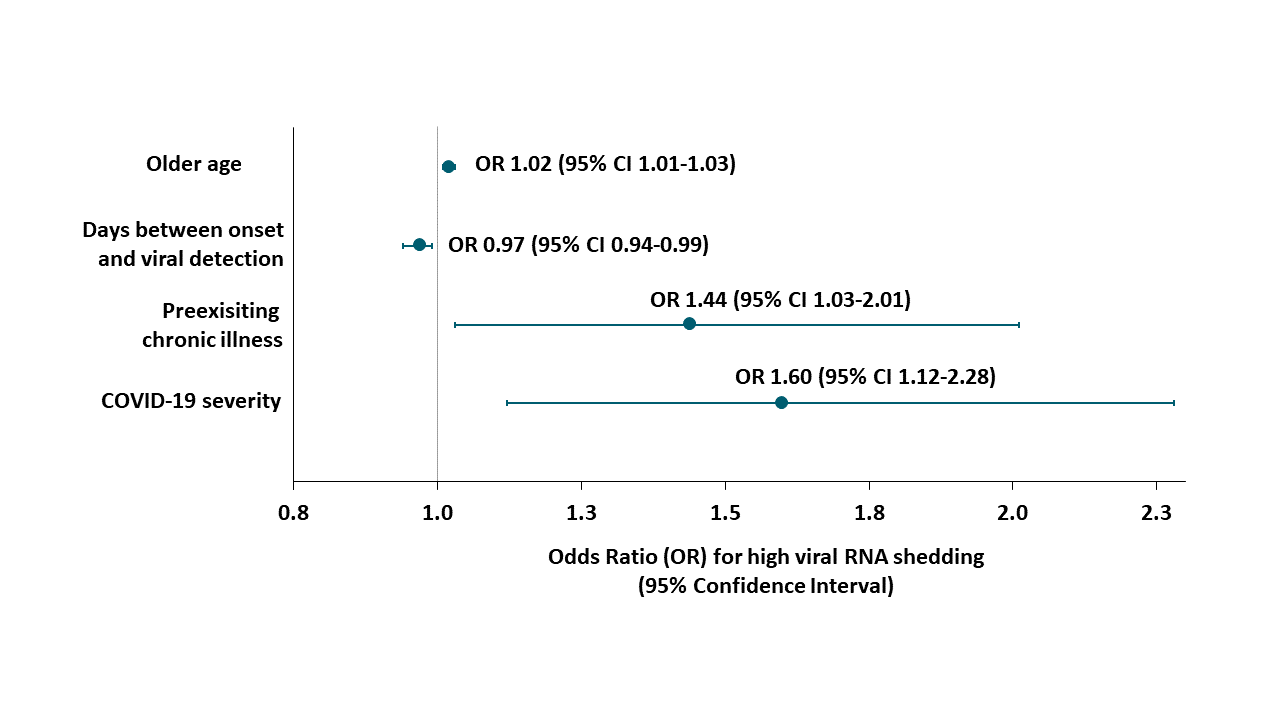
- Outpatients with high SARS CoV-2 RNA shedding, in comparison with those with low viral shedding, were (Figure):
- Older (57.9 vs 53.7 years, p = 0.001).
- More likely to have preexisting chronic illness (32% vs 21%, p <0.001).
- More likely to have severe COVID-19 disease when diagnosed (44% vs. 29%, p <0.001).
- More likely to have a shorter time from onset of illness to viral detection (7.9 vs 9.6 days, p <0.001).
Methods: Subjects were 918 outpatients diagnosed with COVID-19 in Wuhan, January 14 to February 24, 2020. Ct values below the median indicated high viral RNA shedding, while Ct values above the median indicated low viral RNA shedding. Logistic regression was used to test associations between viral RNA shedding and clinical features. Limitations: Single center; testing at one time point with no viral cultures; no long-term outcomes.
Figure:
Note: Adapted from Liao et al. Logistic regression analysis of risk factors for high SARS CoV-2 RNA shedding. Licensed under CC-BY-NC-ND.
Implications of the two studies (Lee et al. and Liao et al.) Persons diagnosed with asymptomatic SARS-CoV-2 infection as outpatients may have similar capacity to infect others as symptomatic cases. Those with more severe COVID-19 disease might shed more virus and test positive longer than patients with less severe disease.
Several recent studies have examined transmission patterns among persons exposed to others with COVID-19 in different settings. The following studies look at outcomes from exposure in households, in healthcare, on public transportation, and other venues.
PEER-REVIEWED
A. Household transmission of SARS-CoV-2 in the United Statesexternal icon. Lewis et al. Clinical Infectious Diseases (August 16, 2020).
Key findings:
- Secondary infection occurred in 32 (55%) of 58 households.
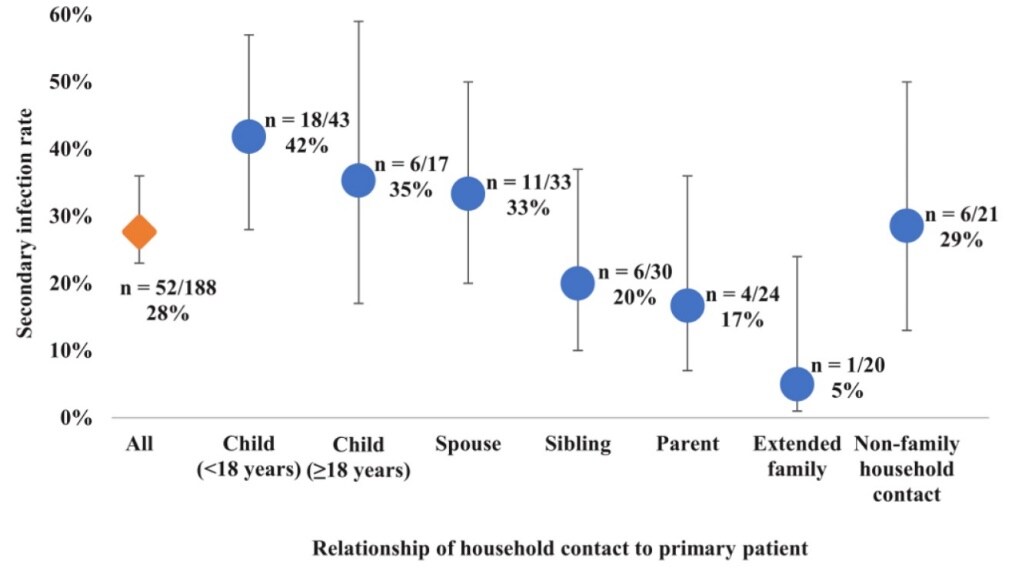
- High overall secondary infection rate (SIR) among household contacts: 52 of 188 persons, (28%) (Figure).
- SIR of 42% for children (<18 years) of the COVID-19 patient.
- SIR of 33% for spouses/partners.
- Household contacts with immunocompromised conditions had much higher risk of infection (odds ratio [OR]: 15.9 95% CI 2.4–106.9) or diabetes mellitus (OR: 7.1 95% CI 1.2–42.5).
Methods: Patients with lab-confirmed COVID-19 and contacts in 58 households in Utah and Wisconsin were interviewed March 22 to April 25, 2020. Respiratory swab testing for SARS-CoV-2 by RT-PCR and blood for serology were collected from patients and household contacts at initial household visit, 14 days later, and if/when a person became symptomatic. SIR and OR were calculated to assess risk factors for secondary infection. Limitations: Did not account for other factors associated with infections; convenience sample.
Figure:
Note: Lewis et al. SIR among household contacts by age of the contacts and relationship to the primary patient. US Government work not subject to copyright.
B. Contact Settings and Risk for Transmission in 3410 Close Contacts of Patients With COVID-19 in Guangzhou, China.external icon Luo et al. Annals of Internal Medicine (August 13, 2020).
Key findings:
- Secondary infection rate (SIR) was 3.7% (127/3,410).
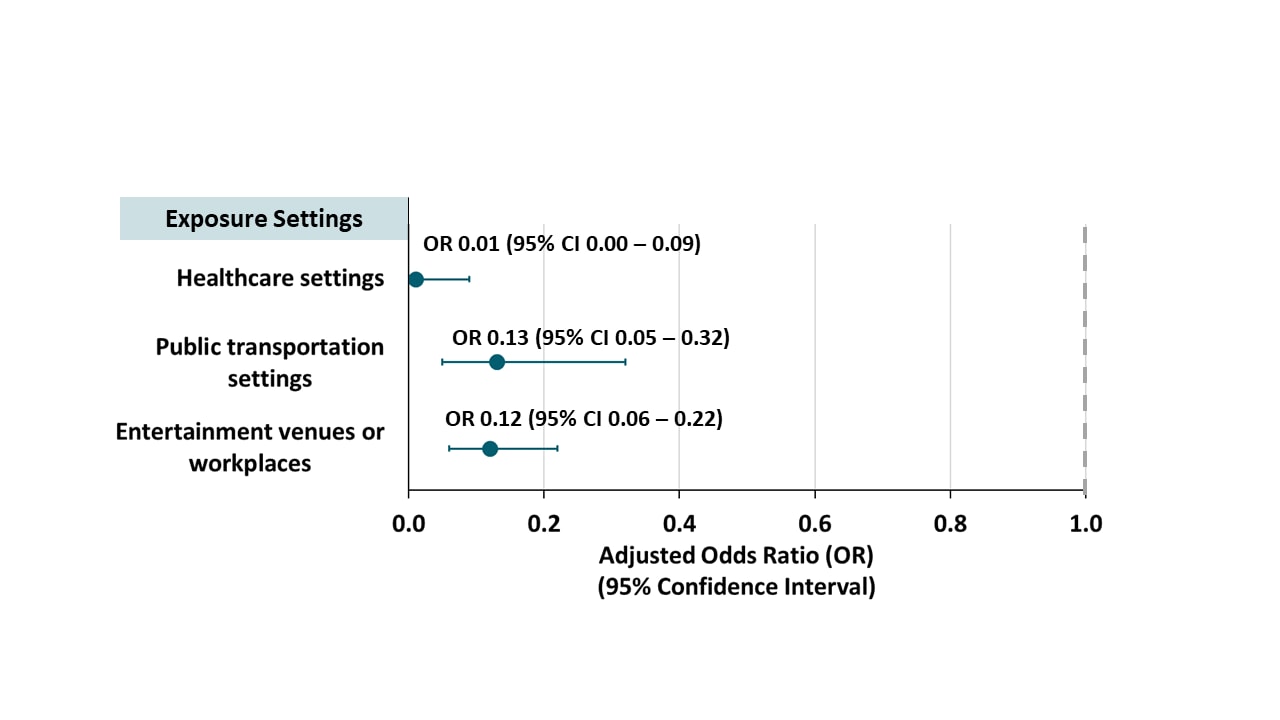
- Compared with household contacts, SIR was lower in contacts exposed in healthcare settings, public transportation and entertainment venues or workplaces (Figure 1).
- SIR increased with COVID-19 severity in the index case (0.3% for asymptomatic, 3.3% for mild, 5.6% for moderate and 6.2% for severe; p for trend <0.001).
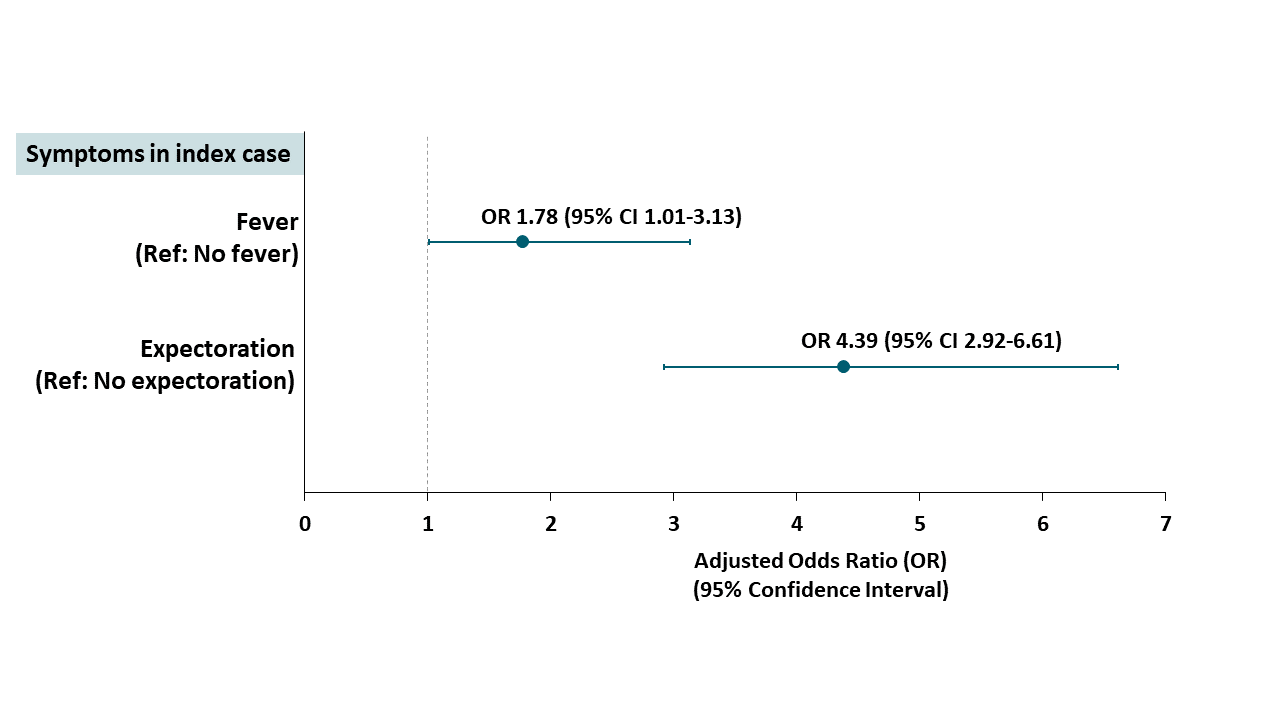
- Expectoration (expelling sputum) or fever in the index case was associated with higher risk of infection in close contacts (Figure 2).
Methods: SIR in different exposure settings with association of various characteristics of SARS-CoV-2 infection among 3410 close contacts of 391 index patients with COVID-19. Limitations: Disease severity in index cases was not assessed at time of exposure to close contacts.
Figure 1
Note: Adapted from Luo et al. Risk for infection among close contacts of COVID-19 patients in different settings relative to household-based exposure. Available via American College of Physicians Public Health Emergency Collection through PubMed Central.
Figure 2
Note: Adapted from Luo et al. aOR for infection among close contacts based on symptoms of index patient. Available via American College of Physicians Public Health Emergency Collection through PubMed Central.
Implications for both studies (Lewis et al. & Luo et al.): Settings with prolonged close proximity with others such as households may facilitate transmission of SARS-CoV-2. Risk of transmission may depend on closeness to a person with COVID-19. Measures to minimize transmission may be needed both in and out of the household, particularly if household members have chronic conditions such as immunocompromise or diabetes.
PEER-REVIEWED
Determinants of COVID-19 vaccine acceptance in the US.external icon Malik et al. EClinical Medicine (August 12, 2020).
Key findings:
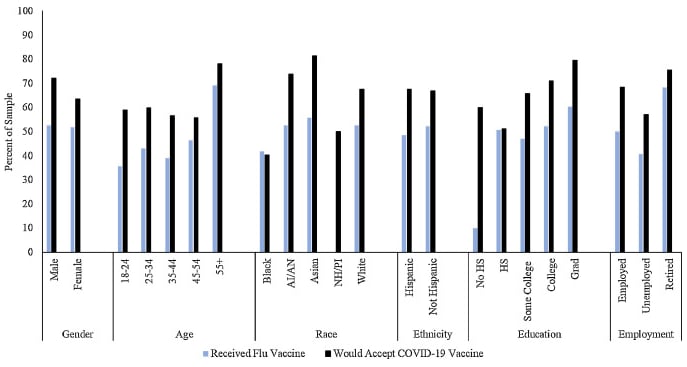
- Most (67%) participants reported they would get a SARS CoV-2 vaccination once available, which was higher than self-reported uptake of influenza vaccine in all groups except for Black respondents.
- Intentions to accept SARS CoV-2 vaccine were lowest among Black respondents (40%).
- Vaccination acceptance by report was higher among men (72%), those aged ≥55 (78%), Asian respondents (81%), and persons with a graduate/professional degree (79%) compared with others (Figure).
Methods: 672 adults completed online surveys and were weighted to the US population. Limitations: Sample included only those with pre-existing online survey accounts who were English-literate. Intent to receive vaccination was self-reported. Data comparing past intent versus actual vaccination rates for influenza was not available.
Implications: Evidence-based community messaging is needed to improve acceptance and uptake of SARS-CoV-2 vaccination.
Figure:
Note: Adapted from Malik et al. Self-reported uptake of seasonal influenza vaccination and willingness to receive a future SARS CoV-2 vaccination. AI/AN: American Indian/Alaska Native, NH/PI: Native Hawaiian/Pacific Islander, Grad: Graduate or Professional Degree. Number of respondents from the NH/PI (n = 2) group receiving flu vaccine was not reported. Licensed under CC-BY-NC-ND.
Plans of US parents regarding school attendance for their children in the fall of 2020: A National Surveyexternal icon. Kroshus et al. JAMA Pediatrics (August 14, 2020).
Key findings:
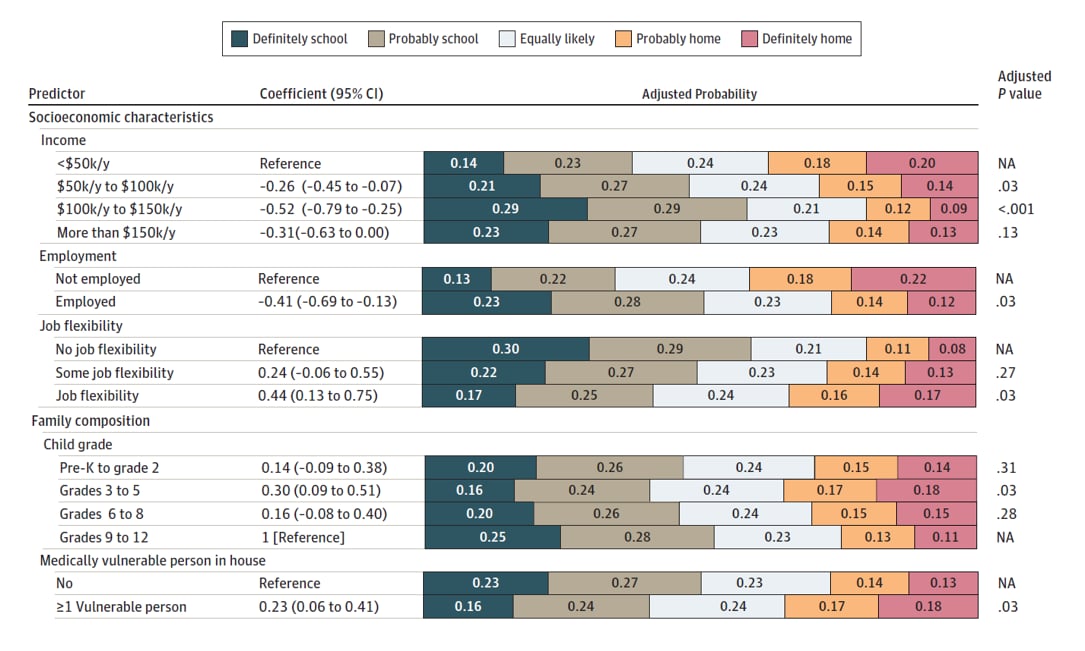
- About 30% of US parents would probably or definitely keep their child at home, and 49% would probably or definitely send their child to school this fall, assuming in-person school instruction was available. The remainder were equally likely to choose one or the other.
- Factors positively associated with plans to keep children at home included lower income, being unemployed, having a job that allows flexible hours/telework, having a child in Grades 3-5, and living with one or more medically vulnerable person (Figure).
- Plans to keep children at home were positively associated with fear of COVID-19, fear of multisystem inflammatory syndrome, and lack of confidence in schools, while negatively associated with challenges with homeschooling.
- Race and ethnicity were not significantly associated with plans to keep children at home.
Methods: 730 US parents of children ages 5-17 years (weighted to US population norms) completed an online survey in June 2020. Multivariable regression estimated probability of school attendance plans. Limitations: Response rate not reported; limited to respondents with computer and mobile phone access; no information on co-parenting situations.
Implications: Back-to-school plans should address concerns of parents. Structural barriers to returning to school, such as lack of flexibility and potential differential levels of school readiness, should be considered.
Figure:
Note: Adapted from Kroshus et al. Probabilities of parents’ plans for school attendance associated with socioeconomic and family characteristics. Reproduced with permission from JAMA Pediatr. doi:10.1001/jamapediatrics.2020.3864. Copyright©2020 American Medical Association. All rights reserved
PEER-REVIEWED
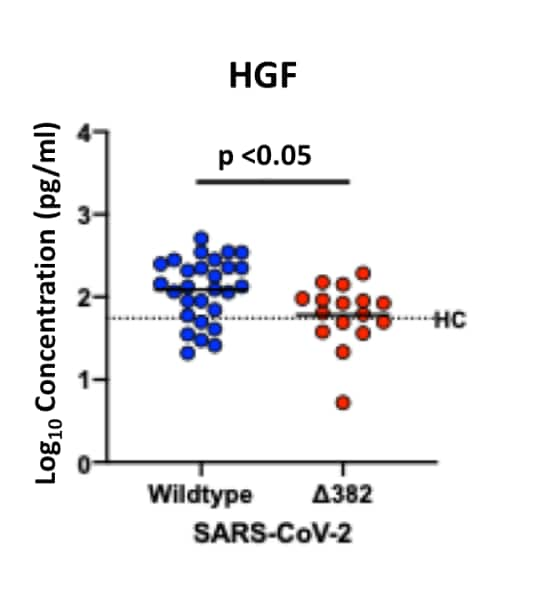
Effects of a major deletion in the SARS-CoV-2 genome on the severity of infection and the inflammatory response: An observational cohort studyexternal icon. Young et al. Lancet (August 18, 2020).
Key findings:
- Patients infected with Δ382 variant SARS-CoV-2 were less likely than patients with wild-type to ever develop hypoxia requiring supplemental oxygen (adjusted odds ratio [aOR] 0.07 [95% CI 0.00-0.48]).
- Among patients without pneumonia, those infected with Δ382 variant vs. wild-type SARS-CoV-2 had:
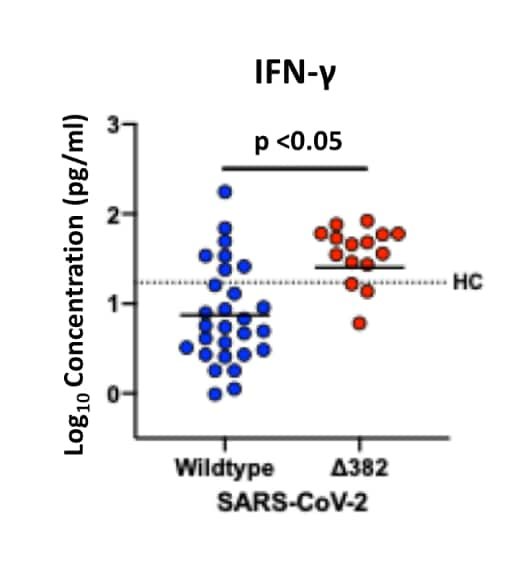
- Higher levels of T-cell activation-associated cytokines, (Interferon-gamma [INF-g], tumor necrosis factor-alpha [TNF-α], interleukin-2 [IL-2] and IL-5), (Figure 1).
- Lower levels of proinflammatory cytokines, chemokines, and growth factors, (hepatocyte growth factor [HGF], leukemia inhibitory factor [LIF] and vascular endothelial growth factor A [VEGF-A]), (Figure 2).
Methods: Association between virus type and development of hypoxia requiring supplemental oxygen was examined in 131 patients diagnosed with SAR-CoV-2 infection with wild type (n = 92), a 382-nucleotide deletion (Δ382 variant [n = 29]), or mixed (n = 10) virus, adjusting for age and comorbidities. Immune mediators were quantified for a subset (n=97). Limitations: Potential unmeasured confounders.
Implications: Infection with Δ382 SARS-CoV-2 variant seems to be associated with a more effective immune response, less pronounced cytokine release, and milder infection.
Figure 1
Figure 2
Note: Adapted from Young et al. Higher INF-g levels in patients without pneumonia infected with Δ382 variant (n = 16) compared with wild type (n = 28) SARS-CoV-2. Black dotted line assumed to be median level for 23 healthy controls (HC).
Significantly higher levels were also seen for TNF-α, IL-2 and IL-5 in those with Δ382 variant (not shown).
Note: Adapted from Young et al. Lower HGF levels in patients without pneumonia infected with Δ382 variant (n = 16) compared with wild type (n = 28) SARS-CoV-2. Black dotted line assumed to be median level for 23 healthy controls (HC).
Significantly lower levels were also seen for LIF and VEGF-A in those with Δ382 variant (not shown).
This article was published in Lancet, Vol number, Young et al., Effects of a major deletion in the SARS-CoV-2 genome on the severity of infection and the inflammatory response: An observational cohort study, Page 603-611, Copyright Elsevier 2020. This article is currently available at the Elsevier COVID-19 resource center: https://www.elsevier.com/connect/coronavirus-information-centerexternal icon .
PEER-REVIEWED
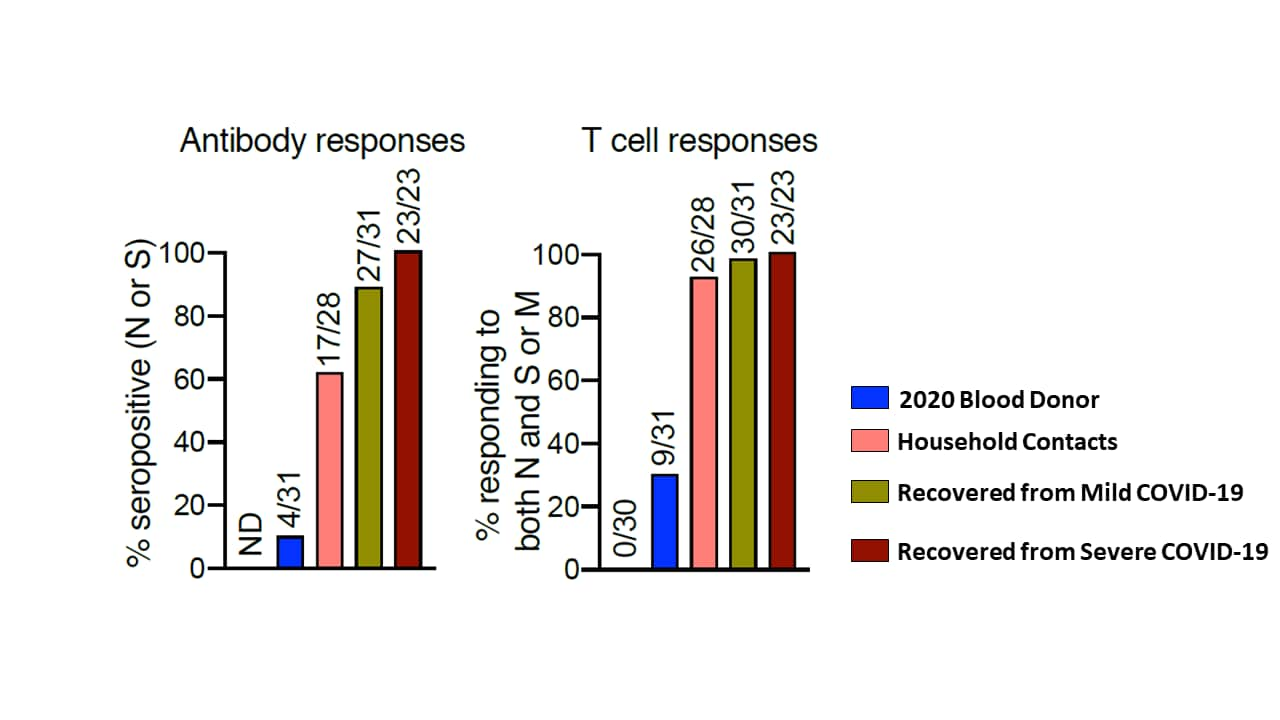
Robust T cell immunity in convalescent individuals with asymptomatic or mild COVID-19.external icon Sekine et al. Cell (August 14, 2020).
Key findings:
- T cell responses to SARS-CoV-2 were detected in symptomatic COVID-19 patients after recovery.
- Some individuals had discordant T cell and antibody responses (Figure):
- Although 4/31 healthy controls were seropositive, 9 had T cell responses.
- Although 17/28 household contacts were seropositive, 26 had T cell responses.
- Although 27/31 persons were seropositive after mild COVID-19 disease, 30 had T cell responses.
Methods: IgG antibody and T cell responses were determined in persons during infection (11-17 days post-onset), 3-53 days after symptom resolution, in household contacts and blood donors from 2019 and 2020 (healthy controls). Limitations: Some T cell responses were likely caused by cross-reactivity to seasonal coronavirus; latest post-recovery blood sampling was only 2 months after symptom resolution.
Implications: T cell responses are important because they could contribute to vaccine efficacy, herd immunity, potential for reinfection, and population disease burden and severity. Seroprevalence (antibody) estimates may not fully represent population immunity because it does not measure T cell responses. Unidentified exposure to seasonal human coronaviruses may be instrumental in developing humoral and/or cellular responses among those exposed to but not infected by SARS-CoV-2.
Figure:
Note: Adapted from Sekine et al. Antibody (left) and T cell (right) responses from 2020 blood donors, household contacts and those recovered from mild or severe COVID-19. The open space to the left of the blue bar shows results from 2019 blood donor controls. Licensed under CC-BY 4.0.
Effect of an inactivated vaccine against SARS-CoV-2 on safety and immunogenicity outcomes interim analysis of 2 randomized clinical trialsexternal icon. Xia et al. JAMA (August 13, 2020).
Key findings:
- In the Phase 1 trial, geometric mean titers (GMTs) of neutralizing antibodies (NAbs) to SARS-CoV-2 were 316 (95% CI 218-457), 206 (95% CI 123-343), and 297 (95% CI 208-424) in low-, medium-, and high-dose groups, respectively (Figure).
- In the Phase 2 trial, GMTs were 121 (95% CI 95-154) after 2 medium-dose injections 14 days apart and 247 (95% CI 176-345) after 2 injections 21 days apart.
- Adverse reactions were mild, self-limited, and infrequent (15%), usually injection site pain or fever.
Methods: Interim analysis of ongoing double-blind, placebo-controlled, Phase 1 and 2 inactivated virus vaccine trials in adults aged 18-59 years. Phase 1 assigned 96 participants to receive 2.5, 5, or 10 μg of vaccine with alum adjuvant or alum only at 0, 28, and 56 days. Phase 2 randomized 224 participants to 5 μg vaccine or alum only at 0 and 14 or 0 and 21 days. NAbs measured at 14 days after the final vaccination in both trials. Limitations: Antibody responses tested, but not level of protection from SARs CoV-2 infection.
Implications: Patients had at most mild adverse reactions to inactivated virus vaccine. Immunogenicity to SARS-CoV-2 was demonstrated. Larger Phase 3 trials will be needed to determine efficacy and longer-term risk of any adverse events.
Figure:
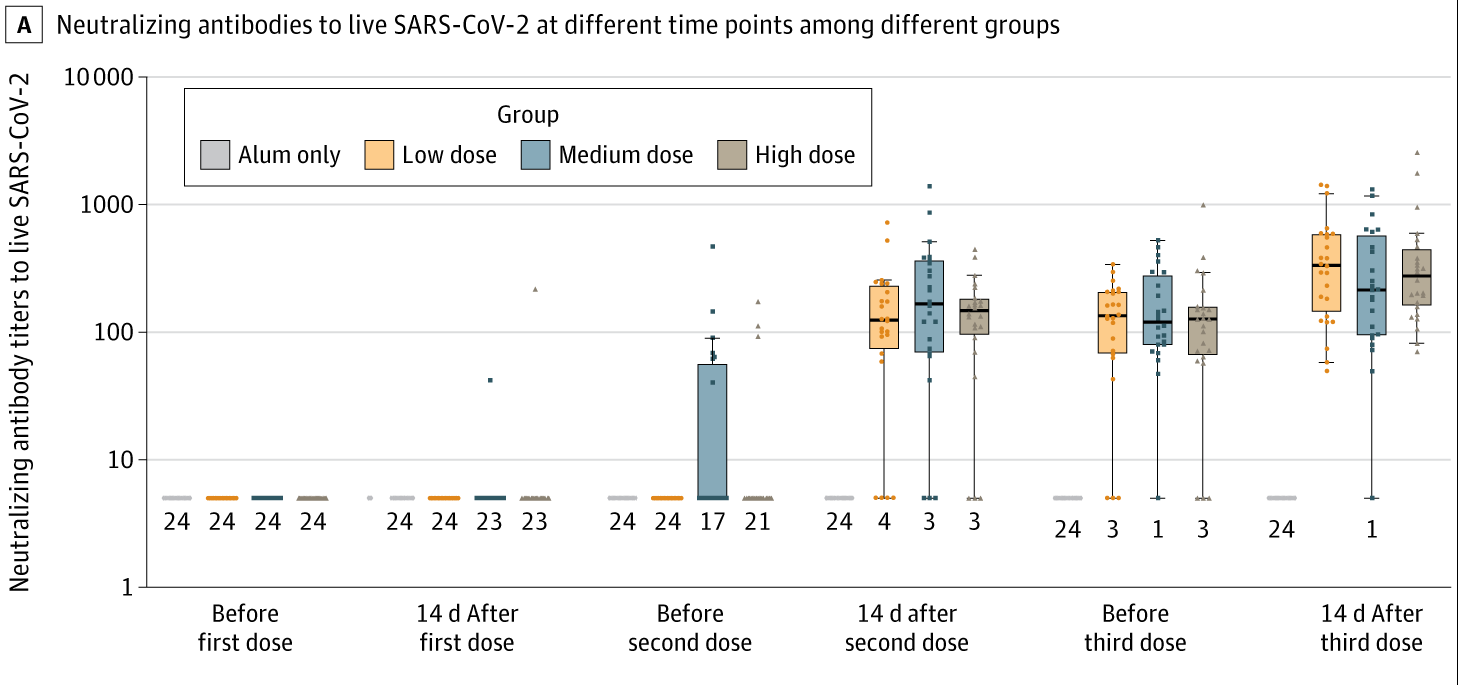
Note: Adapted from Xia et al. NAbs to live SARS-CoV-2 among aluminum hydroxide (alum)-only, low-dose, medium-dose, and high-dose groups in the phase 1 trial. Dots represent individual participant values. Boxplots show the 25th, 50th (median), and 75th percentiles. Whiskers extend to the farthest values within 1.5 × the interquartile range beyond the 25th and 75th percentiles. Numbers at the bottom indicate number of participants at the lowest measurable value.
New Tools for Policy and Practice
- Carmody et al. Football-specific strategies to reduce COVID-19 transmission.external icon British Journal of Sports Medicine. Infographics on strategies to reduce the risk of SARS CoV-2 transmission during soccer-related play. Could be relevant to other field sports.
- Vogels et al. SalivaDirect: Simple and sensitive molecular diagnostic test for SARS-CoV-2 surveillancepdf iconexternal icon. medRxiv. An FDA EUA-approved SARS-CoV-2 testing protocol of saliva showing high level of agreement with NP swab.
- Krauskopf et al. World Health Organization Academy: COVID-19 learning and WHO info mobile appsexternal icon. The Journal of Nurse Practitioners. COVID-19 related updates to a freely available app developed by WHO for healthcare providers. Available in for iOS and Android operating systems.
- Marvel et al. The COVID-19 Pandemic Vulnerability Index (PVI) Dashboard: monitoring county level vulnerabilityexternal icon. medRxiv. Describes a free online dashboardexternal icon that tracks 12 county-level scoring indicators designed to assist local decision-making regarding COVID-19 pandemic response.
Treatment-Related Reviews and Meta-Analyses
- Fan et al. Chinese herbal medicine for COVID-19: Current evidence with systematic review and meta-analysis.external icon Journal of Integrative Medicine. Meta-analysis of 7 studies showing additive benefit of Chinese herbal medicine to standard medical care on some inflammatory markers and lung CT scans.
- Vafea et al. Chest CT findings in asymptomatic cases with COVID-19: A systematic review and meta-analysis.external icon Clinical Radiology. Seven studies of persons with asymptomatic COVID-19 with positive chest CT. In Many became symptomatic later.
- Porfidia et al. Venous thromboembolism in patients with COVID-19: Systematic review and meta-analysis.external icon Thrombosis Research. In a meta-analysis of 30 low-quality studies, evidence suggests VTE may be a frequent complication in hospitalized patients with COVID-19 and require prompt diagnostic testing.
Epidemiology
- La Rosa et al. SARS-CoV-2 has been circulating in northern Italy since December 2019: Evidence from environmental monitoring.external icon Science of Total Environment. Epidemiology of wastewater tested for SARS CoV-2 virus in Northern Italy between October 2019 and February 2020. Positive tests occurred much earlier than previously thought. Good demonstration of the utility of sewage monitoring for community public health surveillance.
- Belmin et al. Coronavirus Disease 2019 Outcomes in French Nursing Homes That Implemented Staff Confinement With Residents. external iconJAMA Network Open. Describes lower rates of COVID-19 in 17 French nursing homes where staff voluntarily self-quarantined in the facility compared with other nursing homes from March-April 2020.
- Faust et al. Comparison of Estimated Excess Deaths in New York City During the COVID-19 and 1918 Influenza Pandemics.external icon JAMA Network Open. Overall excess mortality in NYC during the peak of 1918 H1N1 influenza pandemic was higher than in the first 2 months of COVID-19. Rate of rise in deaths from pre-pandemic levels was substantially greater in early COVID-19 months than in 1918 pandemic.
Other Topics
- Van de Verrdonk et al. Outcomes Associated With Use of a Kinin B2 Receptor Antagonist Among Patients With COVID-19. external iconJAMA Network Open. Case-control study of 10 patients with COVID-19 treated with icatibant showing improved short-term oxygenation compared with matched controls.
- Kim et al. The architecture of SARS-CoV-2 transcriptomeexternal icon. Cell. The SARS-CoV-2 transcriptome and epitranscriptome reveal a complex array of viral transcripts with RNA modifications.
- Shapiro. Having Coronavirus Disease 2019 (COVID-19).external icon JAMA Cardiology. A brief perspective from a New York City ICU doctor who had COVID-19.
Disclaimer: The purpose of the CDC COVID-19 Science Update is to share public health articles with public health agencies and departments for informational and educational purposes. Materials listed in this Science Update are selected to provide awareness of relevant public health literature. A material’s inclusion and the material itself provided here in full or in part, does not necessarily represent the views of the U.S. Department of Health and Human Services or the CDC, nor does it necessarily imply endorsement of methods or findings. While much of the COVID-19 literature is open access or otherwise freely available, it is the responsibility of the third-party user to determine whether any intellectual property rights govern the use of materials in this Science Update prior to use or distribution. Findings are based on research available at the time of this publication and may be subject to change.

