COVID-19 Science Update released: July 24, 2020 Edition 33

The COVID-19 Science Update summarizes new and emerging scientific data for public health professionals to meet the challenges of this fast-moving pandemic. Weekly, staff from the CDC COVID-19 Response and the CDC Library systematically review literature in the WHO COVID-19 databaseexternal icon, and select publications and preprints for public health priority topics in the CDC Science Agenda for COVID-19 and CDC COVID-19 Response Health Equity Strategy.
Here you can find all previous COVID-19 Science Updates.
Although non-pharmaceutical interventions such as social distancing and use of masks and cloth face coverings have mitigated the course of the COVID-19 pandemic, the most effective long-term solution remains an efficacious vaccine. Below, we summarize the results from two Phase II vaccine trials for preventing SARS-CoV-2 infection.
PEER-REVIEWED
Safety and immunogenicity of the ChAdOx1 nCoV-19 vaccine against SARS-CoV-2: A preliminary report of a phase 1/2, single-blind, randomised controlled trialexternal icon. Fogelatti et al. Lancet (July 20, 2020; Correctionexternal icon on August 13, 2020).
Key findings:
- Single dose of vaccine elicited both humoral and cellular responses against SARS-CoV-2.
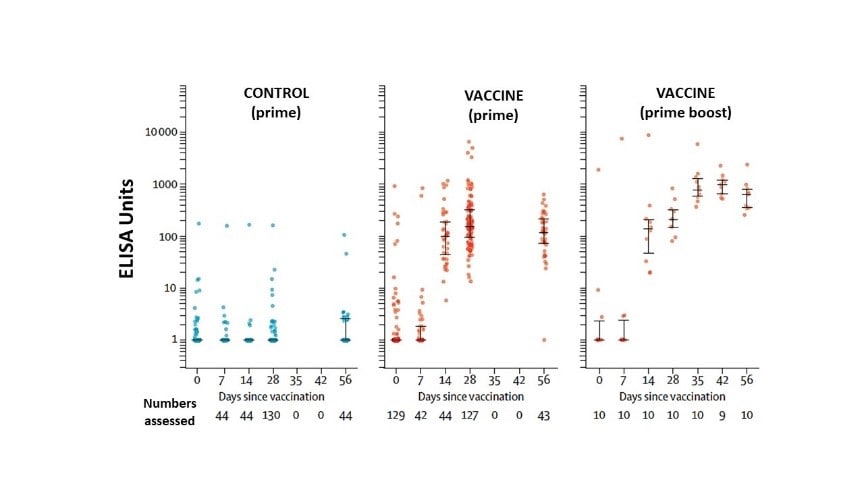
- Antibodies against SARS-CoV-2 spike protein peaked by day 28 (median 157 ELISA units (EU), IQR 96–317; n = 127) and remained elevated to day 56 (119 EU, 70–203; n = 43).
- The 10 participants receiving a booster dose showed antibodies rising to 639 EU (IQR 360–792) at day 56 (Figure 1).
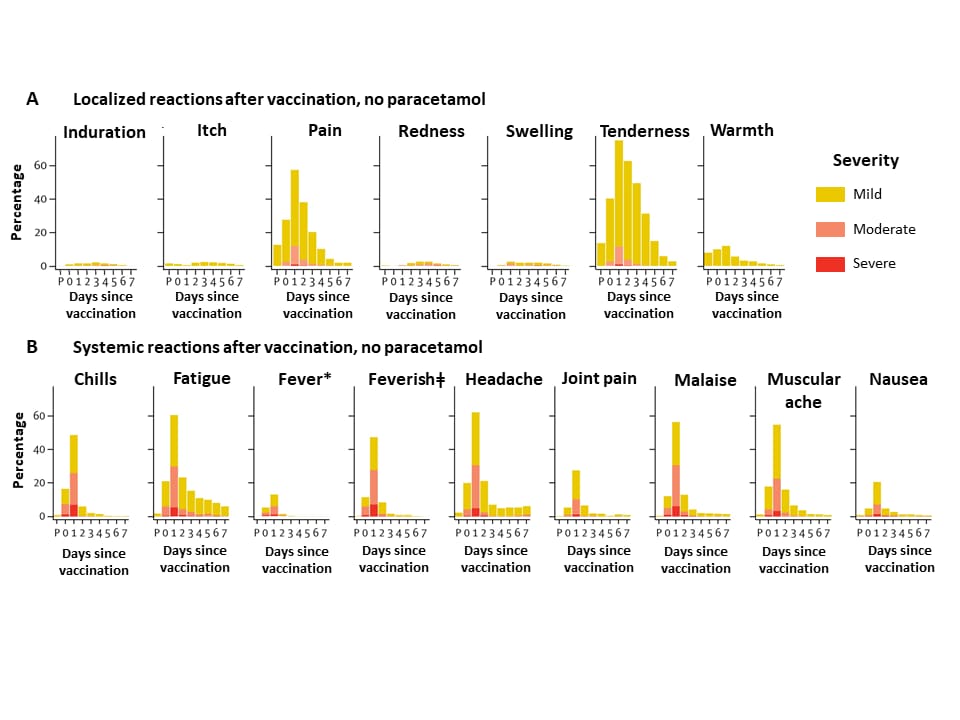
- Safety profiles indicated the vaccine was adequately tolerated (Figure 2).
- Primary adverse events reported were injection site tenderness (82%) and headaches (67%) by 7 days post-vaccination. Symptoms were mostly mild to moderate.
- Paracetamol reduced vaccine-associated localized and systemic reactions.
Methods: Phase 1/2, single-blind, randomized controlled trial of chimpanzee adenovirus-vectored vaccine (ChAdOx1 nCoV-19) to prevent SARS-CoV-2 infection conducted in five sites in the UK, between April 23 and May 21, 2020. Adults (N = 1,077) ages 18-55 years with no history of laboratory-confirmed infection or symptoms of infection received either vaccine expressing the SARS-CoV-2 spike protein (n = 543) or a meningococcal conjugate vaccine as control (n = 534). Ten individuals in active arm (non-randomized and unblinded) also received a booster at 28 days. After May 6, all participants received paracetamol before vaccination. Limitations: Vaccine administration restricted to healthy individuals (mostly White); short follow-up to date.
Figure 1
Note: Adapted from Fogelatti et al. SARS-CoV-2 IgG response by standardized ELISA units to spike protein in trial participants by group. ELISA units are measured on a log scale. Whisker bars represent the median and interquartile range. Licensed under CC-BY-NC-ND 4.0.
Figure 2
Note: Adapted from Fogelatti et al. Localized (A) and systemic (B) adverse events 7 days after vaccination with ChAdOx1 nCoV-19 as recorded by participants. The first point on the x-axis (P) is the time of vaccination, and the remaining points indicate days 1-7 thereafter. Data profiles for vaccination with paracetamol for both local and systemic events show lower proportions reporting adverse events. Control vaccine (not shown) showed typically lower proportions of participants reporting adverse events. *Mild: 38·0°C to <38·5°C; moderate: 38·5°C to <39·0°C; severe: ≥39·0°C. ǂSelf-reported feeling of feverishness. Licensed under CC-BY-NC-ND 4.0.
Immunogenicity and safety of a recombinant adenovirus type-5-vectored COVID-19 vaccine in healthy adults aged 18 years or older: a randomised, double-blind, placebo controlled, phase 2 trialexternal icon. Zhu et al. Lancet (July 20, 2020).
Key findings:
- At day 28, receptor binding domain (RBD)-specific antibodies developed in 96% and 97% of volunteers in the higher and lower vaccine dose arms, respectively.
- Both doses of the vaccine induced significant neutralizing antibody responses.
- The most common reported systemic reactions in the lower and higher dose groups were fatigue, (reported by 42% and 34%, respectively), fever (32% and 16%, respectively) and headache, (28% and 29% respectively).
- 9% of participants receiving the higher dose had severe (grade 3) adverse reactions (AEs); this incidence was significantly higher than that among persons receiving the lower dose vaccine (p = 0.0011) or placebo (p = 0.0004) with fever as the most commonly reported grade 3 AE.
Methods: Randomized, double-blind, placebo-controlled phase 2 trial of the Ad5-vectored COVID-19 vaccine in a single center in Wuhan, China, between April 11 and16, 2020. HIV-negative adults aged 18 years or older and SARS-CoV-2 infection-free were assigned to receive a single injection intramuscularly in the arm. 253 participants received 1×10¹¹ viral particles/ml, 129 received 5×10¹⁰ viral particles/ml and 126 received placebo. Endpoints were safety at 14 days, antibody to RBD and neutralizing antibody responses at day 28. Limitations: Trial started before the full analysis of data from the phase 1 study was available, and that may have resulted in lack of power to show differences between groups; single site so baseline anti-Ad5 immunity in participants may not be representative of other locations and superior immunogenicity may be seen in a population with lower pre-existing anti-Ad5 immunity; no children in the study; data reported only until 28 days of after vaccination.
Implications for 2 studies (Fogelatti et al. & Zhu et al.): Limitations notwithstanding, vaccine products in both trials were safe and resulted in neutralizing antibodies at 28 days. Boosting for the ChAdOx1 nCoV-19 vaccine (Fogelatti et al.) increased antibody responses. Results support ongoing current Phase 3 efficacy trials.
PEER-REVIEWED
Outcomes of universal COVID-19 testing following detection of incident cases in 11 long-term care facilitiesexternal icon. Bigelow et al. JAMA Internal Medicine (July 14, 2020).
Key findings:
- Universal testing of 893 residents revealed an additional 354 (39.6%) people testing positive for SARS-CoV-2 beyond 153 people testing positive on the basis of symptoms:
- Universal testing increased the number of persons testing positive from 153 to 507 (231% increase).
- 4% of all positive cases were asymptomatic in this elderly population.
- Within 14 days of testing (in 7 facilities, N=426):
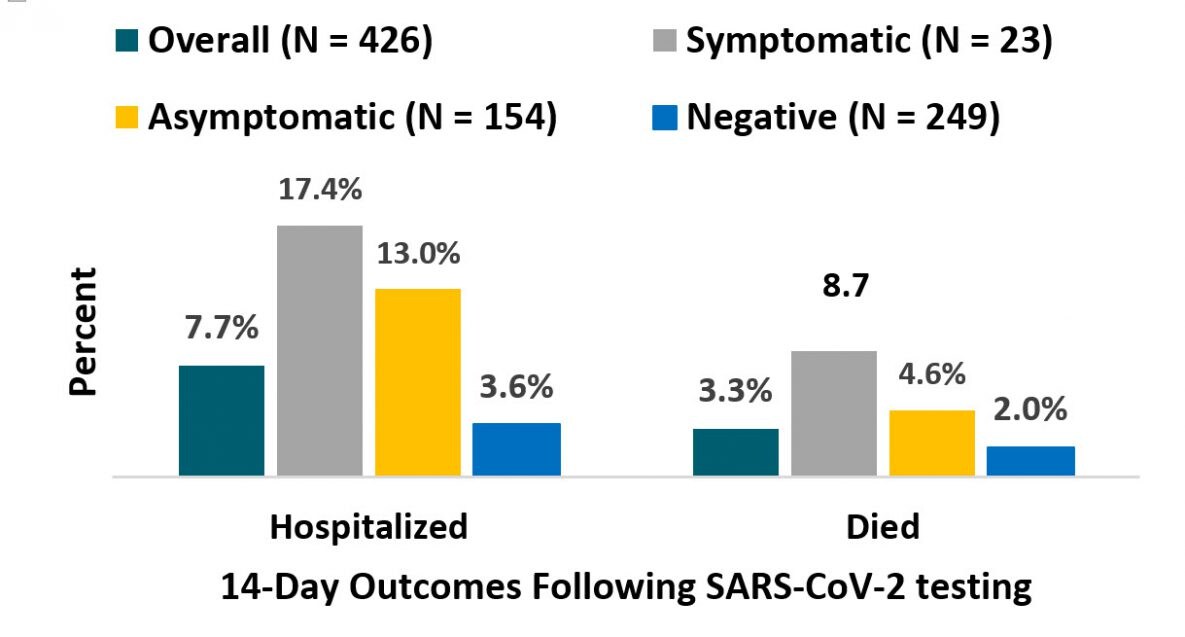
- 4% symptomatic positive cases were hospitalized; 8.7% died (Figure).
- 0% asymptomatic positive cases were hospitalized; 4.6% died (Figure).
- 6% of negative cases were hospitalized, 2.0% died (Figure).
Methods: Universal testing via NP swabs was conducted in 11 long-term care facilities in Maryland where testing had been targeted based on symptoms. Follow-up was conducted at 7 facilities following universal point-prevalence testing to describe 14-day outcomes (hospitalization and mortality). Limitations: Symptom status was based on staff reports; only 7 facilities were included in follow-up; attributable cause for the 2-week outcomes for persons who tested negative were not described.
Implications: Symptom-based testing may miss a substantial number of cases in residential facilities due to high rates of asymptomatic cases and may not be adequate for outbreak-control efforts in these settings.
Figure:
Note: Adapted from Bigelow et al. Residents of 7 long-term care facilities in Maryland with hospitalization and death associated with COVID-19 within 14 days of SARS-CoV-2 testing. Percentages shown include outcomes for: Overall, positive cases that were Symptomatic or Asymptomatic, and among those who tested Negative. Reproduced with permission from JAMA Intern Med. doi:10.1001/jamainternmed.2020.3738. Copyright©2020 American Medical Association. All rights reserved.
Physical distancing interventions and incidence of coronavirus disease 2019: Natural experiment in 149 countriesexternal icon. Islam et al. BMJ (July 15, 2020).
Key findings:
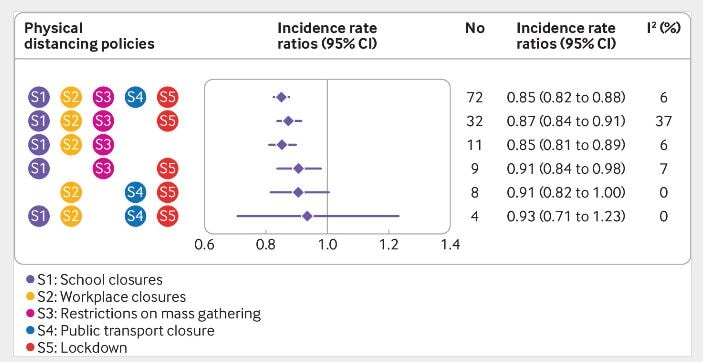
- All but 2 included countries implemented at least 3 of 5 physical distancing interventions (Figure).
- Introducing any intervention was associated with a 13% reduction in COVID-19 incidence (IRR 0.87, 95% CI 0.85-0.89).
- Public transport closure was not associated with additional reduction in incidence (Figure).
- Earlier implementation of lockdown was associated with a larger reduction in incidence (pooled IRR 0.86, 95% CI 0.84 to 0.89).
Methods: Natural experiment (149 countries) using interrupted time series analysis to model incidence of COVID-19 between January 1 and May 30, 2020; meta-analysis used to estimate the impact of 5 interventions: (1) school closure; (2) workplace closure; (3) restrictions on mass gatherings; (4) public transport closure; and (5) ‘lockdown’, including stay-at-home orders) on change in incidence. Limitations: Qualitative differences in the countries’ physical distancing measures may not have been adequately accounted for; compliance was not assessed.
Implications: Physical distancing interventions, implemented earlier in an outbreak, are associated with reductions in cases. These results may inform policy decisions as countries respond to current or future epidemic waves.
Figure:
Note: Adapted from Islam et al. Association among combinations of physical distancing interventions and change in incidence of COVID-19. No-number of countries implementing the intervention January 1-May 30, 2020; I2-estimate of the percentage of total variation across countries due to heterogeneity rather than chance. Licensed under CC-BY.
PREPRINTS (NOT PEER-REVIEWED)
Outbreak of COVID-19 and interventions in one of the largest jails in the United States: Cook County, IL, 2020external icon. Zawitz et al. medRxiv (July 14, 2020).
Key findings:
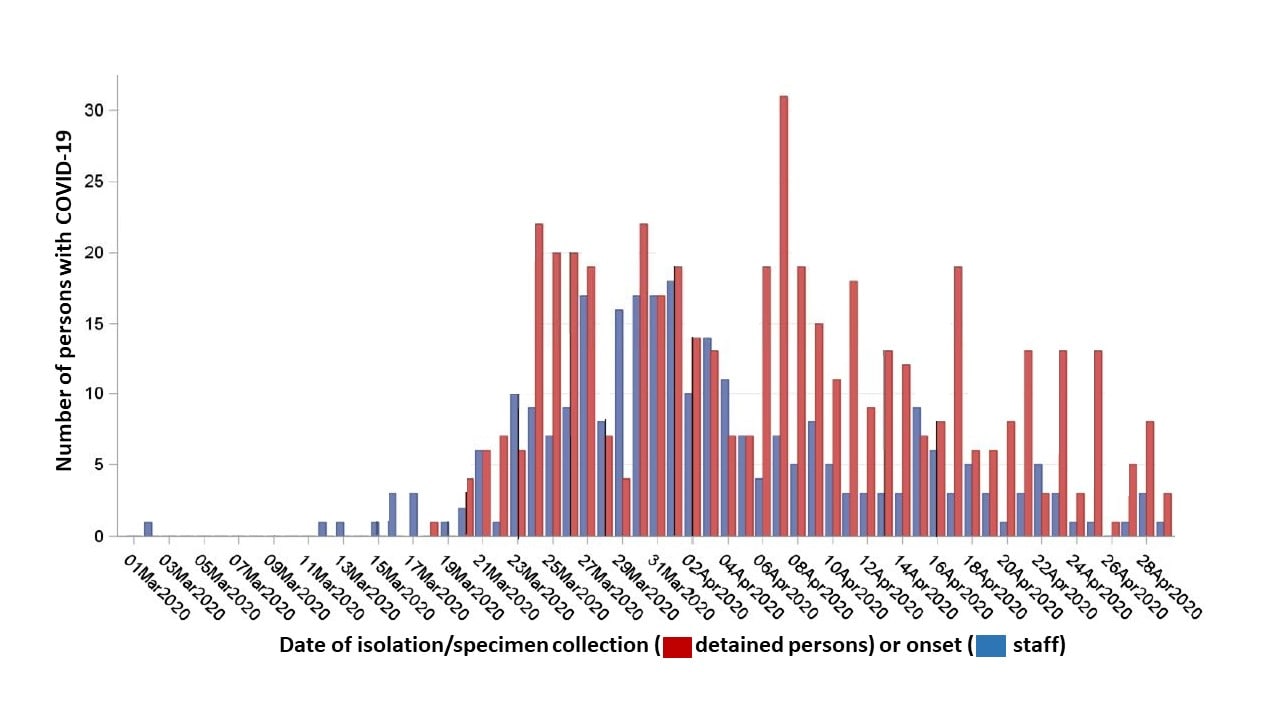
- 907 SARS-CoV-2 infections were detected among detained persons (n = 628) and staff (n = 279), with nine deaths:
- Staff cases began a median of 3 days prior to cases among detained persons.
- Cases increased rapidly, peaking on April 7 among detained persons; cases fell among detained persons 1 week after decreasing among staff (Figure 1).
- Interventions to improve infection control (handwashing, personal protective equipment use, enhanced disinfection) and physical distancing (single-occupancy cells, movement restrictions, stopping visitation) were associated with a reduction in new cases.
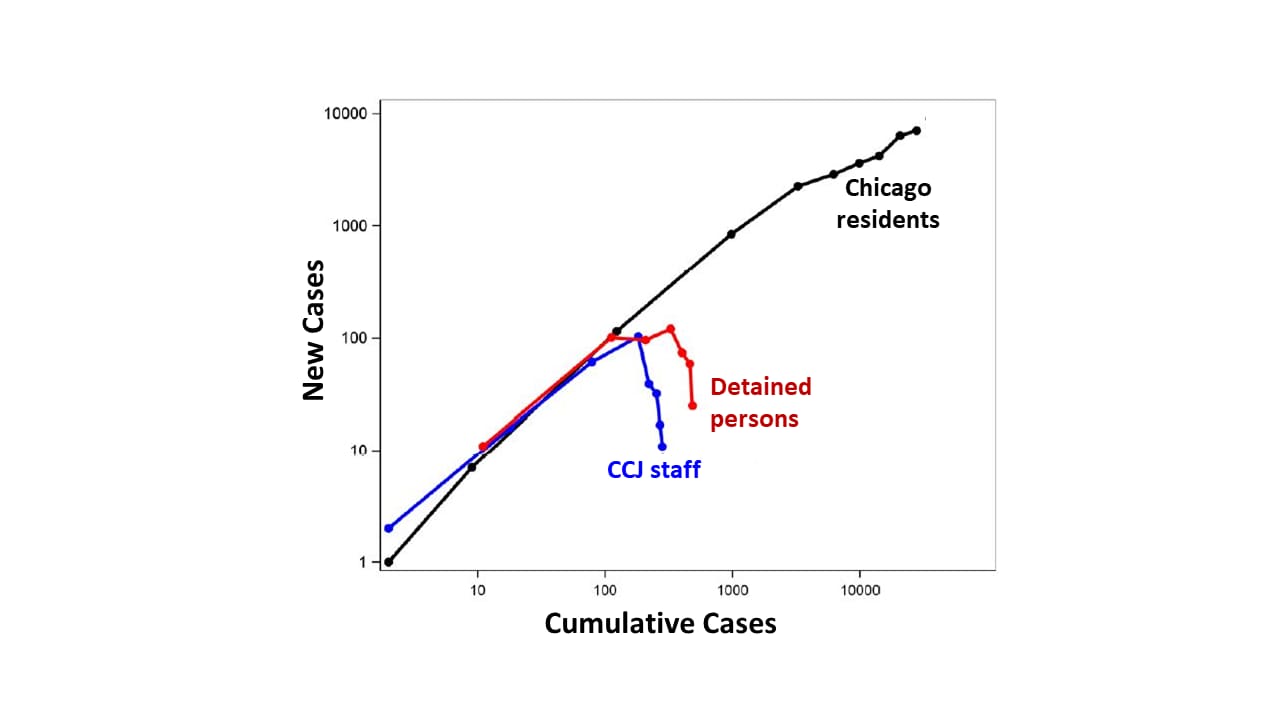
- New infections in the jail decreased while they were rising among Chicago residents (Figure 2).
Methods: Between March 1 and April 30, 2020, in Cook County Jail (CCJ), widespread SARS-CoV-2 testing and infection control interventions were implemented. All detained persons with COVID-19 symptoms received RT-PCR testing and were medically isolated for 14 days. Ratios of new cases to cumulative cases were calculated for each week among the jail’s staff and detained persons, as well as for residents of Chicago. Limitations: Not all staff were tested; comparative effectiveness of mitigation strategies cannot be assessed.
Implications: SARS-CoV-2 can spread rapidly in crowded settings and transmission can be reduced with widespread diagnostic testing and implementation of infection control and physical distancing
Figure 1:
Note: Adapted from Zawitz et al. Cases of COVID-19 by date of symptom onset among detained persons and staff—Cook County Jail. Used by permission from author.
Note: Adapted from Zawitz et al. Weekly ratios of new cases of SARS-CoV-2 infection to cumulative cases for Chicago residents, CCJ staff, and detained persons, represented by nodes, March 1-April 30. Used by permission from author.
Airborne transmission of SAR-CoV-2 via aerosol-sized droplets is a current topic of discussion as the evidence for airborne SAR-CoV-2 transmission is incomplete and hard to dissociate from other transmission routes. The potential for airborne transmission of SAR-CoV-2 exists when the appropriate circumstances align as shown by these epidemiological and modeling investigations.
PREPRINTS (NOT PEER-REVIEWED)
Airborne transmission of COVID-19: Epidemiologic evidence from two outbreak investigationsexternal icon. Shen et al. Pre-print at Researchgate (April 2020). Published as Community Outbreak Investigation of SARS-CoV-2 Transmission Among Bus Riders in Eastern Chinaexternal icon in JAMA Internal Medicine (September 1, 2020).
Key findings:
- Outbreak #1: 23 COVID-19 cases were diagnosed after a bus trip that included an infected passenger but no cases were identified in a comparable bus trip with no infected passengers.
- Persons in the “exposed” bus were 41.5 times (95% CI 2.6–669.5) more likely to be infected with SARS-CoV-2 than persons in the “non-exposed” bus.
- Passengers in high-risk zones close to the infected passenger were not at higher risk of getting infected than those in the low-risk zones further from the infected passenger.
- Attack rate in the exposed bus of 34.3% (95% CI 24.1–46.3).
- Outbreak #2: 14/29 persons at a 2-day training workshop were diagnosed with COVID-19.
- Some workshop trainees reported poor air quality in the conference rooms.
- Attack rate in the training workshop = 48.3% (95% CI 31.4–65.6).
Methods: Risk assessment of 2 outbreaks in China, January 2020. Outbreak #1: A driver and 66 passengers in a bus with the air conditioning system on re-circulating mode were exposed to SARS-CoV-2 from a pre-symptomatic infected passenger (index patient). High-risk zones were seating areas within 2 meters (Classification 1) or 2 rows (Classification 2) of the index patient. A second bus with no infected people on board was used as a comparison. Outbreak #2: 29 persons, attending a 2-day training workshop in two conference rooms with central air conditioning set to indoor re-circulating mode were exposed to SARS-CoV-2 from a minimally symptomatic infected trainee. All exposed persons were tested with RT-PCR or viral genome sequencing. Limitations: Transmission through close contact or touching of inanimate objects cannot be ruled out; bus had windows but unclear if they were opened at any point.
Figure:
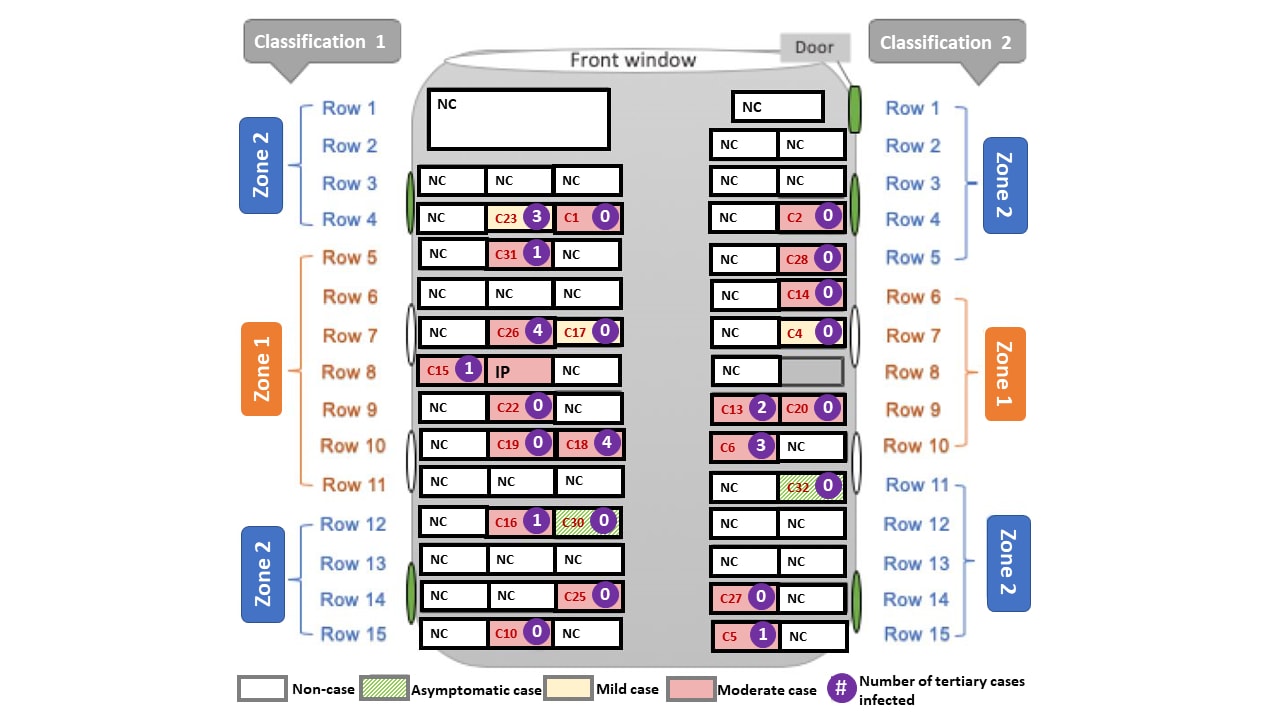
Note: Adapted from Shen et al. Schematic diagram of exposed bus showing: high risk zones (Zone 1) and low risk zones (Zone 2) by 2 classifications; severity of cases (asymptomatic, mild, moderate); number of tertiary cases infected by each case; proximity to four side windows and door that could be opened for fresh air (green oval). The index patient (IP) sat in the 8th row. IP-index patient; NC-non-case; C#-case number in red. Passengers in high-risk zones were not at higher risk of getting infected than those in the low-risk zones using either Classification 1 (RR: 1.6, 95% CI: 0.8–3.2) or Classification 2 (RR: 1.8, 95% CI: 0.9–3.3). Reproduced with permission from JAMA Intern Med. doi:10.1001/jamainternmed.2020.5225. Copyright©2020 American Medical Association. All rights reserved.
Estimate of airborne transmission of SARS-CoV-2 using real time tracking of health care workersexternal icon. Hota et al. medRxiv (July 16, 2020).
Key findings:
- 152 COVID-19 patients had 1,198 interactions over 19,503 minutes (325 hours) with 181 healthcare workers (HCWs).
- 4 HCWs became infected (prevalence of infection = 2.21%).
- Estimated SARS-CoV-2 airborne transmissibility=0.225 quanta per hour (q), well below other well-characterized airborne pathogens:
- Rhinovirus (q = 5), Tuberculosis (q = 12.7), SARS-CoV-1 (q = 57), and Influenza (q = 100).
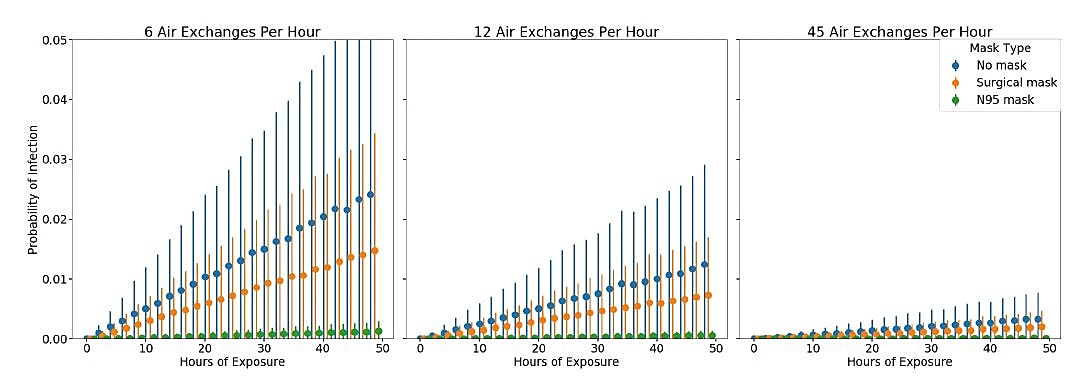
- Increasing the number of air exchanges per hour was most effective in reducing the risk of potential airborne transmission in the model (Figure).
Methods: HCW–patient interactions between March 18 and 31, 2020 were tracked with real-time location software badges. Monte Carlo simulations using tracked interaction data modelled the probability of SARS-CoV-2 airborne transmissibility to HCWs (q, quanta = number of infectious particles shed by an infectious source per hour into a viable droplet nuclei) for various levels of ventilation (air exchanges per hour). Limitations: Model assumes exposure risk is homogeneous in the environment around the infection source and that susceptibility is similar among all contacts; does not account for acquisition of SARS-CoV-2 infection through community exposures; asymptomatic cases were not included.
Figure:
Note: From Hota et al. Simulation to estimate risk of infection based on duration of exposure, mask type, and room air exchanges. Scenarios with air exchange rates of 6 and 12 were based on CDC recommendations; 45 was used for a room with 12 air exchanges and HEPA filtering plus UV light. Used by permission from author.
Implications for both studies (Shen et al. & Hota et al.): Limited air exchange in poorly ventilated small spaces and close or prolonged exposure to COVID-19 cases appears to have been conducive to SARS-CoV-2 transmission that may have been airborne. Modeling demonstrated that airborne SARS-CoV-2 transmission was reduced with increased ventilation. Ventilation-related interventions to improve air quality (as described by Morawska et al. How can airborne transmission of COVID-19 indoors be minimised?external icon) include increased air exchanges, particle filtration, air disinfection, and avoiding air recirculation. These interventions may be used with other approaches (social distancing, use of face-coverings, hand-hygiene, and cleaning of hand-touch sites) to minimize risk of contact and droplet transmission.
PEER-REVIEWED
Clinical features of COVID-19 in patients with essential hypertension and the impacts of renin-angiotensin-aldosterone system inhibitors on the prognosis of COVID-19 patientsexternal icon. Pan et al. Hypertension (July 13, 2020).
Key findings:
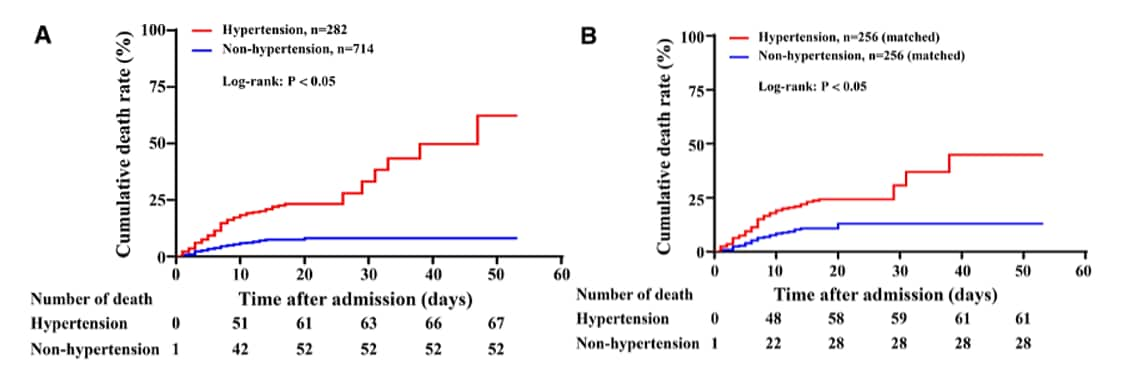
- Hypertension was independently associated with all-cause mortality in patients with COVID-19, (hazard ratio, 95% CI, unmatched cohort [1.80, 1.20–2.70]; matched cohort [2.24, 1.36–3.70]) after adjusting for age, sex, other comorbidities and complications.
- Mortality of patients in the renin angiotensin aldosterone (RAAS) inhibitor group (9.8% versus 26.1%) was significantly lower than that of patients in the non-RAAS inhibitor group.
Methods: Assessment of impact of hypertension in COVID-19 patients (n = 996) hospitalized between January 4 and February 14, 2020, including 282 patients with hypertension and 714 patients without hypertension. Hypertension was defined as systolic blood pressure >140mm Hg or diastolic pressure >90mm Hg. Patients with hypertension were stratified by prior use of RAAS inhibitors (n = 41) or not (n = 241). Propensity score-matched analysis (1:1 matching) was used to adjust the imbalanced baseline variables between the 2 groups. Limitations: Single site.
Implications: Hypertension may be an independent risk factor for all-cause mortality in patients with COVID-19. Hypertensive patients who have previously used RAAS inhibitors may have a better prognosis than those who have not.
Figure:
Note: Adapted from Pan et al. Comparison of risks for death in patients with or without hypertension, before (A) and after propensity score matching (B). Number of deaths indicates cumulative number of deaths at each time point. Permission request in process. Pan et al., Clinical features of COVID-19 in patients with essential hypertension and the impacts of renin-angiotensin-aldosterone system inhibitors on the prognosis of COVID-19 patients, Hypertension, Volume 76, Pages 732-741, https://doi.org/10.1161/HYPERTENSIONAHA.120.15289external icon; Copyright 2020 American Heart Association, Inc.
Tocilizumab for treatment of mechanically ventilated patients with COVID-19external icon. Somers et al. Clinical Infectious Diseases. (July 11, 2020).
Key findings:
- Patients who received tocilizumab (an IL-6 receptor antagonist) had lower mortality and improved outcomes.
- 45% reduction in death, hazard ratio 0.55 (95% CI 0.33-0.90).
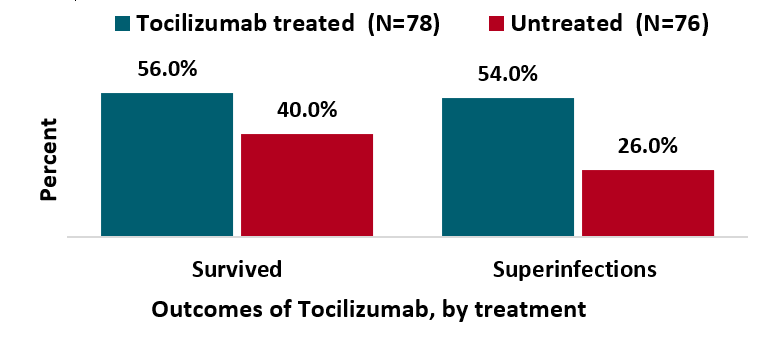
- Patients who received tocilizumab had higher rates of superinfection (54% vs 26%; p <0.001), driven primarily by ventilator-associated pneumonia and bloodstream infections.
Methods: Patients with COVID-19 requiring mechanical ventilation, between March 9 and April 20, 2020, who received tocilizumab (n = 78) were compared with tocilizumab-untreated controls (n = 76). Multivariable Cox regression with propensity score weighting was employed to adjust for differences between the groups. Limitations: Non-randomized study with multiple potential decision points for tocilizumab use; small sample; single location.
Implications: Use of immunomodulating drugs such as tocilizumab may improve outcomes of severe COVID-19 illness but increase the risk of other infections (superinfections) due to immunosuppression. Randomized controlled trials are needed to confirm these findings.
Figure:
Note: Adapted from Somers et al. Proportion of patients who were and were not treated with tocilizumab who survived to discharge and had superinfections. Licensed under CC-BY-NC-ND 4.0.
PEER-REVIEWED
Blood type and outcomes in patients with COVID-19external icon. Latz et al. Annals of Hematology (July 13, 2020)
Key findings:
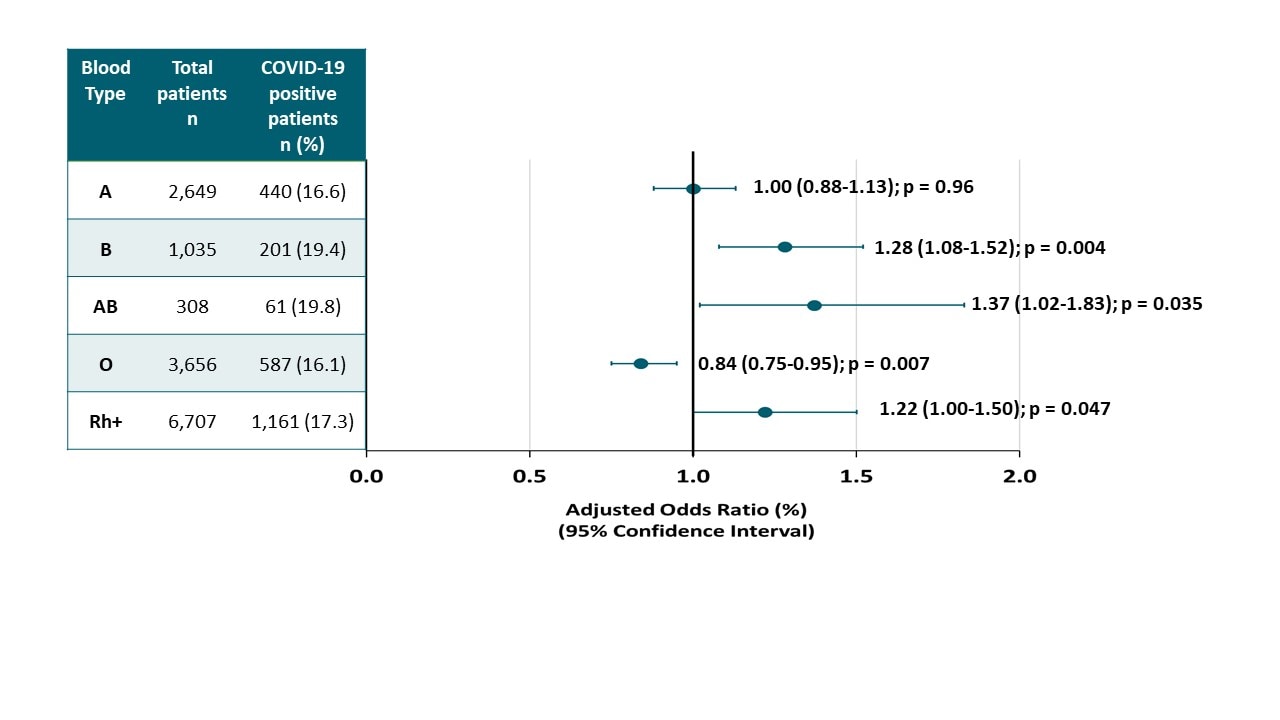
- Patients with blood types B and AB were more likely to test positive for SARS-CoV-2, as were those who were Rh+. Patients with blood type O were less likely to test positive (Figure).
- Blood type was not associated with risk of progression to severe COVID-19 requiring intubation, death, or with higher peak levels of inflammatory markers.
Methods: Blood from 1,289 COVID-19 patients and 6,359 non-COVID-19 patients at 5 Massachusetts hospitals between March 6 and April 16, 2020 was tested to determine the association between ABO blood type and SARS-CoV-2 infection as well as severity of COVID-19 as defined by intubation or death. Limitations: Potential unmeasured confounders.
Implications: Evidence supports that blood type is associated with susceptibility to SARS-CoV-2 infection, although the strength of the association is small. No evidence suggests blood type affects illness severity or outcomes from SARS-CoV-2 infection.
Figure:
Note: Adapted from Latz et al. Adjusted odds ratios (AOR) for diagnosed COVID-19, by blood type (p value for overall differences among groups was 0.036). Available via Nature Public Health Emergency Collection through PubMed Central.
Rapid implementation of SARS-CoV-2 sequencing to investigate cases of health-care associated COVID-19: a prospective genomic surveillance studyexternal icon. Meredith et al. Lancet Infectious Diseases (July 14, 2020).
Key findings:
- Among 159 patients, 35 clusters were identified by viral sequencing with cluster sizes of 2 to 18 persons, some of whom were health care providers.
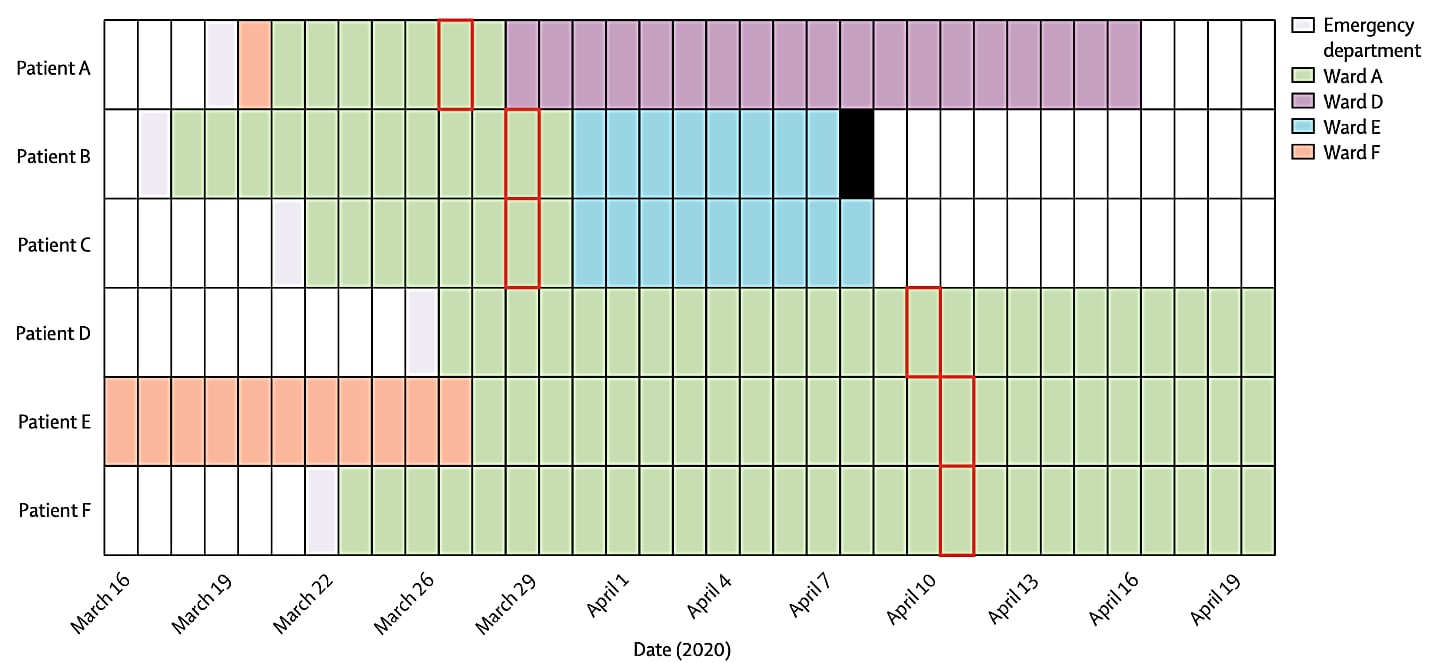
- Several clusters of healthcare-setting-acquired infections were identified including among renal dialysis patients, transplant patients and one cluster that involved multiple wards of one hospital (Figure).
Methods: Epidemiologic analysis and rapid sequencing of SARS-CoV-2 of samples from 299 persons in one hospital in Southeast England (both patients and health care providers), between March 13 and April 24, 2020. Limitations: Low SARS-CoV-2 sequence diversity makes interpretation of clusters challenging, as samples could be identical by chance rather than because of an epidemiologic link; all genomes from samples were not sequenced so transmission events may have been missed.
Implications: Real-time genomic sequencing and epidemiological analysis enable detection of complex transmission chains of SARS-CoV-2 not otherwise recognized. This information can be used to implement infection-control interventions to reduce spread in communities and health-care settings.
Figure:
Note: Adapted from Meredith et al. Six COVID-19 with genetically-related viral isolates. All patients were admitted for more than 7 days before specimen collection and were considered likely to have hospital-acquired infection. The date of the first positive sample collection is shown with a red box and patient death date indicated with a solid black bar. This article was published in Lancet Infectious Diseases, Vol 20, Meredith et al., Rapid implementation of SARS-CoV-2 sequencing to investigate cases of health-care associated COVID-19: a prospective genomic surveillance study, P1263-1272, Copyright Elsevier 2020. This article is currently available at the Elsevier COVID-19 resource center: https://www.elsevier.com/connect/coronavirus-information-centerexternal icon.
Clinical Treatment and Management
- Ok et al. Predictive values of blood urea nitrogen/creatinine ratio and other routine blood parameters on disease severity and survival of COVID-19 patients.external icon Journal of Medical Virology. Evaluation of the blood urea nitrogen/creatine and neutrophil to lymphocyte ratios might help identify high‐risk cases with COVID‐19.
- Fuglebjerg et al. Silent hypoxia in patients with SARS CoV-2 infection before hospital discharge.external icon International Journal of Infectious Diseases. Description of exercise-induced hypoxia (SpO2 <90%) and subjective dyspnea elicited by a 6-minute walking test in COVID-19 patients without pre-existing pulmonary or cardiac disease prior to discharge from hospital.
- Liu et al. Predictive performance of SOFA and qSOFA for in-hospital mortality in severe novel coronavirus disease.external icon American Journal of Emergency Medicine. Sequential Organ Failure Assessment (SOFA) scores in critically ill COVID-19 patients may predict mortality risk.
Clinical Manifestations and Complications
- Gonzalez-Pacheco et al. Bilateral spontaneous pneumothorax in SARS-CoV-2 infection: A very rare, life-threatening complication.external icon American Journal of Emergency Medicine. Describes an instance of bilateral spontaneous pneumothorax, a very rare, but life-threatening complication of COVID-19.
- Somekh et al. Age-dependent sensory impairment in COVID-19 infection and its correlation with ACE2 expressionexternal icon. Pediatric Infectious Disease Journal. Among individuals who tested positive for coronavirus disease 2019, smell and taste sensations were significantly less impaired among children than among adults.
- Jimenez-Cauhe et al. Enanthem in patients with COVID-19 and skin rash.external icon JAMA Dermatology. Reports of enanthem in the mouth as a manifestation of COVID-19.
- Chen et al. Clinical characteristics in patients with SARS-CoV-2/HBV co-infectionpdf iconexternal icon. medRxiv. SARS-CoV-2 infection may cause liver function damage and patients with more severe outcomes in those with Hepatitis B Virus infection.
- Mahase et al. COVID-19: What do we know about “long covid”?external icon Commentary on the prevalence of fatigue, joint or chest pain, and other longer-term symptoms associated with COVID-19.
Prevention
- Wang et al. Association between universal masking in a health care system and SARS-CoV-2 positivity among health care workers.external icon In a large Massachusetts hospital system, universal masking was associated with lower rate of SARS-CoV-2 among HCWs, supporting effectiveness of universal masking policies.
- Li et al. Aerosol and environmental surface monitoring for SARS-CoV-2 RNA in a designated hospital for severe COVID-19 patients.external icon Epidemiology & Infection. Rigorous implementation of infection prevention and control procedures (cleaning) reduced aerosol and environmental-borne SARS-CoV-2 RNA in a hospital designed to care for COVID-19 patients.
Other Topics
- Zuo et al. Single-cell analysis reveals the function of lung progenitor cells in COVID-19 patients.pdf iconexternal icon In severe and critical cases of COVID-19, expansion of two classes of lung progenitor cells could influence alveolar cell regeneration and reestablishment of the epithelial barrier.
- Le Bert et al. SARS-CoV-2-specific T cell immunity in cases of COVID-19 and SARS, and uninfected controls.external icon Describes how presence of pre-existing memory T cells in humans includes the potential to recognize SARS-CoV-2, including CD4 and CD8 T cells reactive to SARS-NP 17 years after the 2003 outbreak.
- Palombi et al. Does the coronavirus (COVID-19) pandemic call for a new model of older people care? external iconFrontiers in Public Health. Among older people (>80y) participating in a community-based monitoring program in Rome and Genova that counteracts loneliness and social isolation, the mortality rate was lower than mortality rate among the general population in the 2 cities.
Disclaimer: The purpose of the CDC COVID-19 Science Update is to share public health articles with public health agencies and departments for informational and educational purposes. Materials listed in this Science Update are selected to provide awareness of relevant public health literature. A material’s inclusion and the material itself provided here in full or in part, does not necessarily represent the views of the U.S. Department of Health and Human Services or the CDC, nor does it necessarily imply endorsement of methods or findings. While much of the COVID-19 literature is open access or otherwise freely available, it is the responsibility of the third-party user to determine whether any intellectual property rights govern the use of materials in this Science Update prior to use or distribution. Findings are based on research available at the time of this publication and may be subject to change.
