COVID-19 Science Update released: May 1, 2020 Edition 9

The COVID-19 Science Update summarizes new and emerging scientific data for public health professionals to meet the challenges of this fast-moving pandemic. Weekly, staff from the CDC COVID-19 Response and the CDC Library systematically review literature in the WHO COVID-19 databaseexternal icon, and select publications and preprints for public health priority topics in the CDC Science Agenda for COVID-19 and CDC COVID-19 Response Health Equity Strategy.
Here you can find all previous COVID-19 Science Updates.
PEER-REVIEWED
Strong associations and moderate predictive value of early symptoms for SARS-CoV-2 test positivity among healthcare workers, the Netherlands, March 2020external icon. Tostmann et al. Eurosurveillance (April 23, 2020).
Key findings:
- 2% (90 of 803) of healthcare workers (HCW) tested positive for SARS-CoV-2.
- Most frequent symptoms were (Figure):
- when test-negative: cough (60%), sore throat (56%), and common cold (51%).
- when test-positive: headache (71%), general malaise (63%), and muscle ache (63%).
- A predictive model using only general non-respiratory symptoms with cut-off of ≥3 symptoms had 91.2% sensitivity and 55.6% specificity.
- General non-respiratory symptoms had stronger associations with SARS CoV-2 positivity than respiratory symptoms (e.g., cough or sore throat).
Methods: Hospital-based study of 803 HCW with symptoms suggestive of COVID-19 (response rate = 64%). Assessed symptoms associated with SARS-CoV-2 test positivity, developed a predictive model based on early symptoms from ~80% of study population, and applied it to the remainder of the population to estimate model’s performance: sensitivity (actual positives correctly identified as such), and specificity (actual negatives correctly identified as such). Limitations: Questionnaire expanded during study to account for new symptoms (e.g., anosmia), and only a subset of HCW were re-administered supplemental questions; potential non-participation bias; assay used is not specified but presumed to be RT-PCR for SARS-CoV-2 RNA.
Implications: General non-respiratory symptoms as well as eye pain and anosmia were strongly associated with SARS-CoV-2 test positivity. Assessment with only these symptoms had high sensitivity, may have utility to clear HCW to continue work, and could direct testing of HCW in settings with limited testing capacity.
Figure:
Note: Adapted from Tostmann et al. Frequency of general non-respiratory symptoms in HCW for 7 symptoms; significant difference (p<0.001) between positive vs. negative observed for all 7 symptoms. Licensed under CC BY 4.0.
Epidemiological and clinical characteristics of 26 asymptomatic SARS-CoV-2 carriersexternal icon. Pan et al. Journal of Infectious Diseases (April 22, 2020).
Key findings:
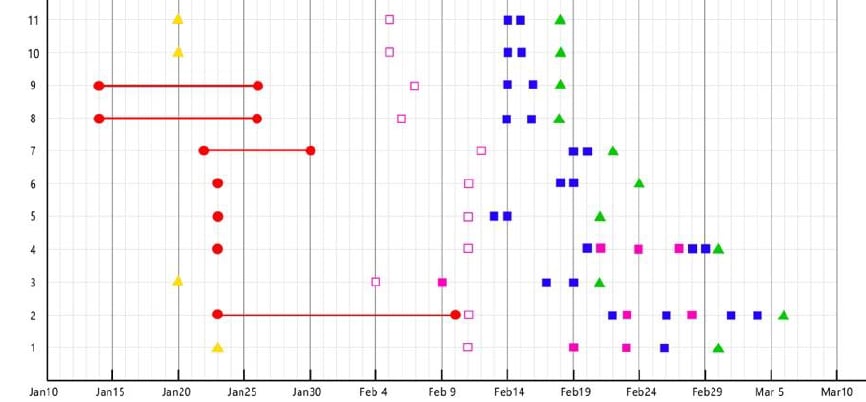
- In 26 asymptomatic SARS-CoV-2 carriers (Figure):
- Median period from presumptive exposure to diagnosis = 19 days.
- Median period from presumptive exposure to last positive nucleic acid test = 21.5 days.
- The period from diagnosis to negative nucleic acid test was shorter (p <0.01) for patients with no or minimum changes by chest CT than patients with typical ground-glass or patchy opacities on CT (7.5 vs 12.5 days), suggesting a relationship between illness severity and length of viral shedding.
- Two asymptomatic carriers had a single negative RT-PCR result followed by a positive result.
- Two asymptomatic carriers transmitted SARS-COV-2 to household members.
Methods: A descriptive study of clinical and epidemiologic characteristics of 26 persistently asymptomatic SARS-CoV-2 carriers with contact to confirmed cases or travel to Wuhan, China. These 26 persons were hospitalized so they could be isolated. Patients’ sputum and throat swab were tested for SARS-CoV-2 by RT-PCR. Limitations: Select population, so may not be generalizable; no comparative data from symptomatic people.
Implications: Asymptomatic carriers appear to have been diagnosed relatively late in their infection and to have extended periods with detectable SARS-CoV-2. Asymptomatic carriers with signs of COVID-19 by chest CT may shed virus longer. A single negative RT-PCR result may be insufficient to confirm resolution of SARS-CoV-2 infection.
Figure:
Note: Adapted from Pan et al. Timeline for the first 10 asymptomatic SARS-CoV-2 carriers, spanning period from contact with, or exposure to, the infection, or return home from Wuhan to hospital discharge. Y-axis indicates case number (showing 10 of 26 reported, as an example here). Cases 2 and 4 had a negative RT-PCR result followed by a positive. Available via Oxford University Press Public Health Emergency Collection through PubMed Central.
Connecting clusters of COVID-19: An epidemiological and serological investigationexternal icon. Yong et al. Lancet Infectious Diseases (April 21, 2020).
Key findings:
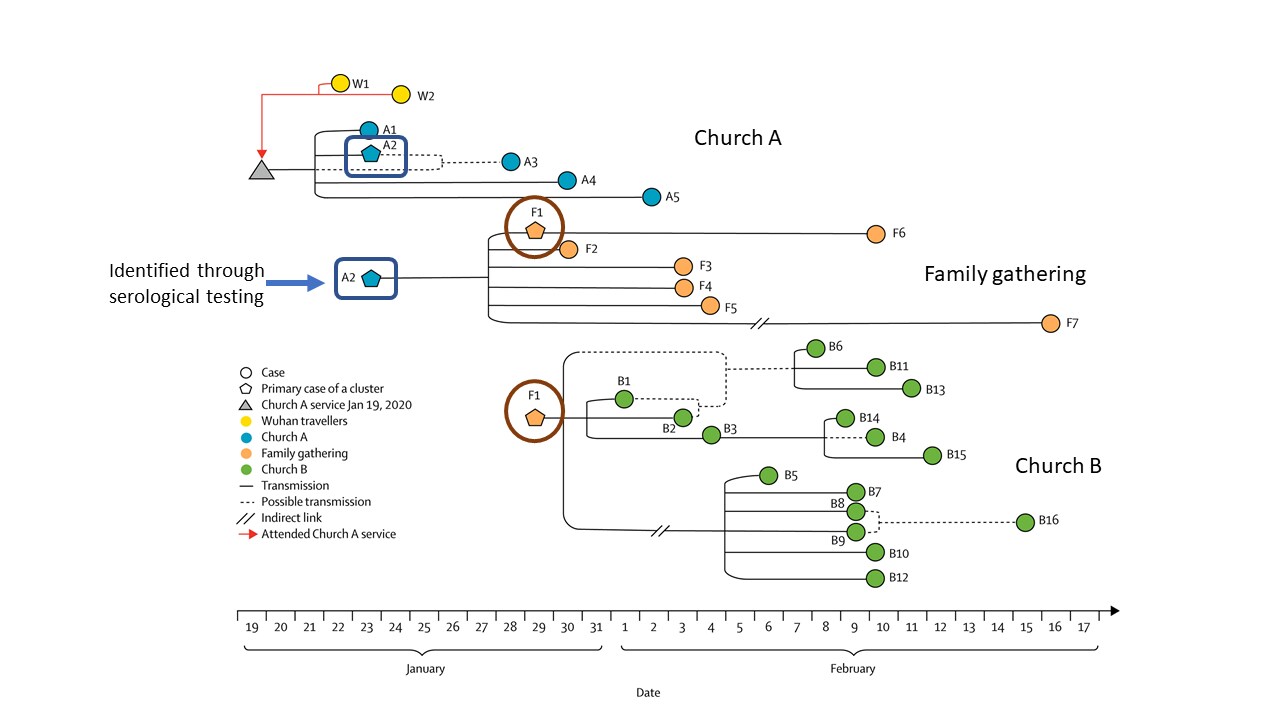
- Three clusters − comprised of 30 COVID-19 cases − were identified through contact tracing and testing: two in churches (Church A and Church B) and one at a family gathering.
- Included two cases who travelled to Wuhan, China prior to attending Church A (Figure)
- The link between Church A and Church B was identified through serological testing of a person who was RT-PCR negative for SARS-CoV-2 having recovered from prior infection.
Methods: Between January 31 and April 6, 2020, investigators in Singapore used a combination of RT-PCR, serological testing, and contact tracing to identify and confirm COVID-19 cases; find cases among close contacts; and establish links between cases. For the 3 COVID-19 clusters discovered, a transmission map was constructed.
Implications: Using a multipronged approach with both laboratory testing and contact tracing is important for identifying and breaking SARS-CoV-2 transmission chains. Without the inclusion of serological testing, the link between Church A and Church B may not have been identified.
Figure:
Note: Adapted from Yong et al. Transmission map of 30 COVID-19 cases connected within 3 linked clusters in Singapore (Church A, Church B, and family gathering), including 2 travelers to Wuhan, China. Person A2 (highlighted in the blue square) tested negative by RT-PCR but was identified through serological testing and was the link between Church A and Church B through person F1 (highlighted in the brown circle). This article was published in Lancet Infectious Diseases, Vol 20, Yong et al., Connecting clusters of COVID-19: An epidemiological and serological investigation, Pages 809-815, Copyright Elsevier 2020. This article is currently available at the Elsevier COVID-19 resource center: https://www.elsevier.com/connect/coronavirus-information-centerexternal icon.
PEER-REVIEWED
Temporal dynamics in viral shedding and transmissibility of COVID-19external icon He et al. Nature Medicine (April 15, 2020; Correctionexternal icon on August 7, 2020).
Key findings:
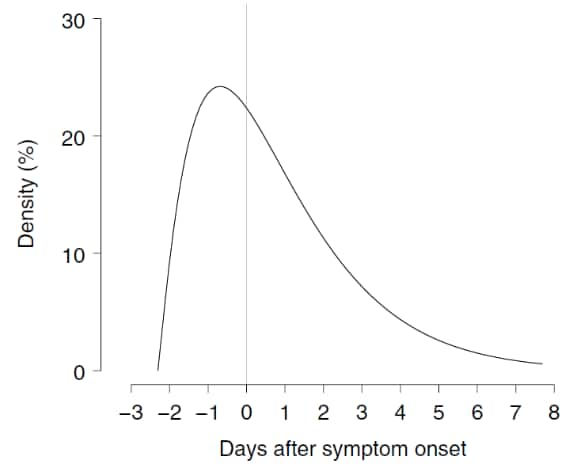
- Models estimated that infected persons can be infectious 2.3 days before symptom onset and that infectiousness peaks 0.7 days before symptom onset (Figure).
- Using the area under the curve, they estimated that 44% of secondary cases were infected before the index case had symptoms.
- No difference in viral shedding was observed by sex, age or disease severity.
Methods: Authors modeled SARS-CoV-2 infectiousness profiles based on patterns of viral shedding assayed from throat swabs collected from 94 hospitalized patients and infectiousness profiles from 77 transmission pairs with known dates of exposure and symptoms onset. They used these data to fit a gamma distribution and then estimated a mean serial interval of 5.8 days and incubation period of 5.2 days, from which they inferred the extent of infectiousness prior to symptom onset. Limitations: Self-reported date of symptom onset.
Implications: Tracing contacts of COVID-19 cases from the 2-3 days before symptom onset may increase the utility of efforts to control further transmission.
Figure
Corrected Figure
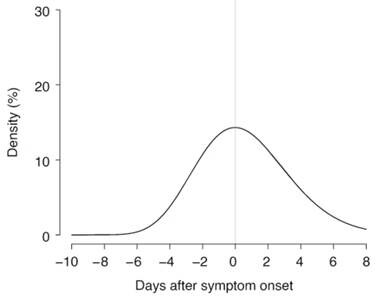
Note: From He et al. Modeled COVID-19 infectiousness started 2.3 days before symptom onset, peaked 0.7 days before symptom onset, and then waned over 8 days. Corrected figure modeled COVID‐19 infectiousness and found that although infectiousness preceded symptom onset by as much as 12 days, most secondary transmissions occurred in the 3 days prior to symptom onset in the index case and then waned over 8 days. Reprinted by permission from Springer Nature Customer Service Centre GmbH: Springer Nature, Nature Medicine volume 26, pages1491–1493 (2020) Temporal dynamics in viral shedding and transmissibility of COVID-19. He et al., COPYRIGHT 2020.
Correction issued by authorsexternal icon on August 7, 2020.
The authors re-estimated the original infectiousness profiles and found that although the estimation that 44% of secondary cases were infected before the index case had symptoms, infectiousness could have started at 12.3 days prior (versus 2.3 days in the original text). In the re-estimated profile, infectiousness peaked at symptom onset (versus –0.7 days in the original text). However, <0.1% of these secondary transmissions would have occurred before 7 days, 1% before 5 days and 9% before 3 days prior to symptom onset in the index case. The authors thus conclude “from a contact-tracing viewpoint, it may be adequate to enquire about close contacts up to 3 days before the index first shows symptoms.”
Epidemiology and transmission of COVID-19 in 391 cases and 1286 of their close contacts in Shenzhen, China: a retrospective cohort study.external icon Bi et al. Lancet Infectious Diseases (April 27, 2020).
Key findings:
- Without contact tracing COVID-19 cases were isolated 4.6 days after developing symptoms; contact tracing reduced the time to isolation by 1.9 days.
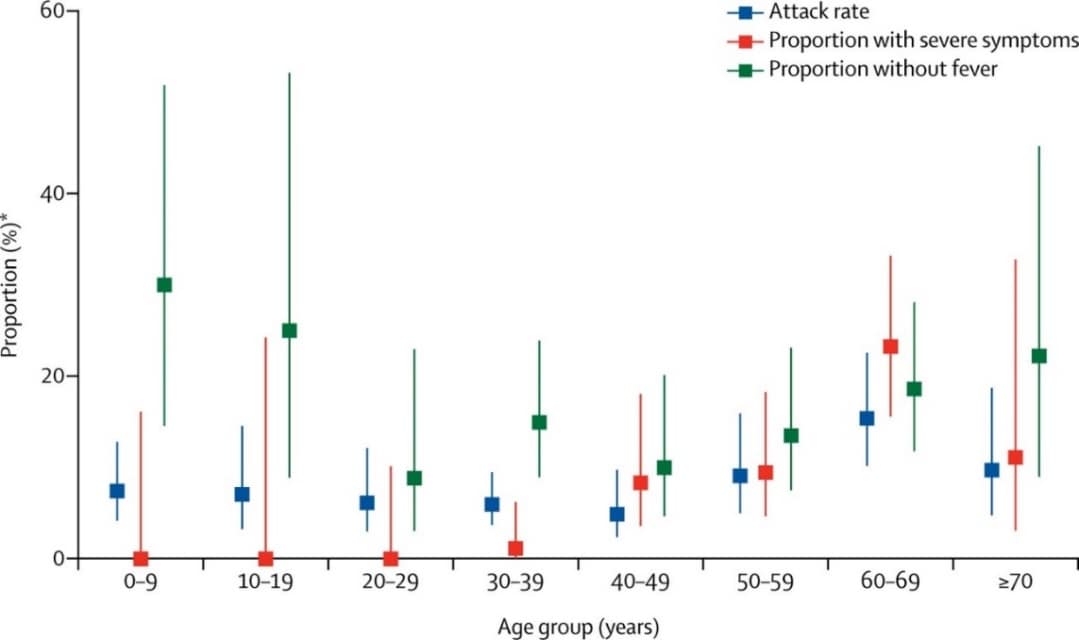
- Among close contacts, children were at a similar risk of SARS-CoV-2 infection as adults (Figure, attack rate noted by blue squares).
- There was a trend of increasing likelihood of severe symptoms for persons aged 40 and older compared with younger adults and children (Figure, red squares), as well as a decreasing likelihood of having fever among younger adults and children compared with other adults (Figure, green squares). However, these differences were not statistically significant.
Methods: Using data from 391 SARS-CoV-2 cases and 1,286 close contacts (household or social), the authors estimated the time from symptom onset to diagnosis and isolation for cases identified through symptomatic surveillance and contact tracing, and analyzed factors influencing transmission risk. Symptomatic cases were isolated and treated at hospitals. Asymptomatic cases found when contact tracing was initiated and who tested positive were also isolated and their close contacts who tested negative were quarantined.
Implications: Isolation and contact tracing combined with testing to identify persons without symptoms (presymptomatic/asymptomatic infections) reduce the time that infectious persons can transmit SARS-CoV-2 in the community. Although children are less likely to exhibit illness and have in other studies often represented a smaller proportion of overall disease burden than adults, in a community outbreak they are as likely as young adults age <50 years to be infected.
Figure:
Note: Adapted from Bi et al. Attack rate (95% CI) among adult and pediatric close contacts of cases, baseline severity, and proportion of cases without fever, at initial assessment by age group. Attack rates were similar across all age categories of infected contacts. *Attack Rate – proportion of close contacts who were infected. This article was published in Lancet Infectious Diseases, Vol 20, Bi et al., Epidemiology and transmission of COVID-19 in 391 cases and 1286 of their close contacts in Shenzhen, China: a retrospective cohort study, Pages 911-919, Copyright Elsevier 2020. This article is currently available at the Elsevier COVID-19 resource center: https://www.elsevier.com/connect/coronavirus-information-centerexternal icon.
PEER-REVIEWED
Thromboembolic events and apparent heparin resistance in patients infected with SARS-CoV-2external icon. Beun et al. International Journal of Laboratory Hematology (April 20, 2020).
Key findings:
- 47% (n = 75) of COVID-19 patients in an ICU had suspected blood clots.
- Four of these patients required exceptionally large doses of heparin to normalize their clotting system. Among these patients:
- Many clotting factors, including factor VIII, fibrinogen, and d-dimers remained elevated after treatment.
- Antithrombin levels generally remained in the normal range, indicating that heparin treatment was normalizing the body’s clotting system.
Methods: Thrombosis (blood clotting) is an emerging issue among persons with COVID-19. Heparin is often used to treat thrombosis, which is a form of coagulopathy or impairment of the body’s clotting system. It can be hard to know how much heparin to use; too much can increase bleeding risk while too little may be insufficient to stop blood clots from forming. Some people are resistant to heparin and require high doses to thin their blood to normalize the body’s ability to clot. In this study, a small subset of patients with coagulopathy presenting as excessive blood clotting required very large doses of heparin treatment. The investigators explored what clotting factors could potentially be used to guide the proper dose of heparin, including factor VIII, d-dimer, fibrinogen, and antithrombin. Limitations: Small case series; pre-treatment baseline values for clotting factors not provided.
Implications: Using an indicator of antithrombin (e.g., anti-Xa test) during heparin treatment for COVID-19-associated coagulopathy may limit excessive use and reduce the risk of life-threatening bleeding.
Potential therapeutic effects of dipyridamole in the severely ill patients with COVID-19external icon. Liu et al. Acta Pharmaceutica Sinica B (April 20, 2020).
Key findings:
- Investigators proposed using dipyridamole to treat COVID-19 because of a potential dual benefit:
- It is a drug used to treat blood clots, which are a form of coagulopathy that is an emerging problem among persons with severe COVID-19.
- The investigators also observed coincidentally that dipyridamole reduced replication of SARS-CoV-2 in vitro.
- COVID-19 patients treated with dipyridamole had multiple benefits compared with those who were not treated with dipyridamole, most notably decreased mortality (7% vs 24%).
Methods: The authors first tested whether dipyridamole reduced SARS-CoV2 replication in vitro. Then they investigated in a “proof-of-concept” open label randomized controlled trial whether dipyridamole improved clinical outcomes among 31 patients from 2 Chinese hospitals: 14 patients on dipyridamole, 17 patients not on dipyridamole; all received ribavirin and corticoids plus standard care. Limitations: Small sample size; trial not blinded; no study arm using an alternative blood thinner was included; clinical recovery was not quantified with RT-PCR data or viral cultures to assess the antiviral effect of dipyridamole.
Implications: Dipyridamole improved clinical outcomes among a small sample of COVID-19 patients. Further research on the issue of dipyridamole for treatment of COVID-19 is needed.
PEER-REVIEWED
A. Factors associated with mental health outcomes among health care workers exposed to coronavirus disease 2019external icon. Lai et al. JAMA Network Open (March 23, 2020).
Key findings:
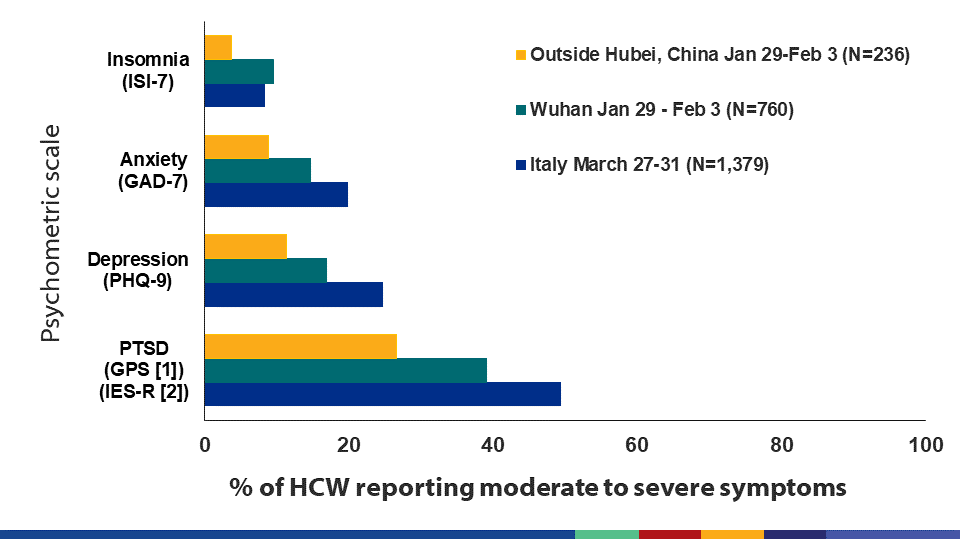
- Among 1,257 healthcare workers (HCW) in China, mental health problems reported during the peak of the local COVID-19 epidemic included: high levels of moderate to severe insomnia (7.8%), anxiety (12.3%), depression (14.8%) and post-traumatic stress disorder (PTSD, 35.0%) (Figure).
- In multivariable logistic regression analyses:
- Female HCW faced significantly greater odds of PTSD (aOR 1.5), anxiety (aOR 1.7) and depression (aOR 1.9) than men.
- HCW with intermediate seniority had significantly greater odds of PTSD (aOR 1.9), anxiety (aOR 1.8) and depression (aOR 1.8) than HCW in more junior or senior positions.
- HCW in front-line positions faced significantly higher odds of PTSD (aOR 1.6), anxiety (aOR 1.6), depression (aOR 1.5) and insomnia (aOR 3.0) than those in second-line positions.
Methods: 1,257 out of 1,840 selected HCW staff (69%) completed self-administered questionnaires that included validated scales for insomnia (ISI-7), anxiety (GAD-7), depression (PHQ-9), and PTSD (IES-R) between January 29 and February 3, 2020. Resultant scores were categorized for each as normal, mild, moderate, or severe. The study relied on two-stage sampling in: 1) secondary and tertiary hospitals; and 2) by geographic region (Wuhan, Hubei Province and outside of Hubei Province). Logistic regression models were used to estimate adjusted odds ratios (ORs) controlling for sociodemographic and other factors. Limitations: One-time cross-sectional survey.
PREPRINTS (NOT PEER-REVIEWED)
B. Mental health outcomes among front- and second-line health workers associated with the COVID-19 pandemic in Italyexternal icon. Rossi et al. medRxiv (April 22, 2020). Publishedexternal icon in JAMA Network Open (May 28, 2020).
Key findings:
- Among HCW in Italy who completed psychometric scales, mental health problems reported during the peak of the local COVID-19 epidemic included: high levels of moderate to severe insomnia (8.3%), anxiety (19.8%), depression (24.7%), and PTSD (49.4%) (Figure).
- In multivariable logistic regression analyses:
- Female HCW faced similarly and significantly greater odds of all outcomes as men (aORs 2.0-2.3), with the exception of insomnia.
- HCW working in front-line positions had significantly greater odds of PTSD (aOR 1.4) than those in second-line positions.
- HCW with colleagues affected by COVID were particularly prone to symptoms of PTSD, depression and insomnia if they had a colleague who died from COVID (aORs 2.1-2.9) and had greater odds of PTSD without other symptoms if a colleague had been hospitalized or quarantined with COVID (aORs 1.5-1.6).
Methods: 1,379 HCW from across Italy were recruited through online snowball sampling and completed the internet survey between March 27 and March 31, 2020. Questionnaire included validated psychometric scales for insomnia (ISI-7), anxiety (GAD-7), and depression (PHQ-9), and a closely related scale for PTSD (Global Post-Traumatic Stress Scale). Multivariable logistic regression model included age, sex, front-line vs second-line work, occupation, and COVID impact on colleagues. Limitations: Cross-sectional data from a self-selected sample.
Figure:
Note: Adapted from Rossi et al. and Lai et al. for Italy and China, respectively, close to the peak of the COVID pandemic. Chinese results are based on a slightly lower anxiety (GAD-7) cutoff for severe anxiety based on validation research in chronically stressed HCW. Results reveal high burden of mental health disorders among HCW during COVID-19 epidemic in China and Italy. Lai et al. licensed under CC BY. Rossi et al. Licensed under CC-BY-NC-ND 4.0.
Implications for 2 studies (Lai et al. & Rossi et al.): Many HCW in China and Italy reported experiencing adverse mental health outcomes. Research is needed on how best to provide adequate psychological support services to HCW and sustain their capacity to work under the stressful conditions of the COVID-19 pandemic.
- Muhammad et al. COVID-19 pandemic and environmental pollutionexternal icon. Science of the Total Environment. Due to a large proportion of people social distancing due to COVID-19 risk, environmental pollution (measured by nitrogen dioxide emission) was reduced up to 30% and mobility was reduced by up to 90%.
- Toscano et al. Guillain–Barré syndrome associated with SARS-CoV-2external icon. NEJM. Case series describing the development of Guillain–Barré syndrome 5-10 days after onset of COVID-19 symptoms in 5 Italian patients from 3 hospitals in northern Italy.
- Zhang et al. A web-based, mobile responsive application to screen healthcare workers for COVID symptoms: descriptive studyexternal icon. medRxiv. COVID Pass, a symptom reporting app, was coupled with mask distribution to enhance mandatory self-report of symptoms among hospital staff to determine if they are cleared for work.
- Goldman et al. The implications of COVID-19 for the care of children living in residential institutionsexternal icon. Lancet Child & Adolescent Health. The closing of residential institutions for children due to COVID-19 places them at risk when they are sent back to their communities or caregivers without proper support.
- Plotkin et al. Extraordinary diseases require extraordinary solutionsexternal icon. Vaccine. Accelerating the path of vaccine development by recruiting young altruistic volunteers to get deliberately exposed to SARS-COV-2 is ethically questionable.
- Hawks et al. COVID-19 in prisons and jails in the United Statesexternal icon. JAMA. On challenges of COVID-19 control in US prisons and jails, including difficulty with social distancing, ability to accommodate surge in sick calls, controlling outbreaks once they occur, and preparing release into the community.
- Graeden et al. Answering the right questions for policymakers on COVID-19external icon. Lancet Global Health. On the need to bridge science and policy during emergencies through effective communication, focused on 5 key questions policy makers can answer.
Rosenberg A. Cultivating deliberate resilience during the coronavirus disease 2019 pandemicexternal icon. JAMA. On the importance of cultivating “deliberate resilience” during the pandemic.
The article, Presenting characteristics, comorbidities, and outcomes among 5700 patients hospitalized with COVID-19 in the New York City areaexternal icon, which was published online April 22, 2020 in JAMA and featured in the April 28, 2020 Science Update, was corrected on April 24, 2020. In all, 1151 patients received invasive mechanical ventilation (IMV). Of these, 38 (3.3%) were discharged, 282 (24.5%) died, and 831 (72.2%) remained in the hospital at the end of data collection. The original published article, as well as the April 28, 2020 Science Update, correctly reported that among the 320 patients who were discharged or died, 282 (81.1%) died. However, the corrected version of the article omits this percentage, and instead reports the percentage who died (24.5%) among all who received IMV (n = 1,151).
Disclaimer: The purpose of the CDC COVID-19 Science Update is to share public health articles with public health agencies and departments for informational and educational purposes. Materials listed in this Science Update are selected to provide awareness of relevant public health literature. A material’s inclusion and the material itself provided here in full or in part, does not necessarily represent the views of the U.S. Department of Health and Human Services or the CDC, nor does it necessarily imply endorsement of methods or findings. While much of the COVID-19 literature is open access or otherwise freely available, it is the responsibility of the third-party user to determine whether any intellectual property rights govern the use of materials in this Science Update prior to use or distribution. Findings are based on research available at the time of this publication and may be subject to change.
![05-01_figure1 Frequency of general non-respiratory symptoms in HCWs for 7 symptoms; significant difference (p[less than symbol]0.001) between positive vs. negative observed for all 7 symptoms.](/library/covid19/images/05-01_figure1.png?_=44244)
