COVID-19 Science Update released: March 19, 2021 Edition 81

The COVID-19 Science Update summarizes new and emerging scientific data for public health professionals to meet the challenges of this fast-moving pandemic. Weekly, staff from the CDC COVID-19 Response and the CDC Library systematically review literature in the WHO COVID-19 databaseexternal icon, and select publications and preprints for public health priority topics in the CDC Science Agenda for COVID-19 and CDC COVID-19 Response Health Equity Strategy.
Section headings in the COVID-19 Science Update align with the CDC Science Agenda for COVID-19.
Section headings in the COVID-19 Science Update have been changed to align
with the CDC Science Agenda for COVID-19.
Here you can find all previous COVID-19 Science Updates.
PEER-REVIEWED
Clinical and economic effects of widespread rapid testing to decrease SARS-CoV-2 transmissionexternal icon. Paltiel et al. Annals of Internal Medicine (March 9, 2021).
Key findings:
- Projected yield of a national weekly home-based SARS-CoV-2 testing program compared with status quo (base case):
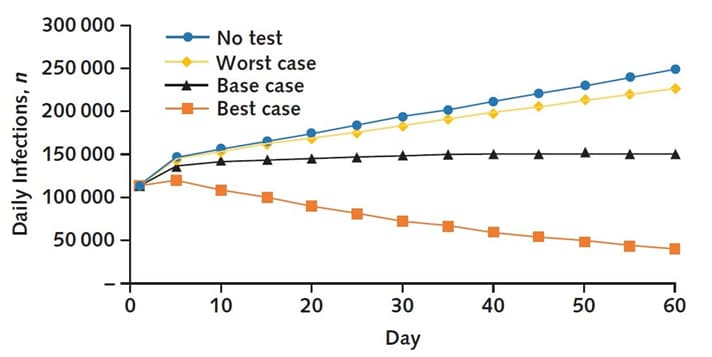
- 8 million averted infections (Figure) and 15,700 averted deaths.
- Cost and cost-effectiveness outcomes versus status quo:
- Incremental cost = $22.3 billion.
- Incremental cost per infection averted = $7,890.
- Incremental cost per death averted = $1.4 million.
Methods: A modified susceptible-exposed-infected-recovered (SEIR) model was used to assess costs and outcomes of home-based SARS-CoV-2 rapid antigen testing under 3 behavioral assumptions compared with no testing intervention (status quo). Analysis used a societal perspective with a 60-day time horizon. Key assumptions: 50% use of home testing kits, 50% self-isolation upon testing positive and effective reproductive number Rt =1.3. Limitations: Short (60 day) time horizon limited ability to project lifetime outcomes; analyses restricted to home-based testing; uncertainty around test performance parameters.
Implications: Incremental cost per death averted compares favorably to commonly accepted willingness to pay values per statistical life saved ($5–$17 million) even under pessimistic behavioral assumptions. High-frequency home testing for SARS-Co-V-2 could contribute to pandemic control and warrants consideration as part of a national containment strategy.
Figure:
Note: Adapted from Paltiel et al. Daily SARS-CoV-2 infections reported for no home-based testing and home-based testing with 3 behavioral scenarios: worst case; base case; and best case; with respect to the percentage of persons who use home-based test kits; self-isolate following a positive test; and abandon isolation. Permission request in process.
PREPRINTS (NOT PEER-REVIEWED)
Wastewater surveillance of SARS-CoV-2 across 40 U.S. states.external icon Wu et al. medRxiv (March 14, 2021).
Key findings:
- 846 of 1,751 samples were positive for SARS-CoV-2 RNA.
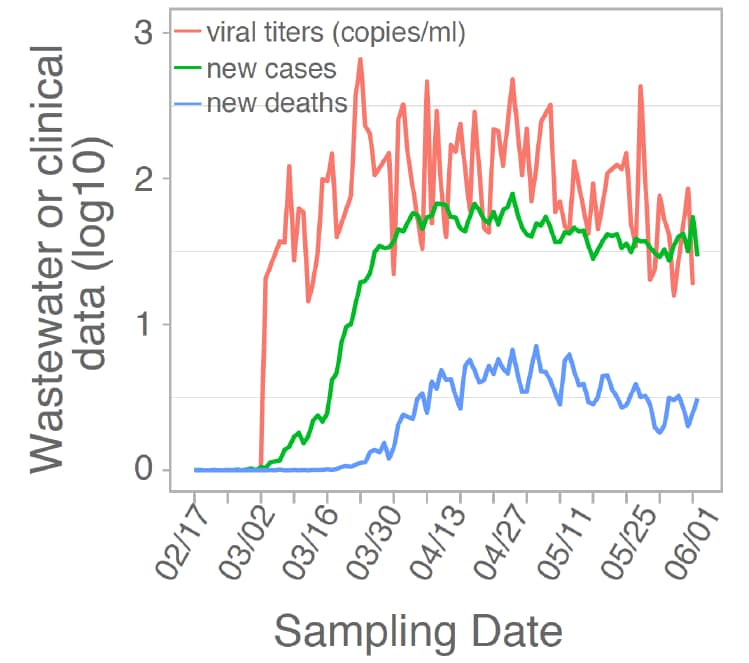
- Wastewater viral titers preceded or were consistent with clinical indictors such as daily new cases and deaths in the same counties (Figure).
- Wastewater-based SARS-CoV-2 monitoring had a >80% detection rate when local daily incidence rates of SARS-CoV-2 infection were >13 cases per 100,000 people.
Methods: Wastewater samples (n = 1,751) from 353 unique sites in 159 counties were collected between February and June 2020 to identify viral concentrations of SARS-CoV-2 using RT-qPCR. Limitations: Program covered ~13% of US population; sample collection varied widely by month (5.1% from March, 55.5% from May); assumed equal incidence rate throughout a county.
Implications: Wastewater levels of SARS-CoV-2 largely parallel – and even precede – clinical and epidemiologic indicators of disease. These data, which appear to be the largest yet on wastewater disease surveillance suggest it can be a feasible and effective tool for monitoring SARS-CoV-2. In a separate paper, Pérez-Cataluñaexternal icon et al. report that wastewater can be used to sequence emerging SARS-Co-V-2 variants.
Figure:
Note: Adapted from Wu et al. Trends in mean viral concentrations from wastewater samples averaged by date, new cases of COVID-19, and COVID-19-related new deaths, February to June 2020. Licensed under CC-BY-NC-ND 4.0
PEER-REVIEWED
Effectiveness of three versus six feet of physical distancing for controlling spread of COVID-19 among primary and secondary students and staff: a retrospective, state-wide cohort study.external icon van den Berg et al. Clinical Infectious Diseases (March 10, 2021).
Key findings:
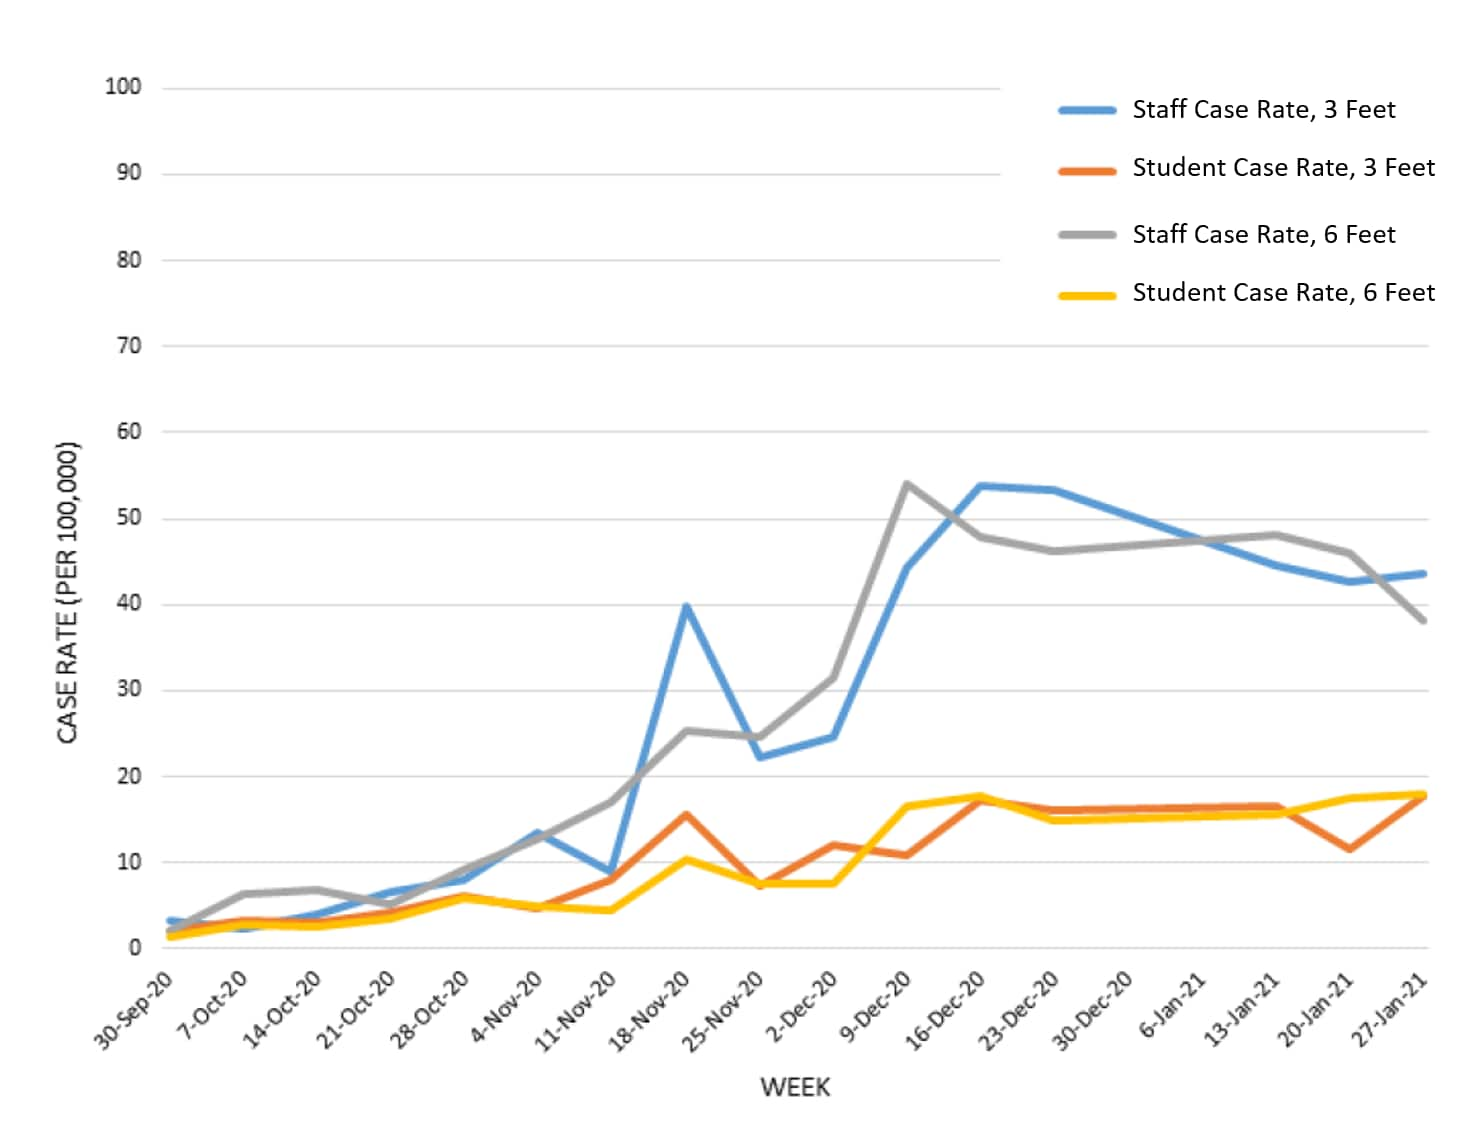
- There were no significant differences between SARS-CoV-2 case rates in public school districts that reported ≥3 ft. vs. ≥6 ft. physical distancing policies for K-12 students (incidence rate ratio (IRR) = 0.891, 95% CI 0.594-1.335) and staff (IRR = 1.015, 95% CI 0.754-1.365) (Figure).
Methods: Retrospective cohort study of 537,336 students and 99,390 staff attending in-person instruction from September 24, 2020–January 27, 2021 in 251 eligible school districts in Massachusetts. SARS-CoV-2 case counts reported to the Massachusetts Department of Elementary and Secondary Education, community incidence rates, and district infection control plans were linked. Limitations: Physical distancing classification (3 ft. vs. 6 ft. rule) was based on district-level public data on infection control plans and fidelity does not appear to have been ascertained, misclassification bias toward the null cannot be ruled out; asymptomatic cases not identified and detailed contact tracing data unavailable, resulting in potential underestimates of in-school transmission and incidence.
Implications: Provided other mitigation measures (e.g., universal masking) are implemented and adhered to, lowering physical distancing policies in school settings might not negatively impact student or staff safety.
Figure:
Note: Adapted from van den Berg et al. Incidence of COVID-19 cases among staff from schools with 3-foot physical distancing policies, students from schools with 3-foot physical distancing policies, staff from schools with 6-foot physical distancing policies, and students from schools with 6-foot physical distancing policies. US Government work not subject to copyright.
Seasonal variation in airborne infection risk in schools due to changes in ventilation inferred from monitored carbon dioxide.external icon Vouriot et al. Indoor Air (March 8, 2021).
Key findings:
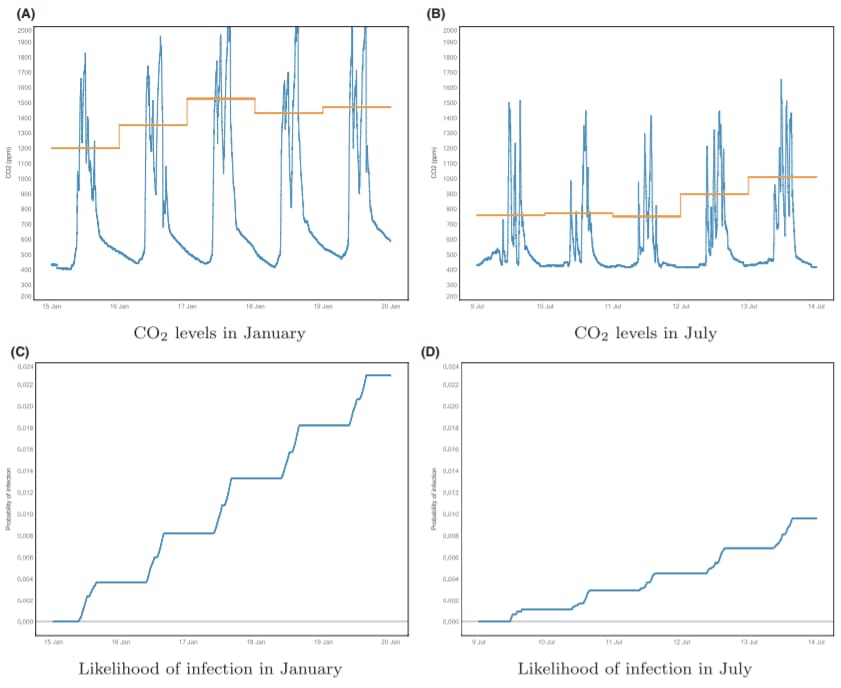
- Despite similar presumed occupancy and activity levels, secondary infection from airborne transmission of SARS-CoV-2 was estimated to be more than twice as likely in January as in July (Figure).
- There can be wide variation between classrooms in the same school in expected secondary infections.
Methods: Data from 45 CO2 monitored classrooms in 11 UK schools were used to estimate likelihood of airborne transmission in classrooms and expected secondary infections, using a mathematical modeling approach successfully applied to influenza, measles, and rhinovirus. Limitations: Used pre-pandemic historical data (January and July 2018); seasonal variation in ventilation might differ in schools; variation in droplet and contact transmission, and in airborne transmission based on factors other than ventilation (e.g., humidity) was not evaluated.
Implications: SARS-CoV-2 transmission risk within classrooms should not be assumed to remain constant throughout the year even if mitigation measures such as distancing and masking and if community transmission rates remain similar. CO2 monitoring could be evaluated as marker for ventilation and associated SARS-CoV-2 transmission risk.
Figure:
Note: Adapted from Vouriot et al. A and B: Variation in CO2 levels within classroom Y1-2 in January (A) and July (B) 2018 with the daily averaged CO2 during occupied periods (defined for school classrooms as between 09:00 and 16:00). The bottom panels (C and D) show the corresponding probability of infection (assuming q = 1 quanta/h) in January (C) and July (D) 2018. Licensed under CC-BY.
PREPRINTS (NOT PEER-REVIEWED)
Early estimates of SARS-CoV-2 B.1.1.7 variant emergence in a university setting.external icon Johnson et al. medRxiv (March 9, 2021).
Key findings:
- Relative frequency of B.1.1.7 to wild-type SARS-CoV-2 at the university grew logistically at a daily rate of 0.077 (95% CI 0.017-0.140), corresponding to a doubling every 9 days.
- Estimated proportion of SARS-CoV-2 infections caused by B.1.1.7 increased from 2.7% (95% CI 0.7%-7.6%) to 17.9% (95% CI 9.6-29.4) over ~ 1
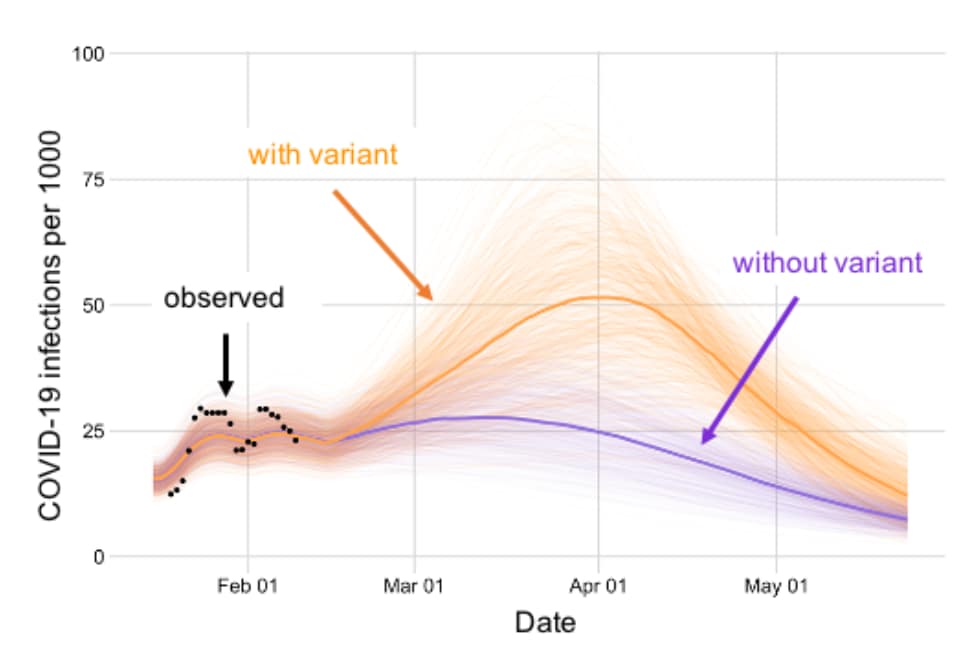
- The emergence of B.1.1.7, with an assumed transmissibility of 1.56 times that of wildtype SARS-CoV-2, is projected to result in 77% (95% CI 39%-140%) more cumulative infections during the spring semester than in the absence of the variant (Figure).
Methods: Prevalence of SARS-CoV-2 B.1.1.7 variant was estimated using positive PCR tests and number of S gene target failures from 17,003 tests from University of Texas (UT) students (January 16, 2021–February 12, 2021). Bayesian modeling was used to estimate growth rate of B.1.1.7 prevalence among SARS-CoV-2 infections at UT and a SEIR model of SARS-CoV-2 transmission was used to project the future impact of B.1.1.7 on COVID-19 burden. Model assumes that B.1.1.7 is 1.56 times more transmissible than wild type. Limitations: Assumes tests are from representative sample of the University of Texas community.
Implications: Modeling suggests that B.1.1.7 is rapidly becoming the dominant variant at the University of Texas and has the potential to drive a major surge of infection in spring 2021 in a community that will likely not be widely vaccinated before summer 2021.
Figure:
Note: Adapted from Johnson et al. Projected COVID-19 cases with and without the B.1.1.7 variant with the seven-day average for reported positive cases per 1000. Light lines display 500 simulations; bold lines indicate the median projected value on each day. Licensed under CC-BY-ND 4.0.
Population-based estimates of post-acute sequelae of SARS-CoV-2 infection (PASC) prevalence and characteristics: A cross-sectional study.external icon Hirschtick et al. medRxiv (March 10, 2021).
Key findings:
- Persistent symptoms were highly prevalent ≥30 days (5%) and ≥60 days (35.0%) post COVID-19 onset, even among persons reporting mild symptoms (29.2% and 24.5%, respectively).
- Persons reporting very severe (vs. mild) symptoms were more likely to have symptoms at ≥30 (adjusted prevalence ratio [aPR] 2.25, 95% CI 1.46-3.46) and ≥60 (aPR 1.71, 95% 1.02-2.88) days.
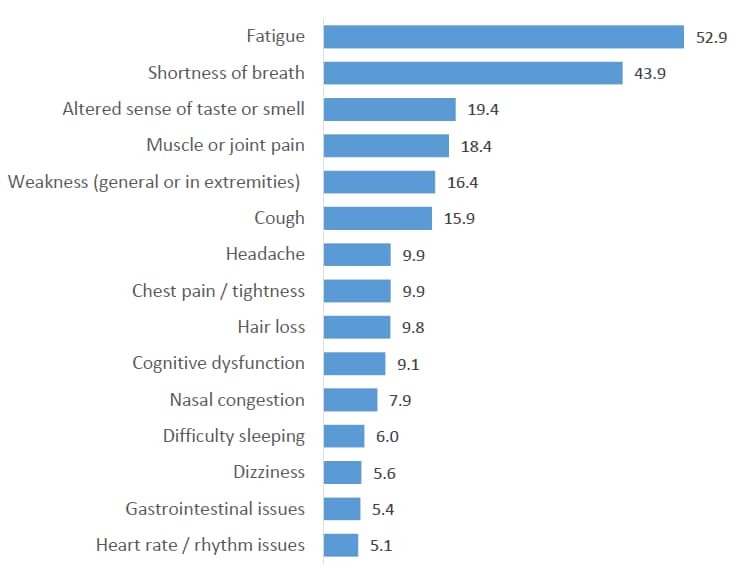
- The most common symptoms at ≥60 days were fatigue and shortness of breath (Figure).
- Compared with higher-income (≥$75,000) persons, persons with lower income were more likely to have symptoms at ≥30 days (<$35,000, aPR 1.40, 95% CI 1.09-1.79; $35,000-$74,999, aPR 1.38, 95% CI 1.09-1.75).
Methods: Population-based cross-sectional survey of a probability sample (n = 593) of non-institutionalized adults with confirmed COVID-19 in the Michigan Disease Surveillance System (MDSS) who completed an online or telephone survey in English, Spanish, or Arabic, between June and December 2020. Limitations: Potential response and recall bias; might overrepresent persons more likely to obtain SARS-CoV-2 testing (e.g., with more severe disease or higher income).
Implications: Millions of COVID-19 survivors might face post-acute sequelae of SARS-CoV-2 infection requiring availability of treatment as well as guidance for patients, their caregivers, and health care providers.
Figure:
Note: Adapted from Hirschtick et al. Prevalent symptoms (%) among respondents with persistent symptoms at least 60 days post COVID-19 onset (n = 170). Licensed under CC-BY-NC-ND 4.0.
Anti-SARS-CoV-2 Serology persistence over time in COVID-19 Convalescent Plasma Donors.external icon De Giorgi et al. medRxiv (March 10, 2021).
Key findings:
- A positive correlation between SARS-CoV-2 IgG antibodies and neutralizing activity was found at initial presentation (Figure).
- 91.1% (184/202) of donors had detectable IgG Ab.
- 73.8% (149/202) of donors had measurable neutralizing activity.
- SARS-CoV-2 IgG Ab levels decreased in 56.2% (59/105) of repeat plasma donors.
- Neutralizing activity decreased in 27.6% (29/105) or did not change in 29.5% (31/105) of repeat plasma donors.
- No cases of reinfection were identified within study timeframe.
Methods: Prospective longitudinal study of 202 plasma donors who had recovered from molecular or serology confirmed SARS-CoV-2 infection from April–November 2020. Plasma was collected at least 28 days apart and was tested for SARS-CoV-2 antibodies. Neutralization assays were also performed on plasma samples. Limitations: Generalizability limited; sample consisted of plasma donors with mostly mild symptoms.
Implications: Results show that even in mild cases of COVID-19 there remains a sustained immunological memory of circulating IgG and neutralizing Abs for at least 9 months post recovery. Longer term studies tracking Ab levels need to be conducted to determine trends in immune system memory.
Figure:
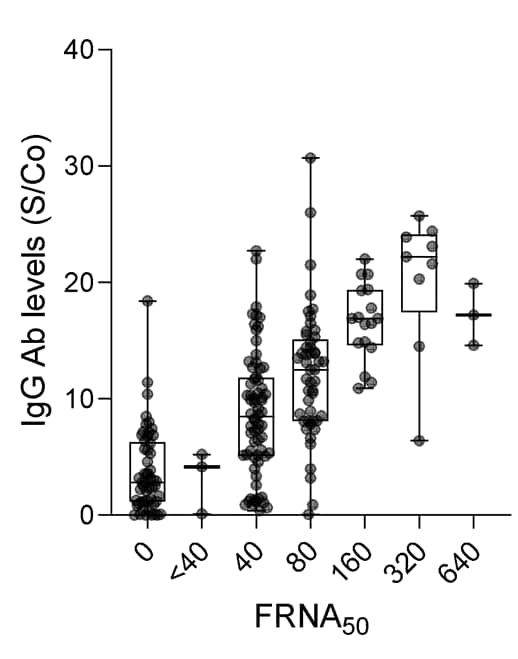
Note: Adapted from De Giorgi et al. Distribution of SARS-CoV-2 IgG antibody levels as a function of neutralizing activity (FRNA50) at initial donation. Boxplots indicate median value with 1st and 3rd quartiles, and bars span minimum and maximum values. Individual patient values are indicated by dots. Figure permission granted by authors.
PEER-REVIEWED
Acute allergic reactions to mRNA COVID-19 vaccines.external icon Blumenthal et al. JAMA (March 8, 2021).
Key findings:
- 98% of health care workers (HCW) who received an mRNA COVID-19 vaccine did not have symptoms of an allergic reaction.
- Acute allergic reactions were slightly more frequent with the Moderna vaccine (2.20%, 95% CI 2.06%-2.35%) compared with Pfizer-BioNTech (1.95%, 95% CI 1.79%-2.13%).
- Anaphylaxis occurred at a rate of 2.47 cases per 10,000 vaccinations with similar rates between the Moderna and Pfizer-BioNTech vaccines.
- Anaphylaxis was confirmed in 16 HCWs, of whom 63% (n = 10) reported prior allergic reaction and 31% (n = 5) reported prior anaphylaxis.
Methods: Prospective observational cohort of Mass General Brigham employees (n = 64,900), from December 16, 2020–February 12, 2021 who received 1st dose of an mRNA COVID-19 vaccine, with follow-up through February 18, 2021. For 3 days after vaccination, employees completed symptom surveys. Anaphylaxis was confirmed via medical record review. Limitations: Use of self-reported data to identify potential anaphylaxis cases; may not be generalizable.
Implications: Risk of anaphylaxis following an mRNA COVID-19 vaccine appears to be comparable to other common health care exposures. Likewise, the overall risk of allergic reaction to mRNA COVID-19 vaccines was also extremely low.
PREPRINTS (NOT PEER-REVIEWED)
COVID-19 vaccine response in pregnant and lactating women: a cohort study.external icon Gray et al. medRxiv (March 8, 2021).
Key findings:
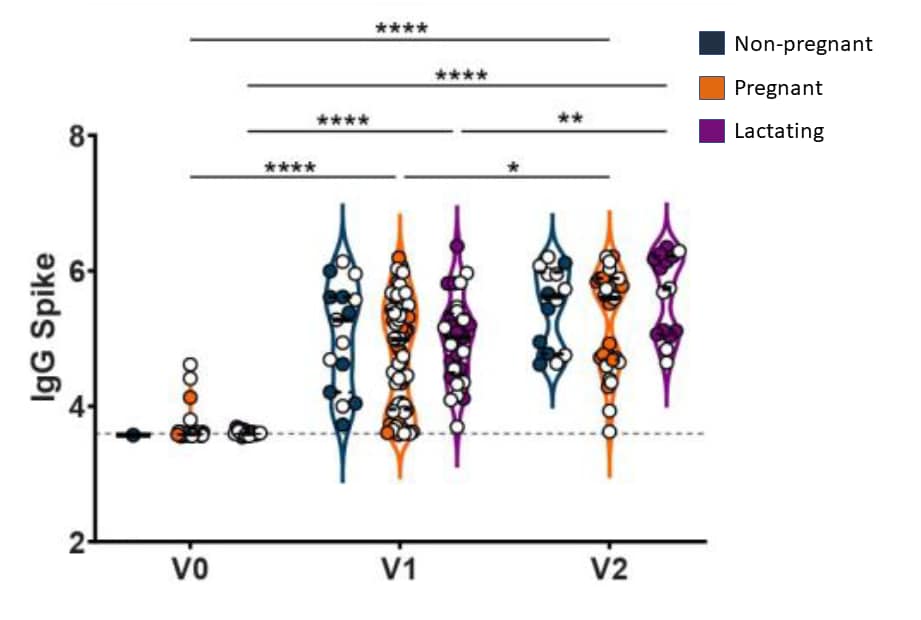
- Robust IgG titers were seen among vaccinated pregnant, lactating, and non-pregnant women (Figure).
- Vaccine side effects did not differ between pregnant, lactating, or non-pregnant women.
- IgG was detected in breastmilk, with a significant increase after 2nd vaccine dose.
- Among vaccinated mothers, spike and SARS-CoV-2 receptor binding domain-specific IgG were detected in 100% of umbilical cord blood.
Methods: Prospective cohort study of pregnant (n = 84), lactating (n = 31), and non-pregnant (n = 16) women between December 17, 2020 and March 2, 2021, who were vaccinated with either the Pfizer-BioNTech or Moderna mRNA COVID-19 vaccines, to determine immunogenicity, reactogenicity, and potential maternal transfer of vaccine antibodies. Antibody titers against SARS-CoV-2 were quantified in participant sera (n = 131) and breastmilk (n = 31) at baseline/time of 1st vaccine dose (V0), 2nd vaccine dose (V1), and 2–6 weeks post 2nd vaccine (V2) and in umbilical cord sera (n = 10) at time of delivery. Limitations: Small sample size; potential risks to the fetus not assessed, all women who delivered during the study period were vaccinated in their 3rd trimester.
Implications: mRNA Covid-19 vaccination in pregnancy and lactation generated robust humoral immunity with similar side effect profiles compared with vaccination among nonpregnant women. Immune transfer via placenta and breastmilk may provide some protection to infants. A case report by Gill et al.external icon has also documented passage of transplacental antibodies for SARS-CoV-2 following vaccination with an mRNA vaccine in the third trimester. Because pregnant women were not included in SARS-CoV-2 vaccine trials, studies such as these provide important data to inform decision-making around vaccination during pregnancy.
Figure:
Note: Adapted from Gray et al. Violin plot shows the log10 transformed IgG Spike-specific titers across V0, V1, and V2 time points collected from vaccinated non-pregnant, pregnant, and lactating participants. Open circles indicate Pfizer-BioNTech vaccinees and closed circles indicate Moderna vaccinees; * p <0.05, ** p <0.01, **** p <0.0001 for differences between time points. Used by permission of authors.
Neutralization heterogeneity of United Kingdom and South-African SARS-CoV-2 variants in BNT162b2-vaccinated or convalescent COVID-19 healthcare workers.external icon Marot et al. bioRxiv (March 5, 2021).
Key findings:
- Percentages of complete neutralization against variants three weeks after first vaccine dose were:
- 52% against D614G.
- 24% against B.1.1.7.
- 8% against B.1.351.
- 96% of all sera completely neutralized B.1.1.7 and B.1.351 variants 7 days after second vaccine dose.
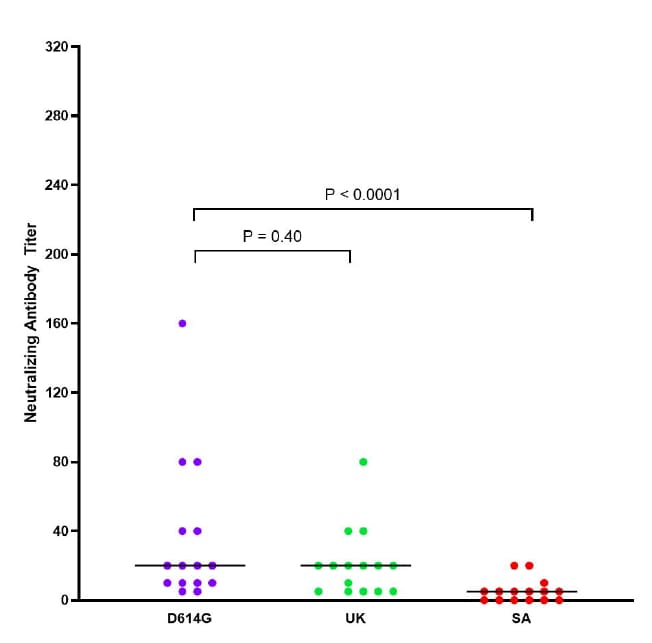
- Percentages of complete neutralization against variants 6 months after symptom onset were (Figure):
- 100% against D614G and B.1.1.7.
- 60% against B.1.351.
Methods: Cohort study of 15 health care workers with past mild COVID-19 from March 2020 and a group of 29 infection-naïve participants immunized with the Pfizer-BioNTech (BNT162b2) vaccine. Convalescent sera was collected 6 months after symptom onset, and serum from vaccinees was collected at 3 weeks after 1st dose, and at 7 days after 2nd dose. Serum samples were tested for complete (100%) neutralization against three SARS-CoV-2 variants: D614G, B.1.1.7, and B.1.351. Limitations: Small sample size.
Implications: Given low levels of complete neutralization 3 weeks after first vaccine dose, recommendations for extending the dosing interval may have to be revisited as individuals may still be susceptible to SARS-CoV-2 infection. Even in those with acquired immunity, complete neutralization became low after 6 months, suggesting that those with past mild COVID-19 should get vaccinated.
Figure:
Note: Adapted from Marot et al. Neutralization antibody (NAb) titer against clinical isolates of D614G, B.1.1.7, and B.1.351 SARS-CoV-2 variants from healthcare workers 6 months post symptom onset. Horizontal bars are median titer values. Licensed under CC-BY-NC 4.0.
Natural History of SARS-CoV-2 Infection
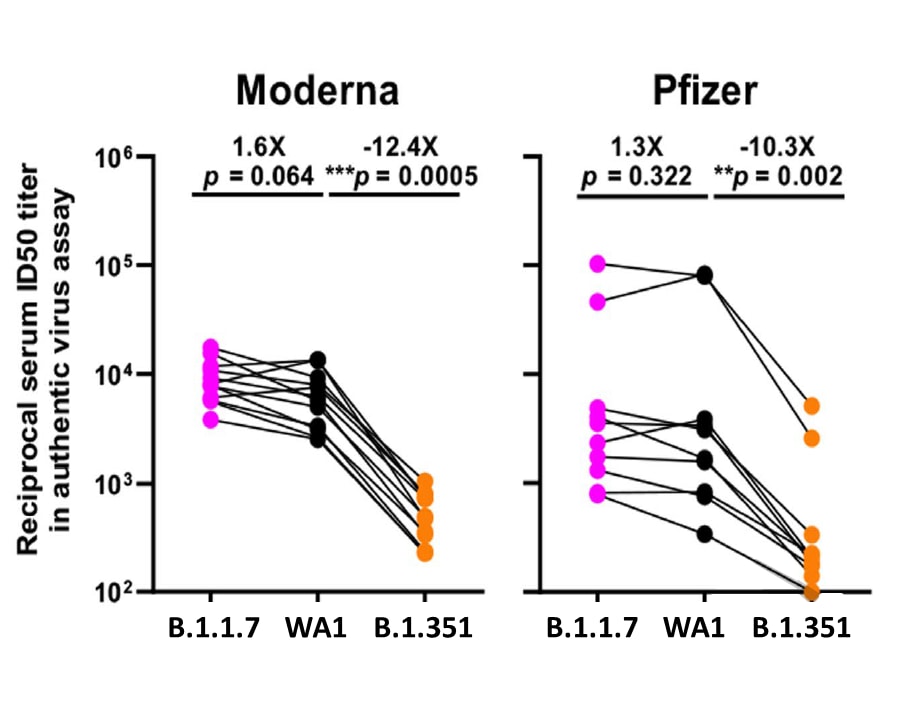
- Wang et al. Antibody resistance of SARS-CoV-2 variants B.1.351 and B.1.1.7external icon. Nature (March 8, 2021). A series of experiments found that the B.1.351 variant was refractory to many monoclonal antibodies (mABs) and resistant to neutralization of convalescent plasma and vaccinee sera; rampant viral spread with critical mutations could necessitate having to chase an evolving SARS-CoV-2, much like influenza.
Figure:
Note: Adapted from Wang et al. Change in reciprocal serum ID50 values for Moderna and Pfizer vaccinees against B.1.1.7 and B.1.351 relative to the wild type (WA1). Mean fold change in ID50 relative to the WT is written above p values. Permission request in process.
- Tse et al. Emergence of a severe acute respiratory syndrome coronavirus 2 virus variant with novel genomic architecture in Hong Kongexternal icon. Clinical Infectious Diseases (March 2, 2021). Describes the organization and lineage of a SARS-CoV-2 variant containing the largest genetic deletion still capable of transmission to date; the clinical significance of the variant is not described within the article.
Detection, Burden, and Impact
- Perlis et al. Association of acute symptoms of COVID-19 and symptoms of depression in adultsexternal icon. JAMA (March 12, 2021). In a self-reported cross-sectional online survey (n = 3,904), 52.4% of participants met criteria for moderate or greater depressive disorder; depressive symptoms were more common among younger persons (vs. older), men (vs. women), and those who reported greater severity of COVID-19 symptoms (vs. lower severity).
Transmission of SARS-CoV-2
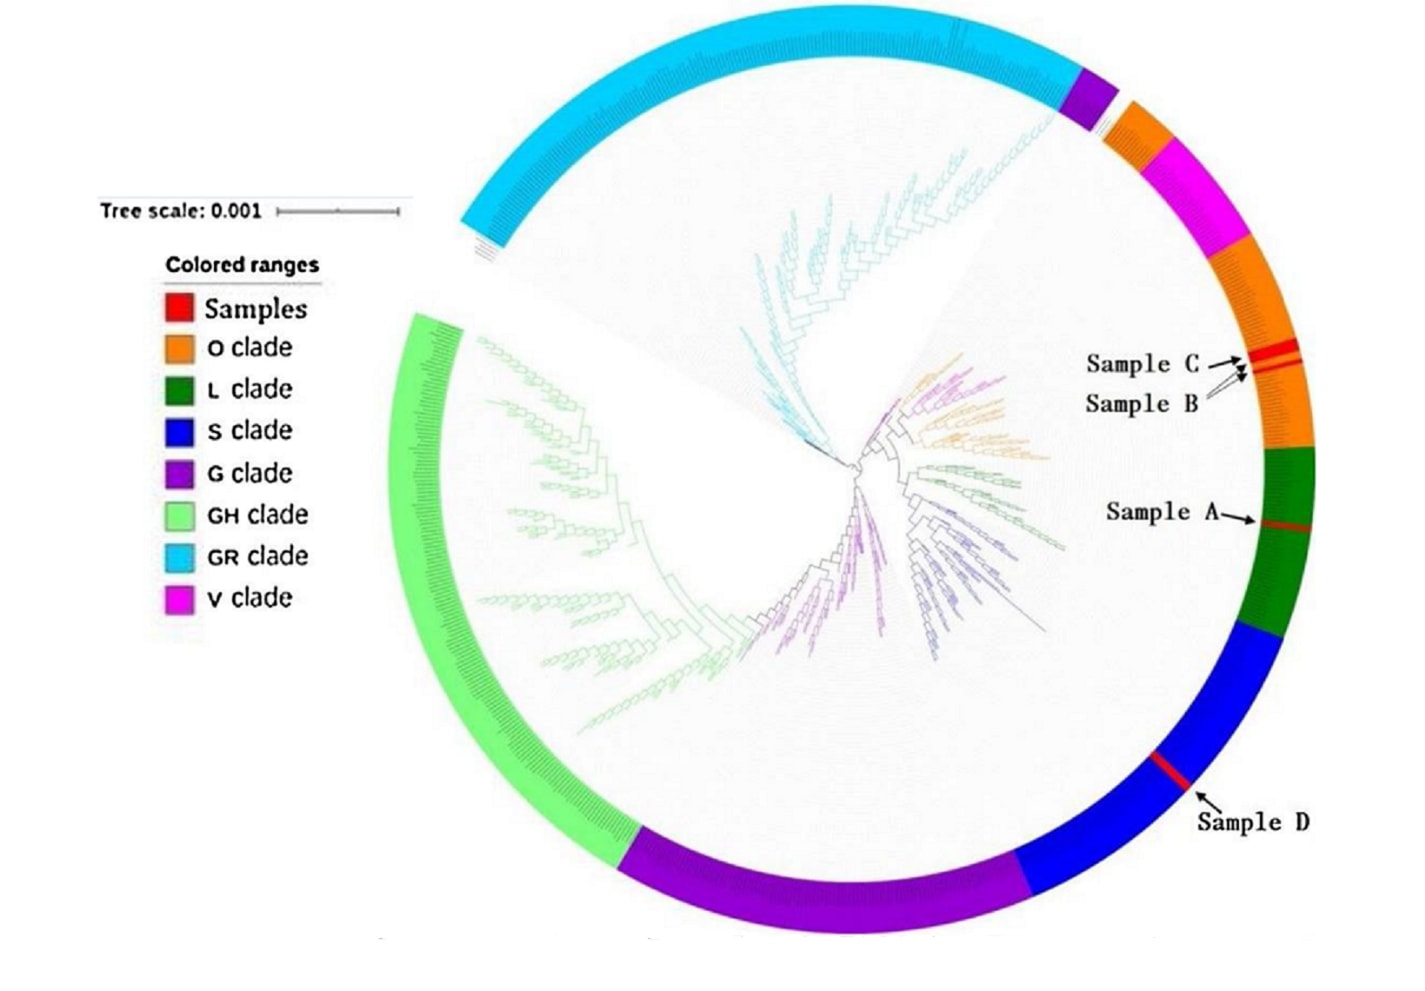
- Liu et al. Duration of SARS-CoV-2 positive in quarantine room environments: A perspective analysisexternal icon. International Journal of Infectious Diseases (February 10, 2021). Surface smear samples from quarantine rooms of 39 COVID-19 cases, tested using nucleic acid detection and genomic sequencing, found that the highest contamination was on moist surfaces (e.g., cups, sink, toilet seat), and that surface contamination might be associated with patient respiratory tract viral load.
Figure:
Note: Adapted from Liu et al. Phylogenetic trees of genetic sequences. The red color refers to fragments of RNA polymerase of Sample A (42357), B (42961), C (43432) and D (45796). Licensed under CC-BY-NC-ND 4.0.
- Kozer et al. Presence of SARS-CoV-2 RNA on playground surfaces and water fountainsexternal icon. Epidemiology & Infection (March 8, 2021). Environmental samples (n = 43) from 6 Israeli cities with high SARS-CoV-2 prevalence detected SARS-CoV-2 (RT-PCR) in 4.6% of playground equipment samples and 4% of water fountain samples all located in shaded areas; all samples exposed to sunlight were negative.
Prevention, Mitigation, and Intervention Strategies
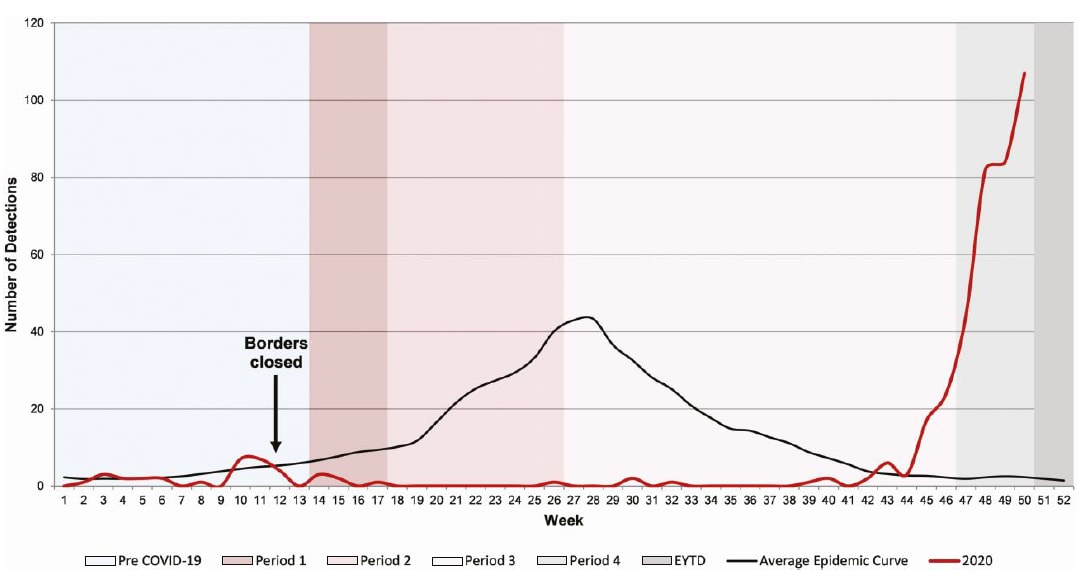
- Foley et al. The interseasonal resurgence of respiratory syncytial virus in Australian children following the reduction of coronavirus disease 2019–related public health measuresexternal icon. Clinical Infectious Diseases (February 17, 2021). In Australia, reduction in COVID-19-related prevention measures led to an increase in respiratory syncytial virus (RSV) with significantly higher median patient age compared with past years.
Figure:
Note: Adapted from Foley et al. RSV detection in children from metropolitan Western Australian up to week 50 of 2020, in the context of COVID-19 restrictions, compared with average epidemic curve (2012–2019). Permission request in process.
- Abdul-Mutakabbir et al. A three-tiered approach to address barriers to COVID-19 vaccine delivery in the Black communityexternal icon. Lancet Global Health (March 10, 2021). A 3-tiered program that included: 1) engagement of Black faith leaders; 2) delivery of education about vaccination by Black healthcare professionals; and 3) a multidisciplinary mobile vaccination effort, was used to boost vaccinate rates among the Black population.
- Alcázar-Arroyo et al. Rapid decline of anti-SARS-COV-2 antibodies in patients on hemodialysis. The COVID-FRIAT Studyexternal icon. Clinical Kidney Journal (March 9, 2021). Observational cohort of 763 COVID-19 patients on hemodialysis found declining SARS-CoV-2 antibodies (Abs) 4 weeks from baseline; this decay of Ab titers is earlier than the general population and raises questions about vaccine efficacy in this patient population.
- Foley et al. Centenarians and extremely old people living with frailty can elicit durable SARS-CoV-2 spike specific IgG antibodies with virus neutralization functions following virus infectionexternal icon. medRxiv (Preprint, March 8, 2021). Humoral responses to SARS-CoV-2 in 15 extremely old, frail, long-term care facility patients were detectable after 60 days from time of diagnosis, suggesting that persons of extreme old age may be protected if re-exposed to the same variant.
- Miller et al. COVID-19 case investigation and contact tracing in central Washington State, June–July 2020external icon. Journal of Community Health (March 10, 2021). An evaluation of COVID-19 case investigation and contact tracing (June–July 2020) in Washington State revealed that most persons with COVID-19 reported having no close contacts; highlighting the need for increased community engagement and public messaging to improve the impact of contact tracing.
Disclaimer: The purpose of the CDC COVID-19 Science Update is to share public health articles with public health agencies and departments for informational and educational purposes. Materials listed in this Science Update are selected to provide awareness of relevant public health literature. A material’s inclusion and the material itself provided here in full or in part, does not necessarily represent the views of the U.S. Department of Health and Human Services or the CDC, nor does it necessarily imply endorsement of methods or findings. While much of the COVID-19 literature is open access or otherwise freely available, it is the responsibility of the third-party user to determine whether any intellectual property rights govern the use of materials in this Science Update prior to use or distribution. Findings are based on research available at the time of this publication and may be subject to change.

